Hello dear Hivers,
here are the:
$BEER Statistics For The Last 7 Days, 2025-07-25 to 2025-08-01:
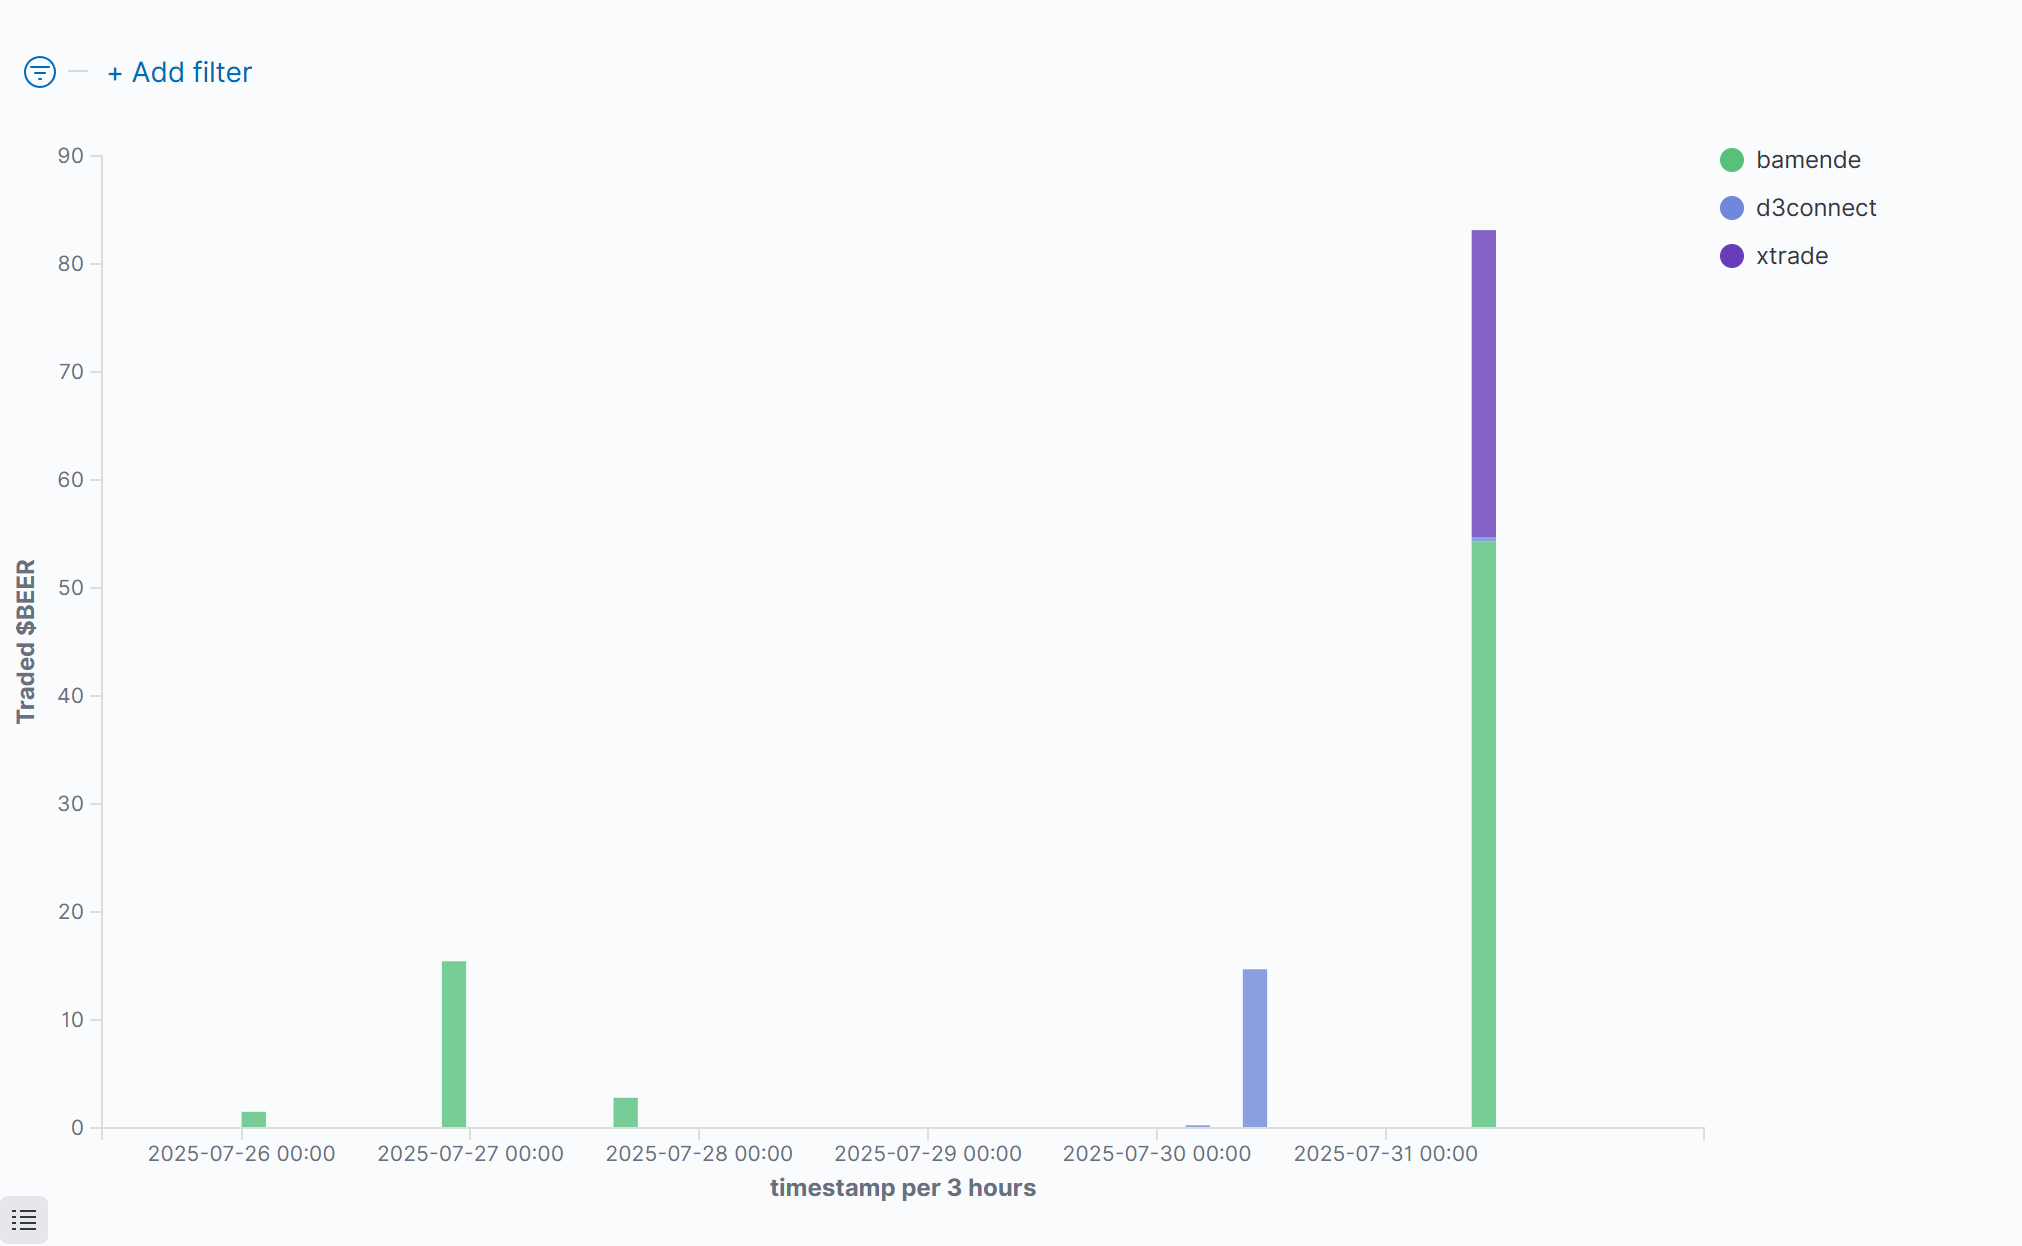
Who has bought how many $BEER at which time:
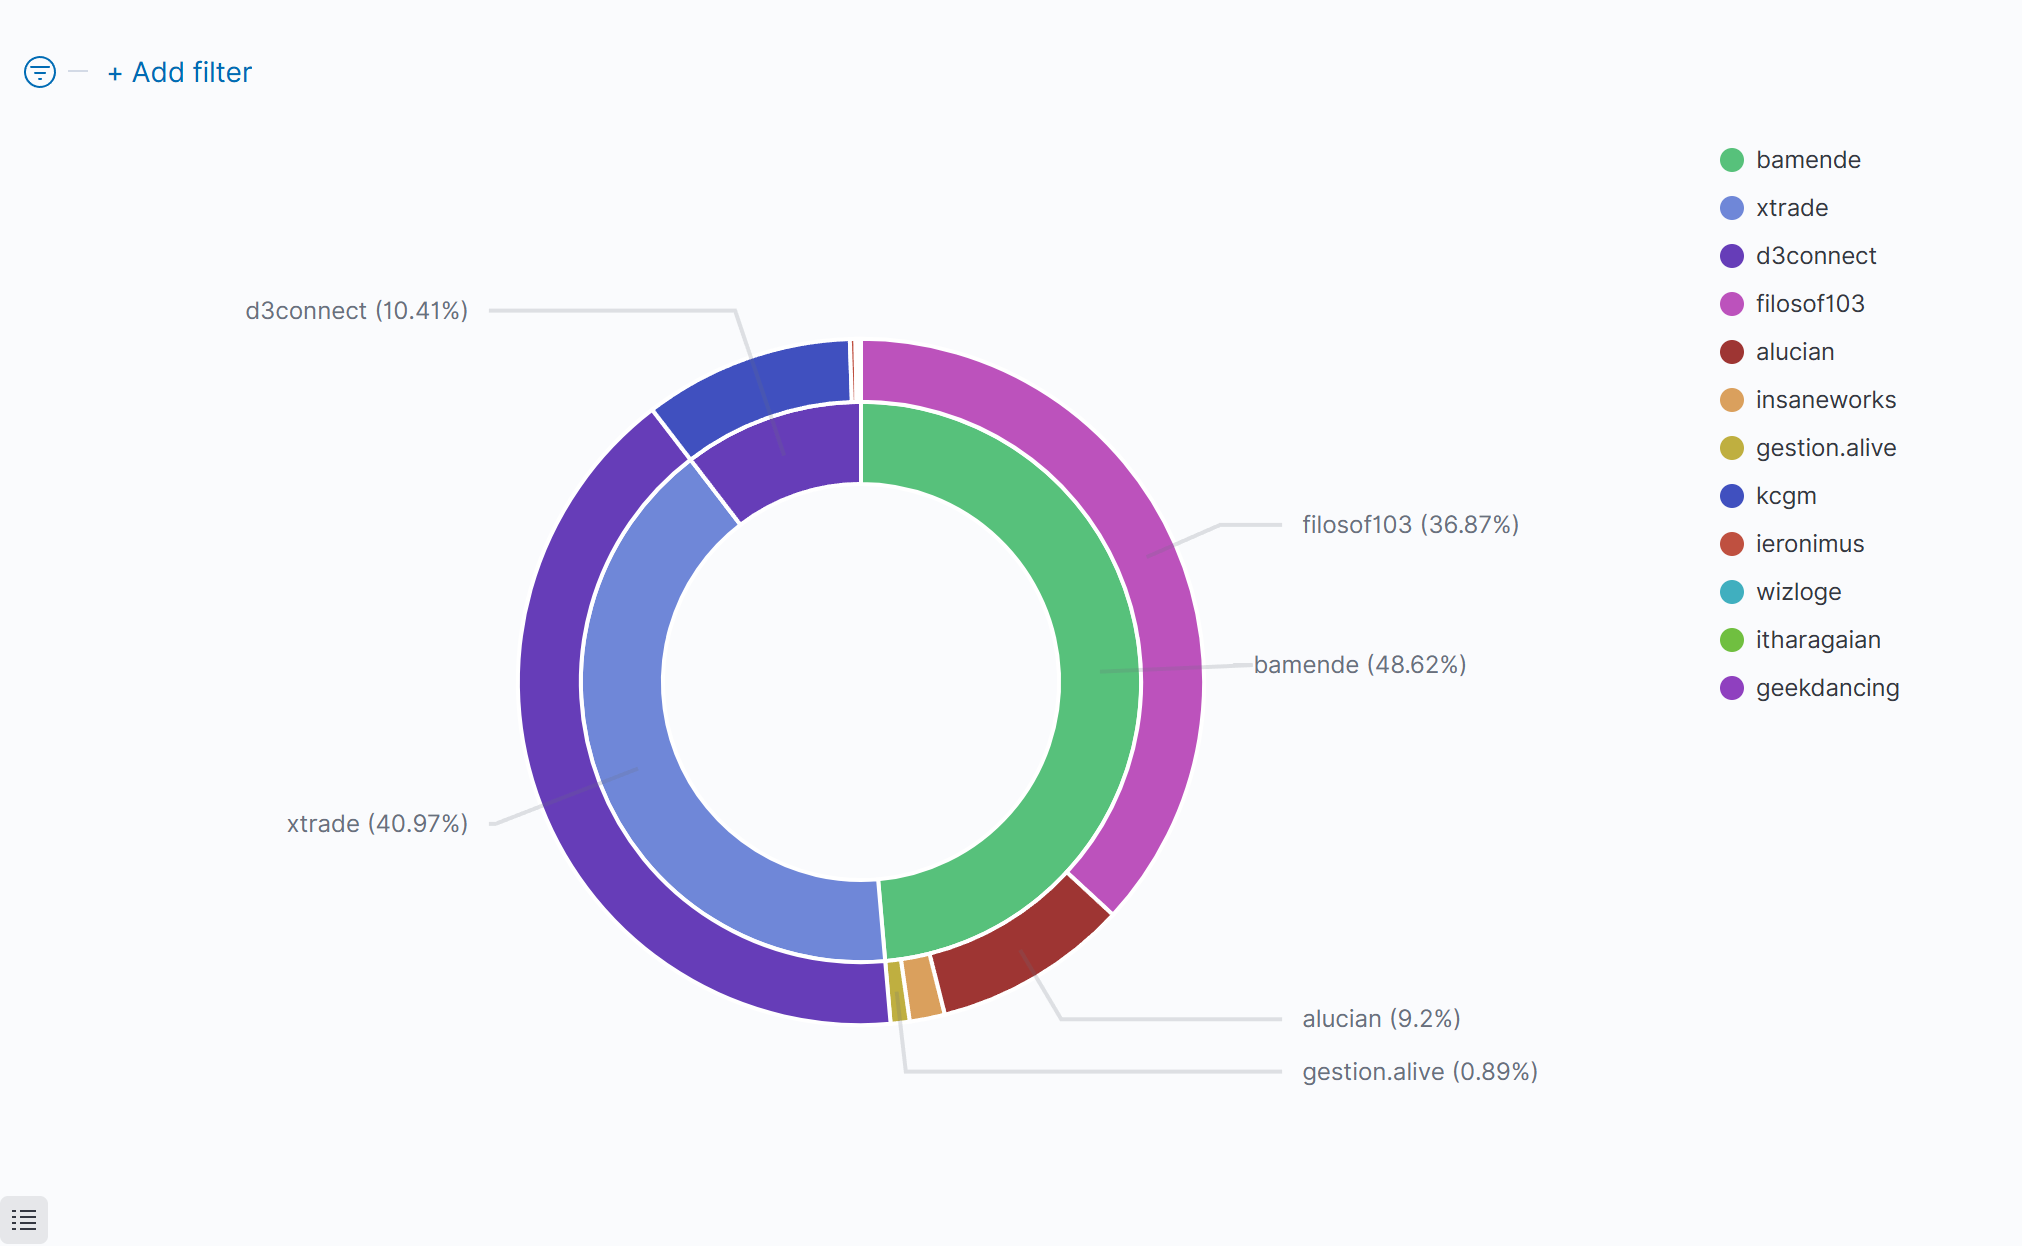
Top $BEER Buyers And $HIVE Sellers
The inside of the circle shows the buyers of $BEER, ordered by $HIVE they have spent. The outside shows the recipients of that $HIVE (sellers of $BEER):
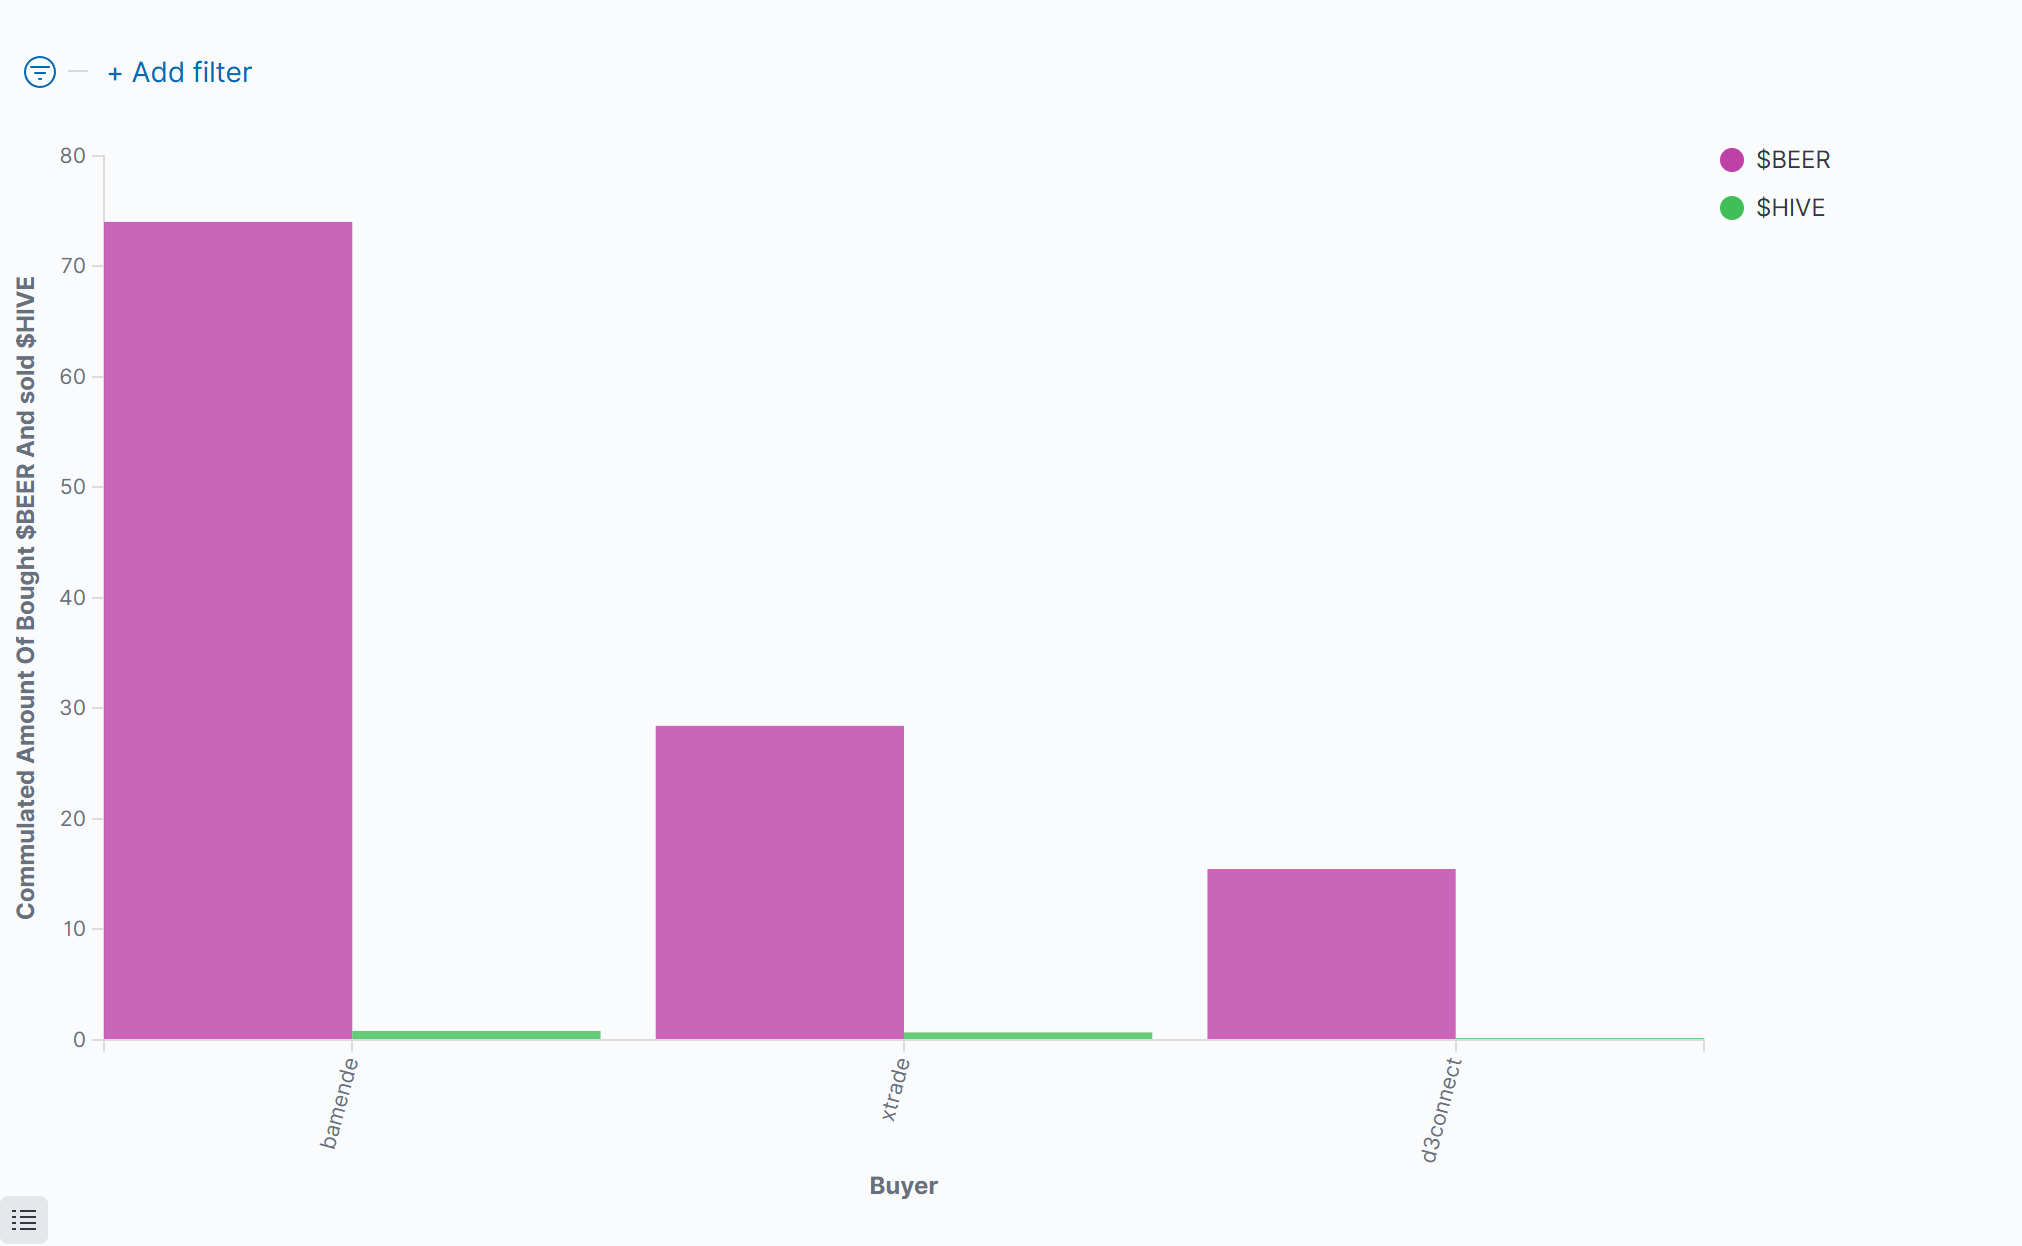
Comulated Amount Of Bought $BEER Per Person
Top 10 $BEER buyers, how much they got and how much $HIVE they spend for this. Sorted by $HIVE, that was spent:
Top 20 $BEER Buyers
Sorted by the $HIVE, they have spent: Buyer(Descending)|Sold $HIVE|% Sold $HIVE|Bought $BEER|Avg. Price|Number of Trades |-|-|-|-|-|-| @bamende| 0.81659|48.62 %|74.03406|0.01036|4 @xtrade| 0.68800|40.97 %|28.42975|0.02420|1 @d3connect| 0.17481|10.41 %|15.47371|0.01095|7 others|0|0.00 %|0|0.00000|0 Sum:|1.67940|100 %|117.93752|0.01517|12
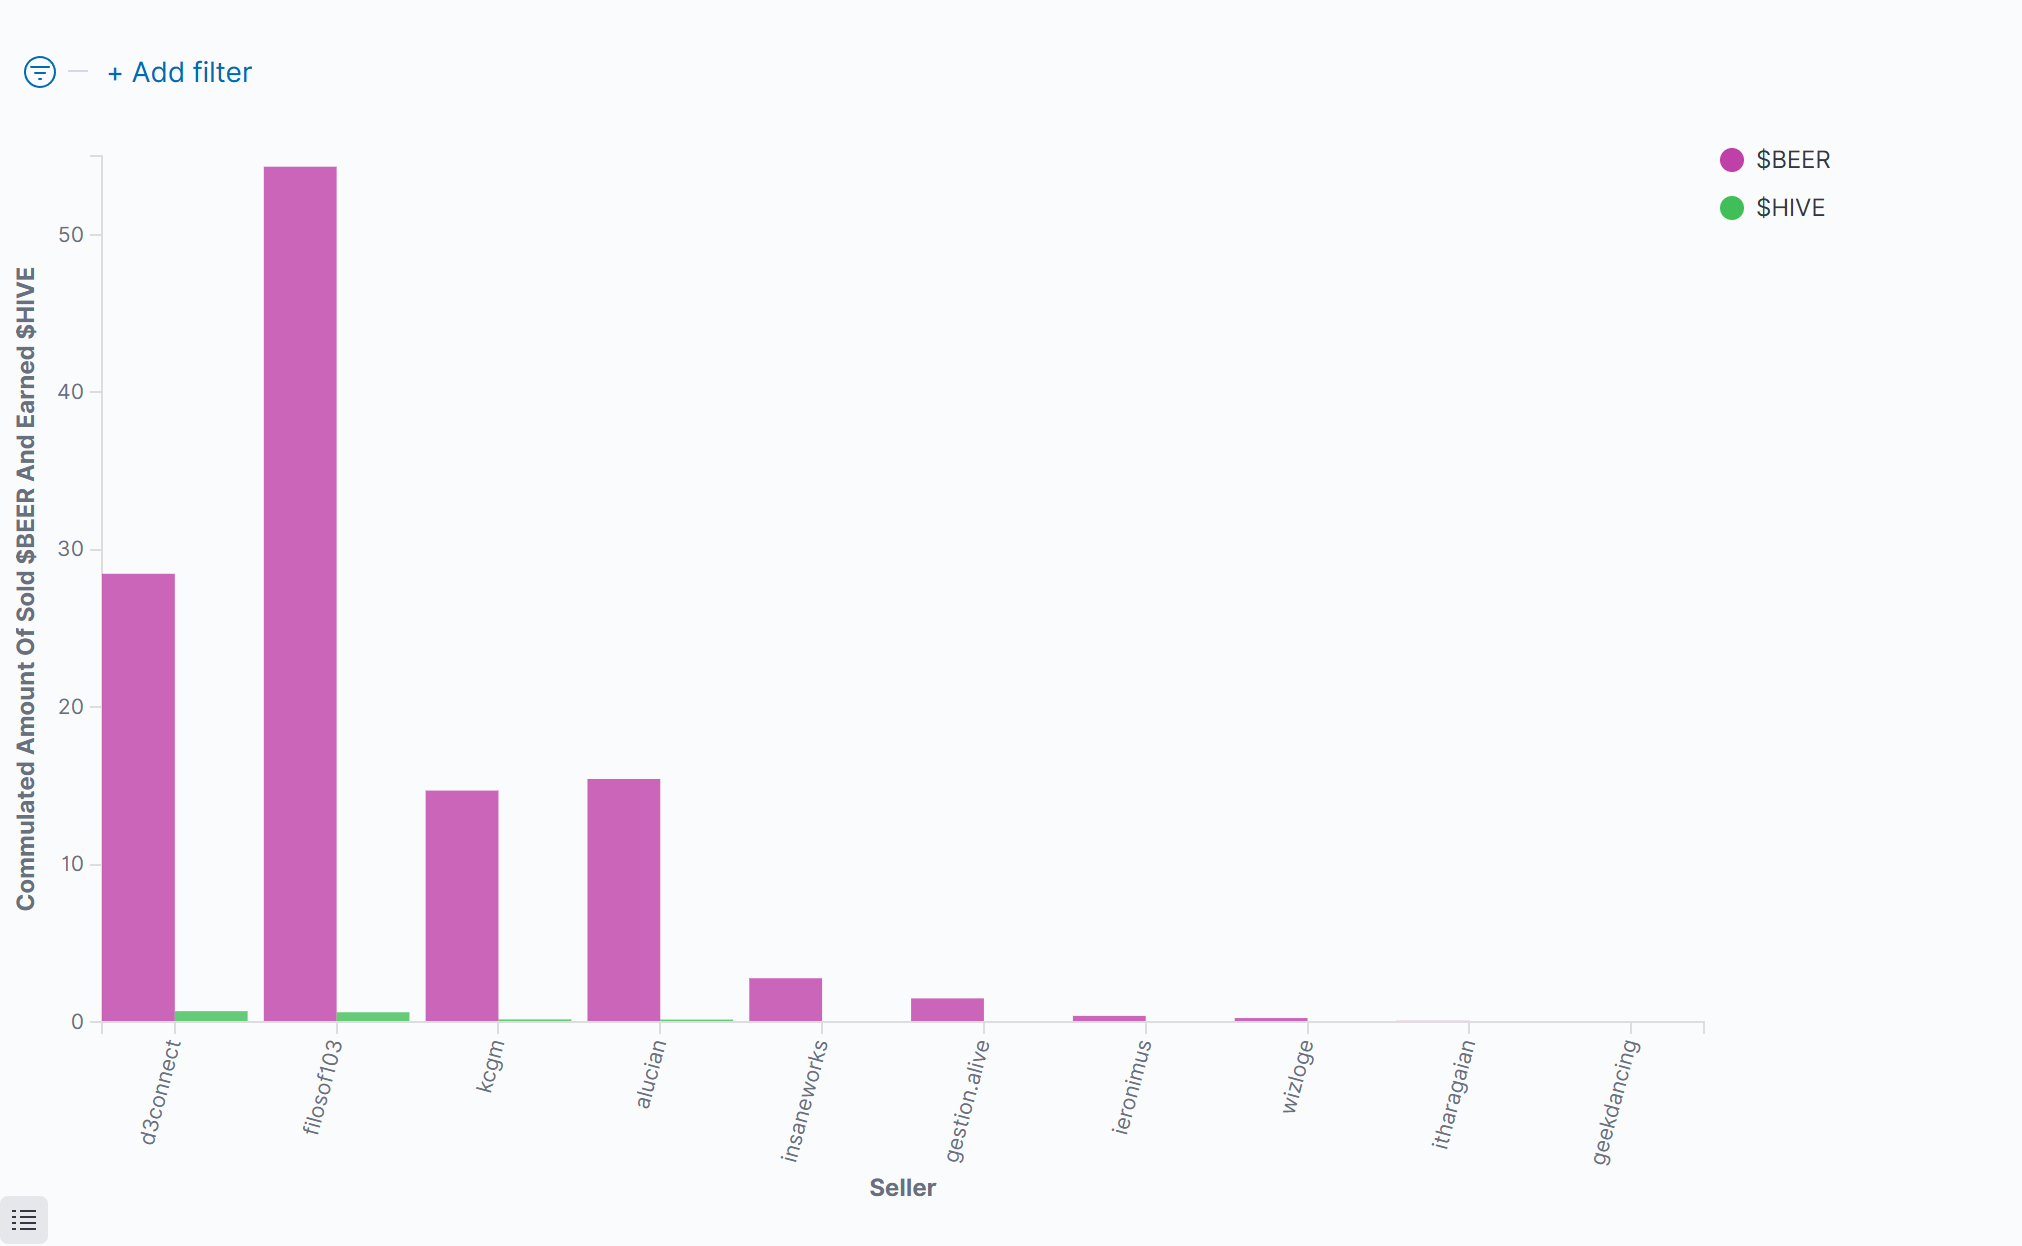
Comulated Amount Of Sold $BEER Per Person
Top 10 $BEER Sellers, how much they sold and how much $HIVE they got for this, sorted by $HIVE:
Top 20 $BEER Sellers
Sorted by the $HIVE, they have got: Seller(Descending)|Earned $HIVE|% Earned $HIVE|Sold $BEER|Avg. Price|Number of Trades |-|-|-|-|-|-| @d3connect| 0.68842|40.99 %|28.46725|0.01775|2 @filosof103| 0.61925|36.87 %|54.32007|0.01140|1 @kcgm| 0.16610|9.89 %|14.69871|0.01130|1 @alucian| 0.15450|9.20 %|15.43446|0.01001|1 @insaneworks| 0.02782|1.66 %|2.77952|0.01001|1 @gestion.alive| 0.01502|0.89 %|1.50000|0.01001|1 @ieronimus| 0.00442|0.26 %|0.38750|0.01140|1 @wizloge| 0.00283|0.17 %|0.25000|0.01130|1 @itharagaian| 0.00080|0.05 %|0.07500|0.01066|2 @geekdancing| 0.00025|0.01 %|0.02500|0.01001|1 others|0|0.00 %|0|0.00000|0 Sum:|1.67941|100 %|117.93751|0.01139|12
Price Of The $BEER
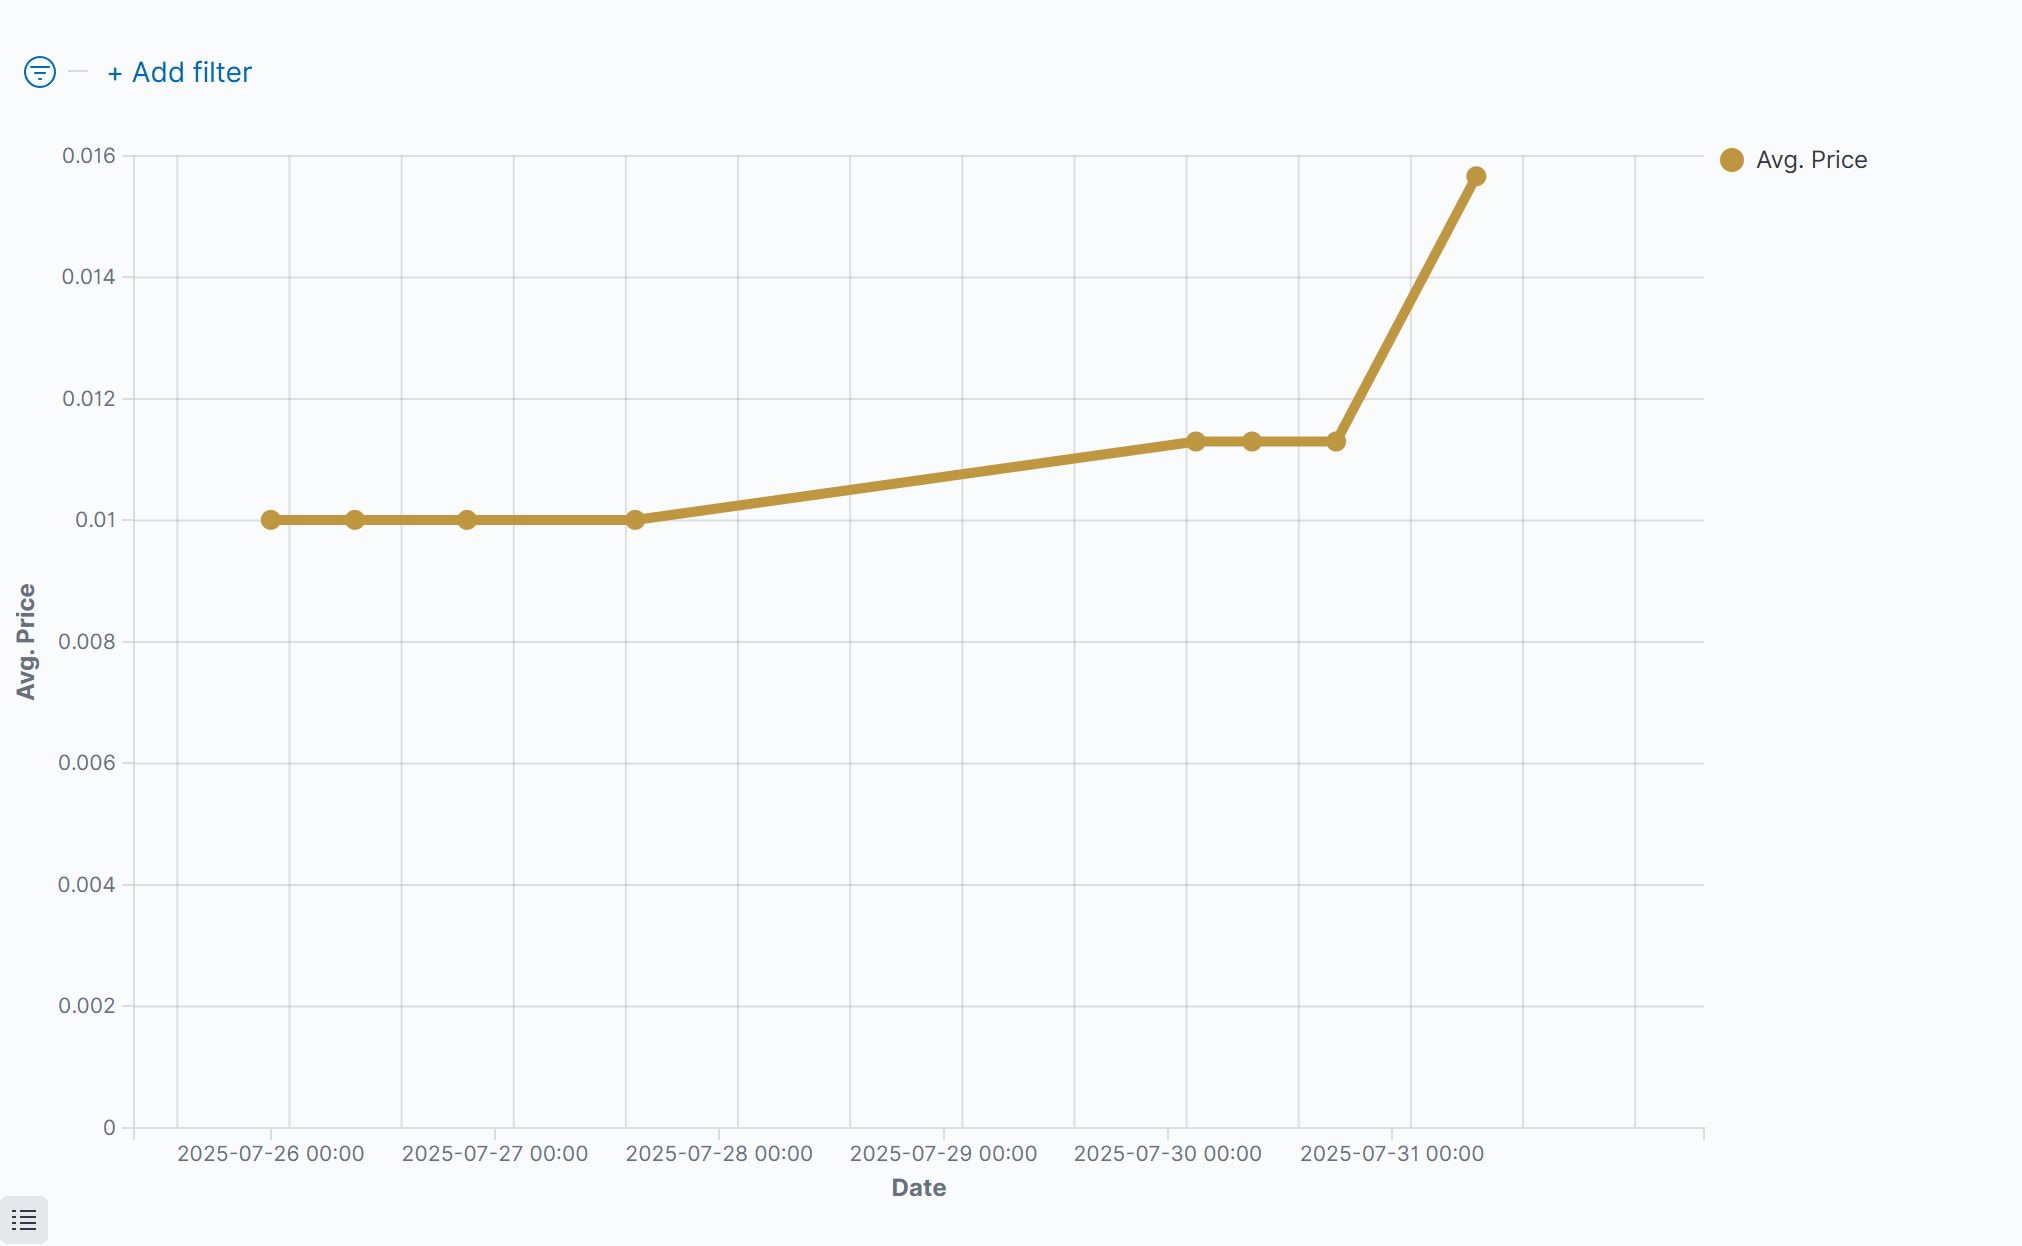
$BEER Summarize Metrics

Request|Received Hive|Received HIVE %|Sold $BEER|Avg. Price |-|-|-|-|-| sell|0.99140|59.03%|89.50776|0.01073 buy|0.68800|40.97%|28.42975|0.02420 |sum: |1.6793999999999998|100%|117.93751|0.01747|
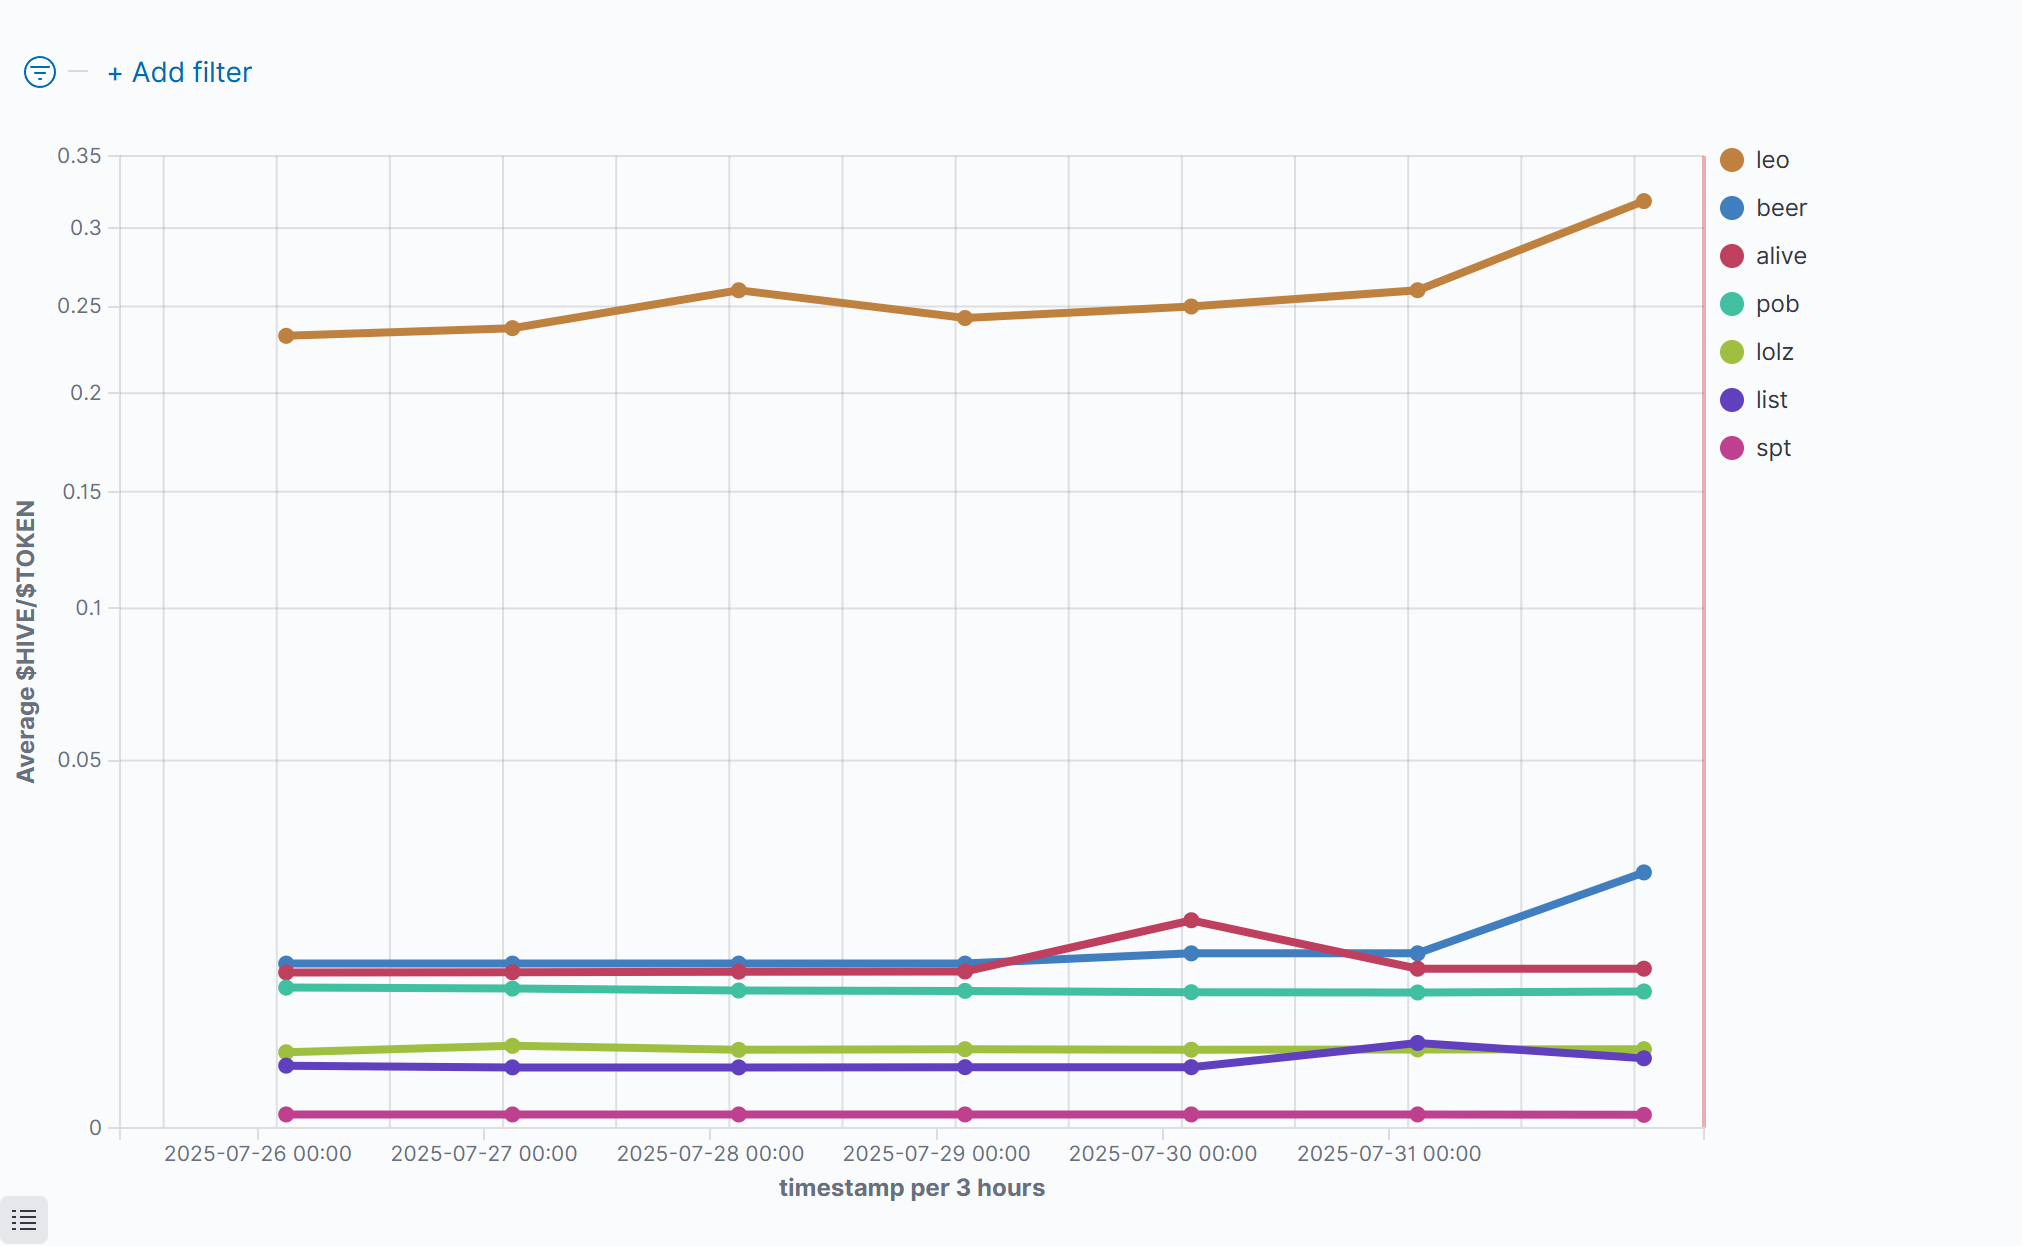
Comparison With Other Tokens
$HIVE/Token
This figure shows the value of $HIVE compared to some tokens. Be aware of the nonlinear (root square) y-axes.
US-Dollar/Token
Value of $USD compared to some token. Be aware of the nonlinear (root square) y-axes.
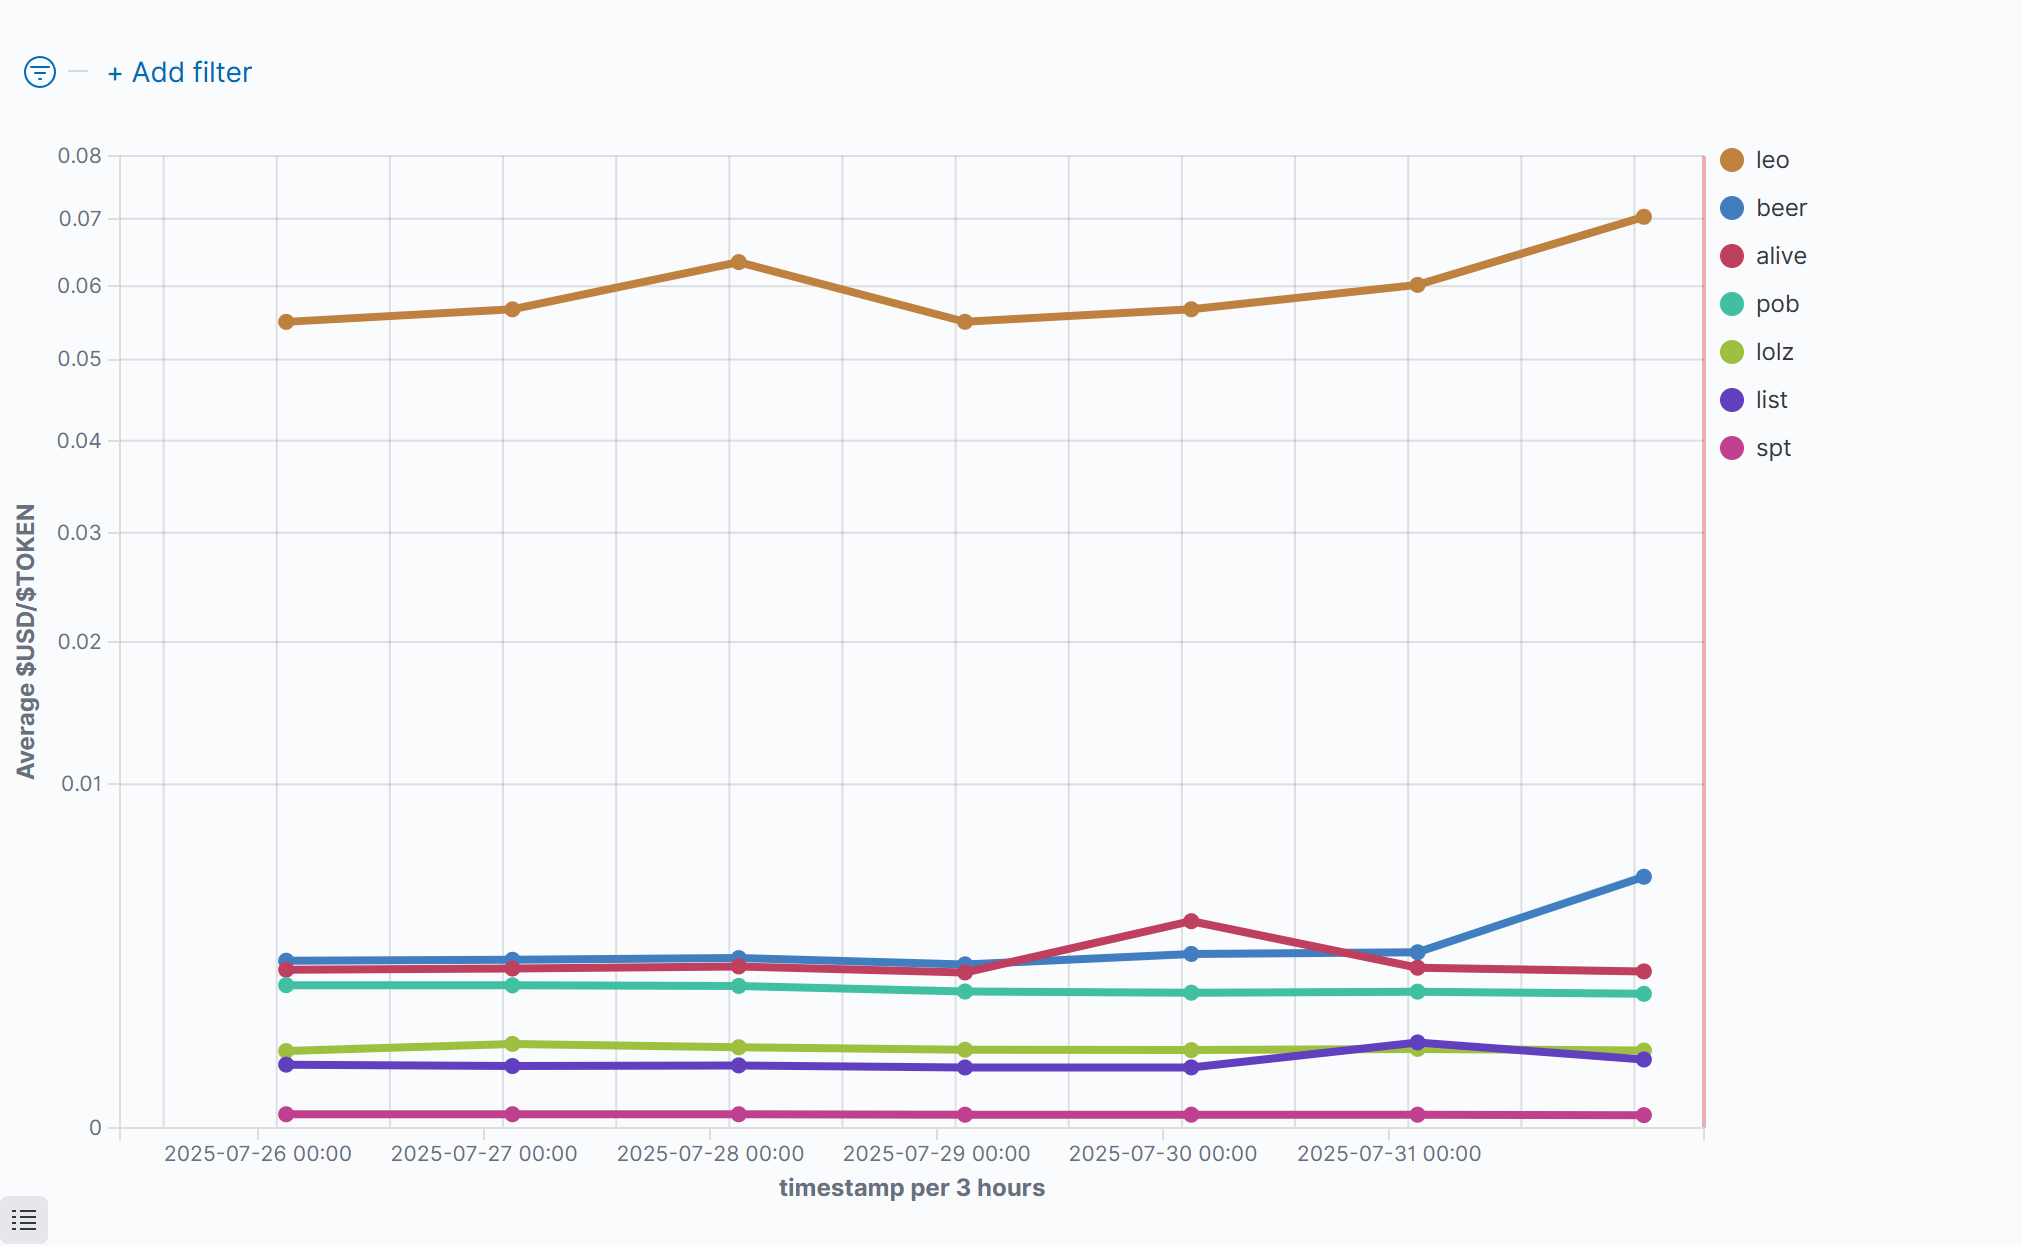
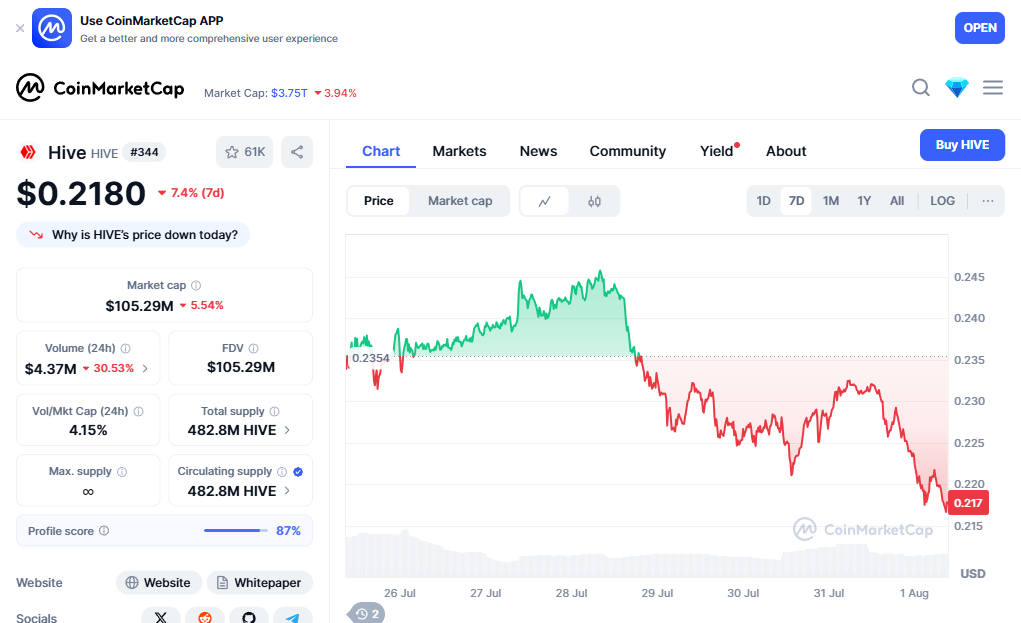
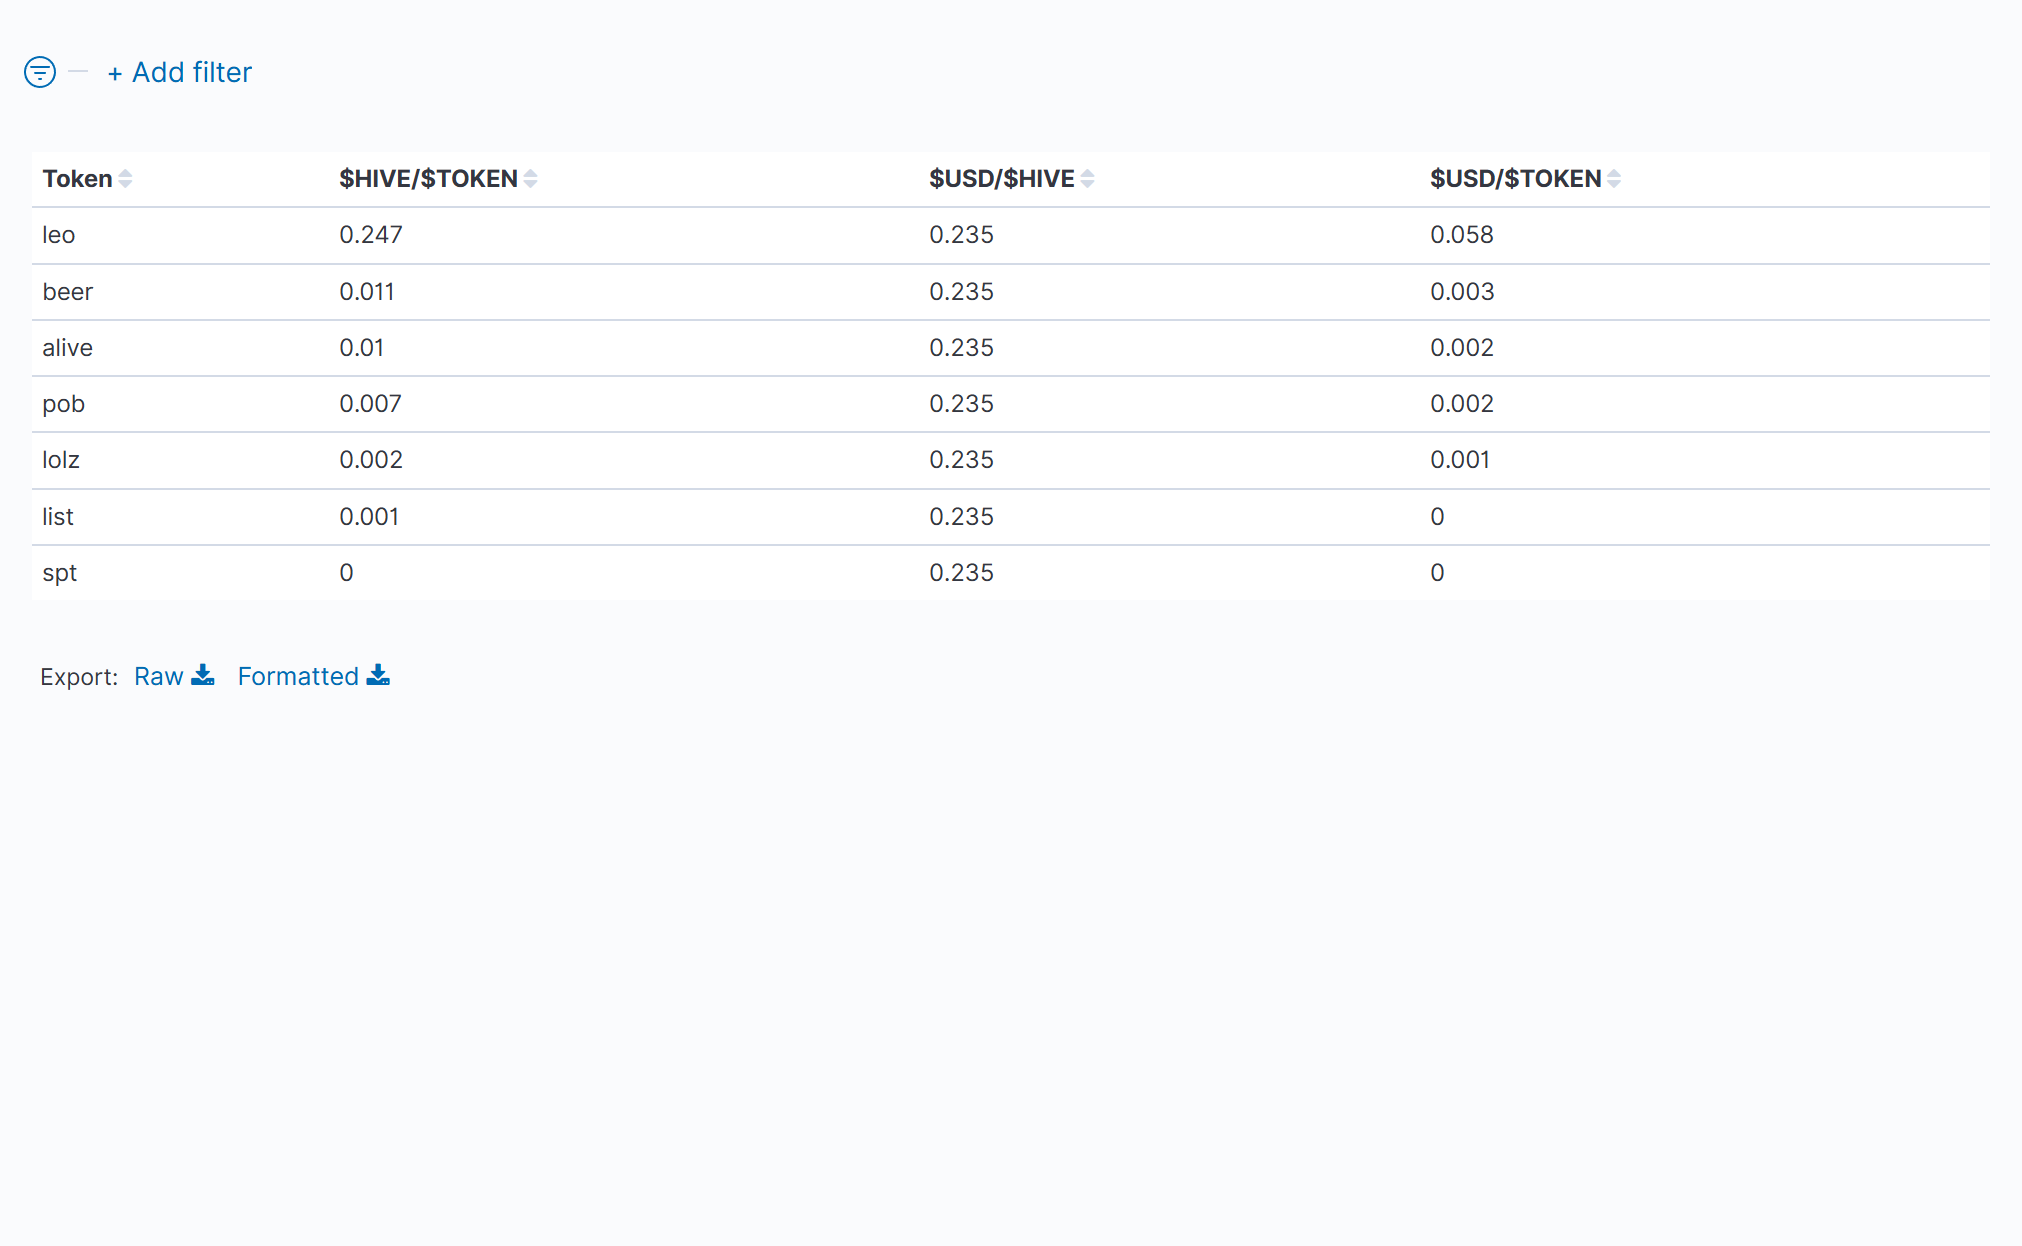
Table Of Token Prices in $HIVE and $USD
Average value of the prices of the token. Hive and US-Dollar compared to the token:

Links:
How I Have Set Up Elasticsearch And Kibana On My Raspberry Pi To Monitor Token Activities and here: Do You Want To See Statistics Of Your Favorite HIVE Token? or on github.
https://peakd.com/@advertisingbot2/posts?filter=stats https://peakd.com/@achimmertens
https://github.com/achimmertens
My last 2 weeks
And again, my schedule is filled to the rim. As I was in Würzburg last weak, for business reasons, I was not able to create the statistics. I am sorry for that.
Two weeks ago I visitied my Father and mother in law in there new house, which they bought recently.
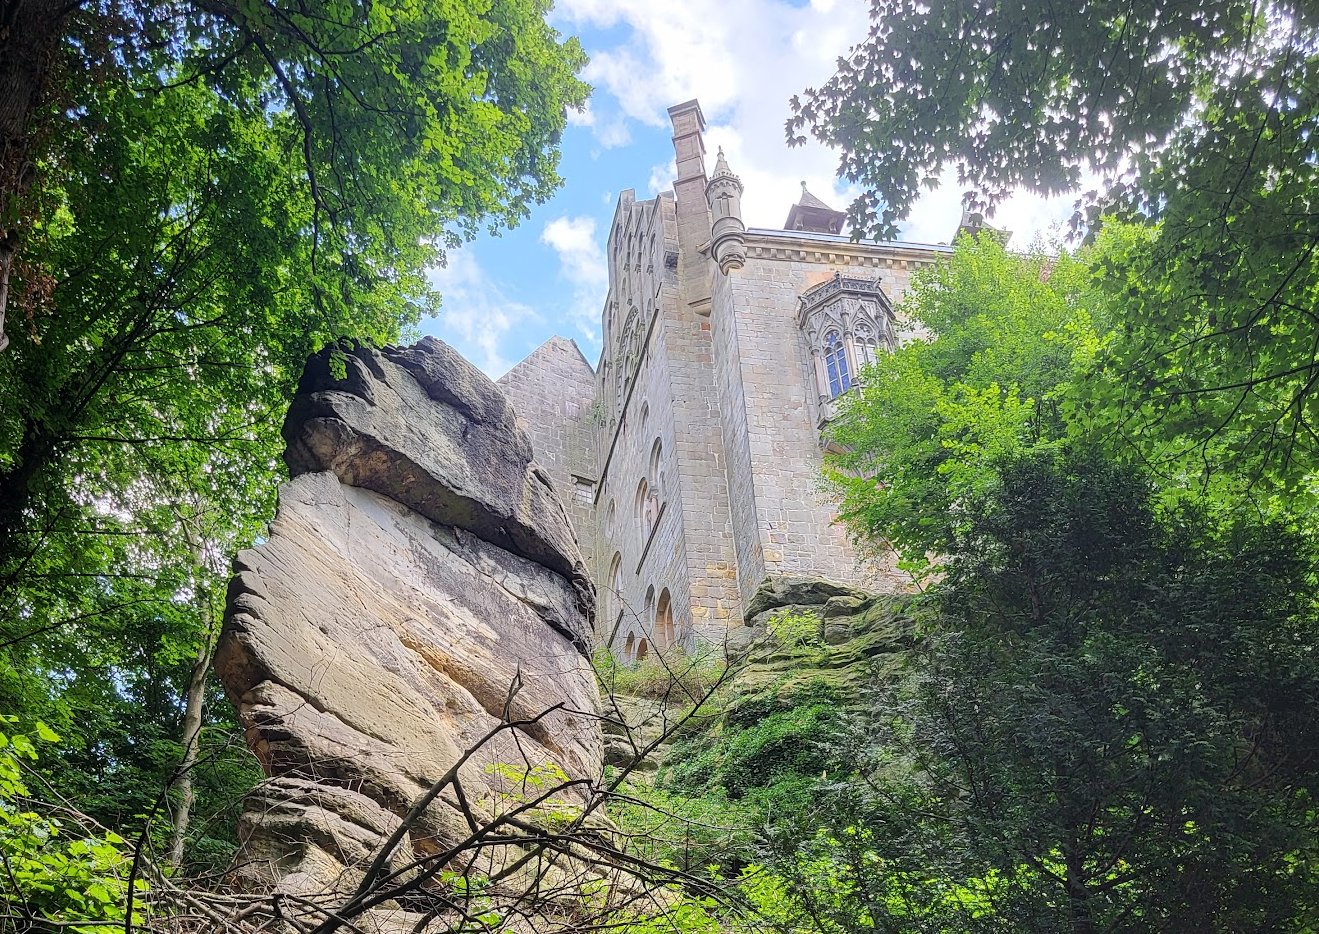 (old Castle in Bad Bentheim - no this is not my parents new hous ;-) )
On Monday, 21.07.2025, I had to travel to Würzburg, were we discussed the new software, which we shall buy.
But it was not only work. I.e. we played minigolf in a 3d darkroom:
 Last weekend my wife, some friends and me visited "Rursee in Flammen", which was a kermis with fireworks and lots of funny boats:

Achim Mertens