 https://github.com/utopian-io/v2.utopian.io
2019-06-07 15:00:00 UTC to 2019-06-14 15:00:00 UTC
This is a weekly, semi-automated post where I will show some statistics and graphs of the development category. It will also serve as a showcase for the staff picks and task requests that were made in the current week. If you have any suggestions or things you'd like to see in this post, then please let me know!
Previous posts
Top contribution(s)
SteemRadar.js - New Features Account Mentions, Account Counter, New Structure Update 0.2.0 by @gigatoride
Category summary
- There were 7 contributions of which 6 have a chance of being rewarded, or already were rewarded.
- The average score was 63.5 with an average reward of 20.7 STU from Utopian.
- The total reward from Utopian for development contributions this week (so far) is 123.9 STU.
- There were a total of 6 unique contributors in the category. Of those 2 were new contributors in the development category (@marcosdk, @robertyan).
Score distribution in the development category
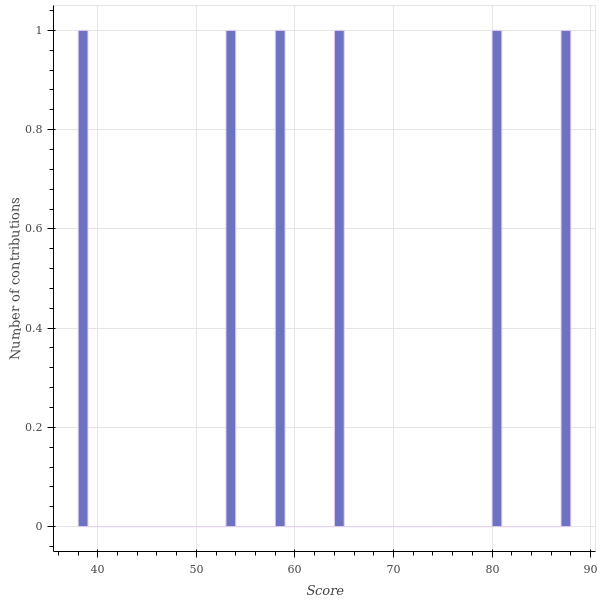
Number of contributions per weekday
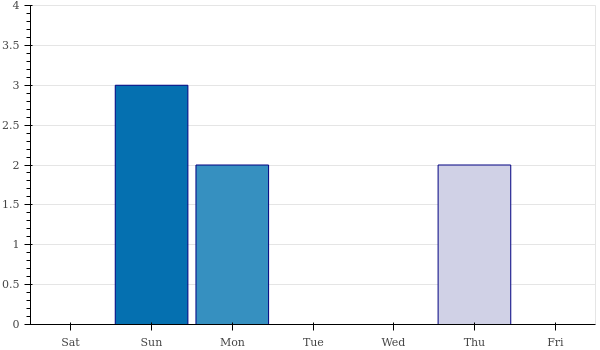
As you can see, Sunday was the day with the most activity in the development category, which is pretty surprising to me! I guess everyone had been working on something and decided to post about it before the next week started?
Average score, reward (STU) and time before review (hours) per week
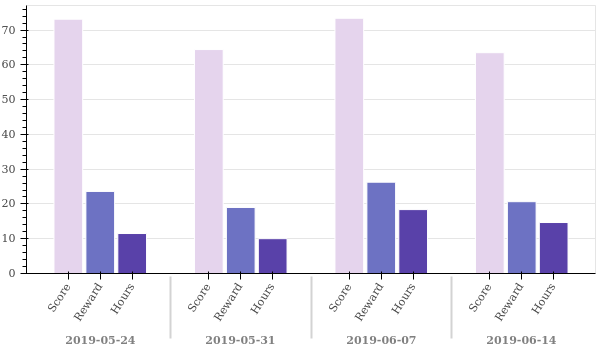
Time before review is the number of hours between the creation of the post and the time it is reviewed by a moderator.
Unfortunately the average score of contributions is down from 73.4 to 63.5 this week. The average reward has also gone down from 26.3 STU to 20.7 STU. Of course with the average score also going down, this was to be expected. Finally, the number of hours it takes for us to get to a contribution and review it (on average) has gone down a lot from 18.4 hours to 15.0 hours.
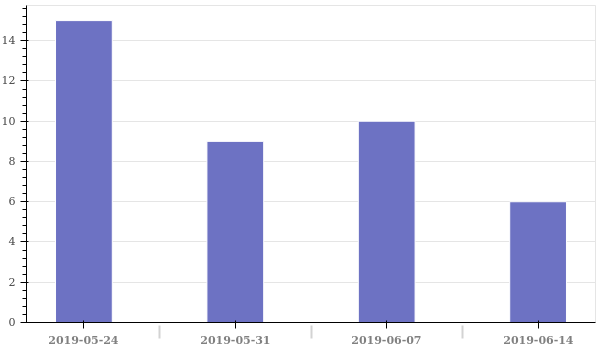
Number of contributions reviewed per week
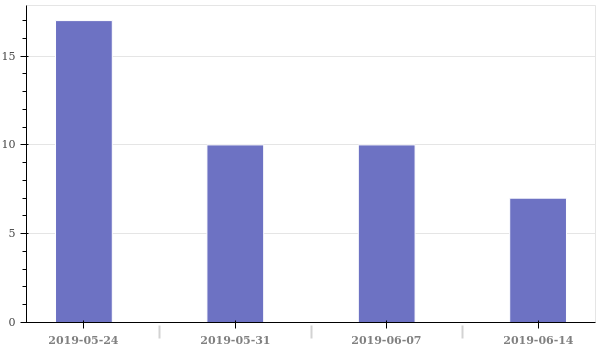
As you can see, the weekly number of reviews is down from 10 to 7. Unfortunately this seems to be following a trend, as the number of contributions over the last two weeks is also down from 27, in the two weeks prior, to 17.
Contributors
Number of unique contributors per week
With the number of reviews going down this week it's unfortunately not that surprising to see the number of unique contributors go down slightly from 10 to 6 either.
Most active contributor(s)
@mkt
One of the OG contributors, @mkt, is back with vengeance! It's great to see him updating some of his old projects, and also fixing some stuff in other people's projects.
Moderators
- @helo reviewed 2 contributions with an average score of 73.0.
- @justyy reviewed 5 contributions with an average score of 47.0.
Amazingly Helo isn't #1 this week. It feels like years since this last happened! lol
Number of reviews per weekday
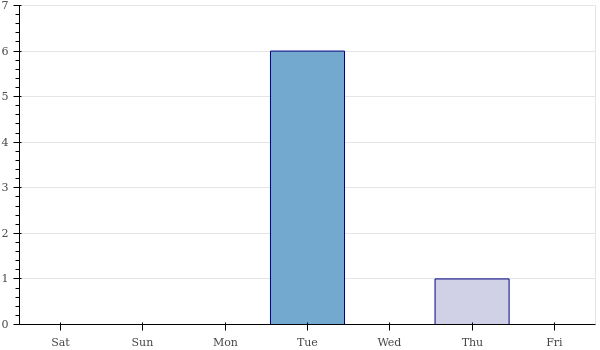
As you can see, Tuesday was the day where we reviewed the majority of the contributions in the development category. Pretty funny to see how basically everything was reviewed in one day. If I recall correctly this happened last week as well.
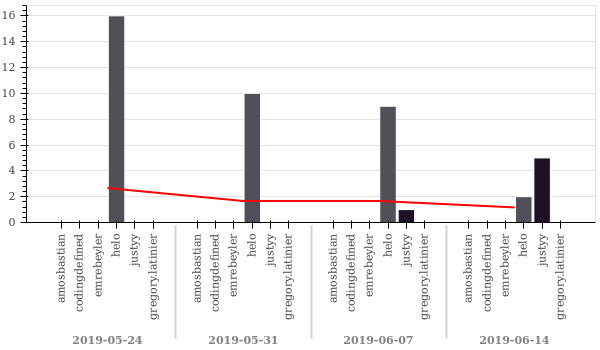
Number of contributions reviewed per moderator
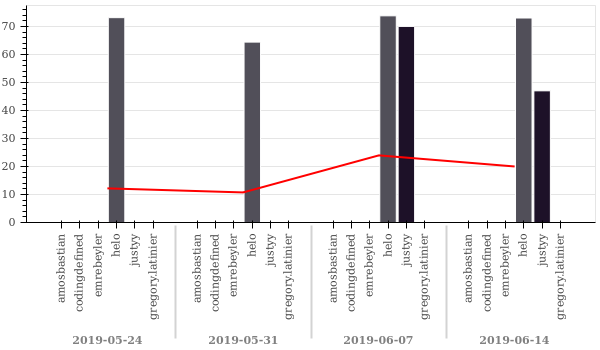
Average score given per moderator
Task request(s)
Also, if you think there is anything that can be worded more clearly, then please let me know!