Grain Factor
As per the land whitepaper: The Secret of Praetoria each land resource has different production difficulty based on the Production Point (PP) of the cards you stake into the plot. Grain is the easiest resource to produce because it has the highest production rate (0.02 units per Production Point per hour). Other resources like Wood, Stone, and Iron have lower production rates, making them harder to farm. Here is the Production Rate and Relative difficulty in tabular form:
| Resource | Production Rate (per PP per hour) | Relative Difficulty |
|---|---|---|
| Grain | 0.02 | Lowest, easiest to produce in volume |
| Wood | 0.005 | 4x harder than Grain |
| Stone | 0.002 | 10x harder than Grain |
| Iron | 0.0005 | 40x harder than Grain |
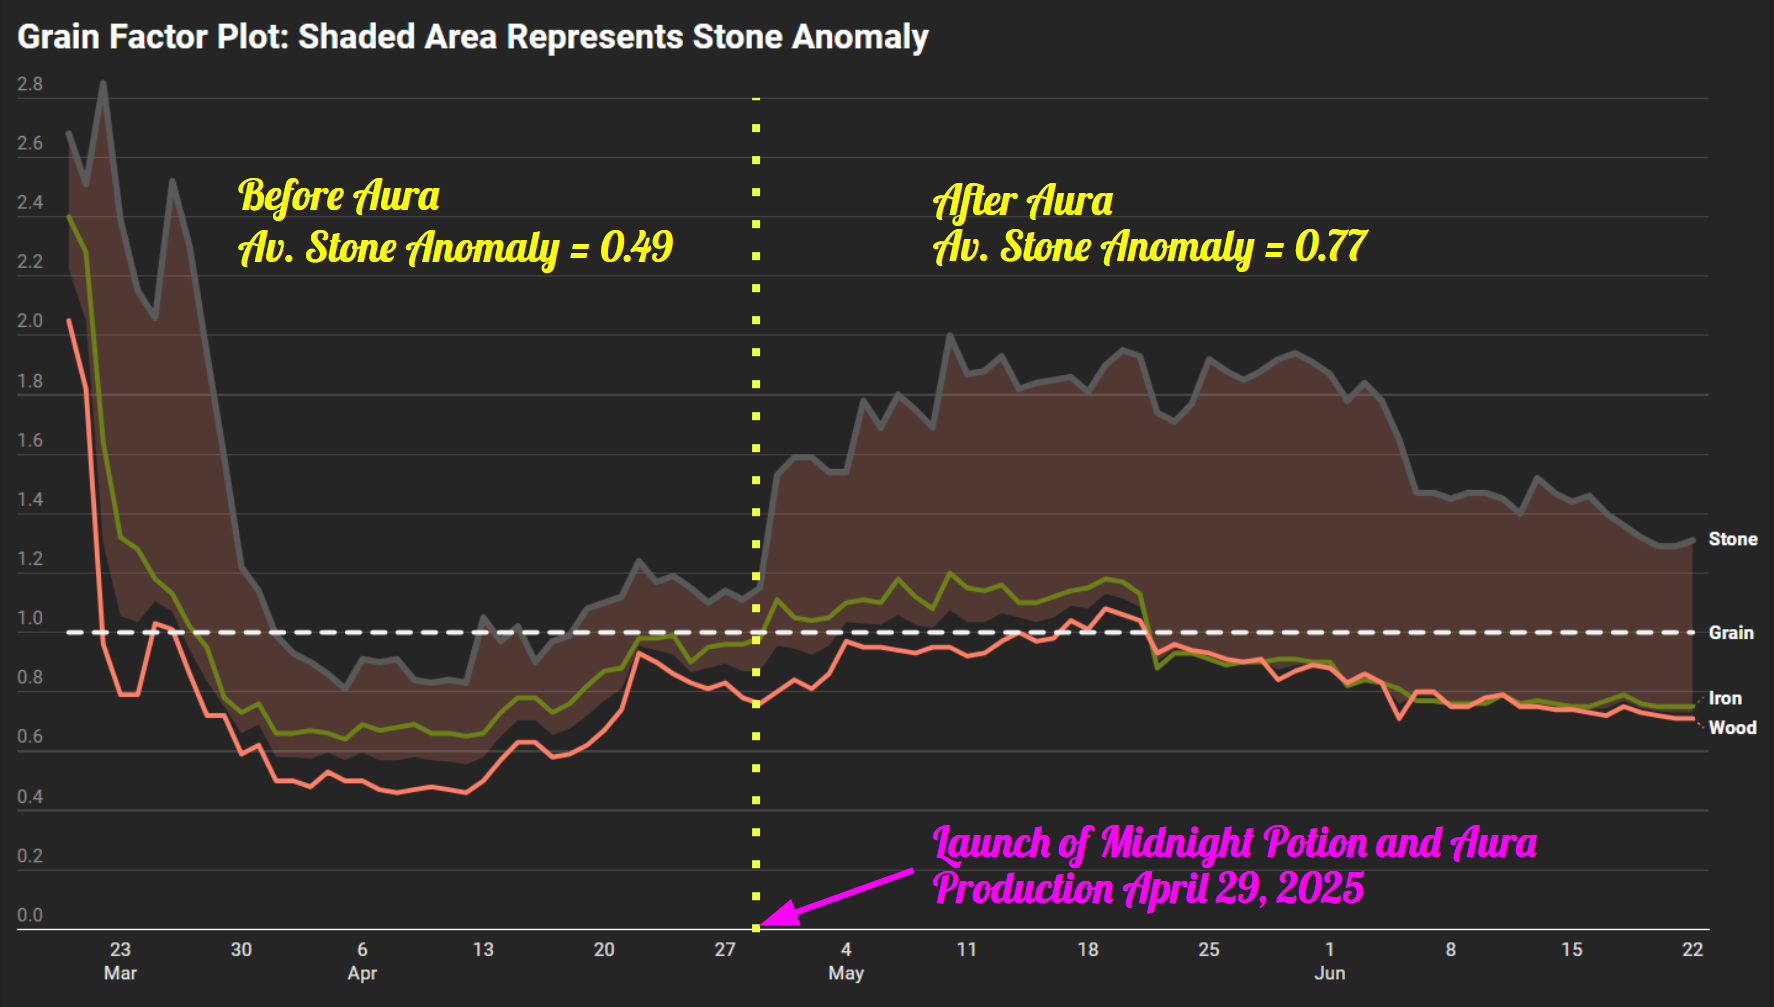
When you go the Land SPL Stats webpage, the first thing you see in the boxes with resource prices, and followed by a plot we call The Grain Factor Plot, looks very similar to the plot above.
The Grain Factor measures how a resource’s (Wood, Stone, or Iron) market price compares to its production difficulty relative to Grain in Splinterlands. It is calculated by converting the resource’s market price into its Grain Equivalent (the number of Grain units it’s worth based on Grain’s current price) and dividing that by the resource’s production difficulty (4x for Wood, 10x for Stone, 40x for Iron). A Grain Factor of 1 means the resource’s price aligns with its production difficulty relative to Grain; higher or lower values indicates the resource is fundamentally overvalued or undervalued.
The fundamental premise of this chart is the understand the price of every natural resources with respect to the price of Grain. That is why Grain price in this chart is horizontal white dashed line (highly distinct and visible) along the X-axis at 1.0. We call this the Grain Baseline. If a resource is trading above the grain baseline it is fundamentally overvalued. If a resource is trading below the grain baseline it is fundamentally undervalued. So currently Iron and Wood are undervalued by about a quarter (25%), while Stone is overvalued by about a third (33%).

Explanation based on Today's market price
I find it is best to understand the concept by calculating something simple. We can look up today's resource prices on the same landing page at Land SPL Stats. We can just put 1000 in each resource boxes, one at a time, and hit enter.
| Resource | Price (DEC per 1000) | Price (DEC per unit) | Grain Equivalent | Production Difficulty | Grain Factor |
|---|---|---|---|---|---|
| Grain | 7.87 | 0.00787 | 1.0000 | 1 | 1.00 |
| Wood | 23.93 | 0.02393 | 3.0399 | 4 | 0.76 |
| Stone | 104.37 | 0.10437 | 13.2592 | 10 | 1.33 |
| Iron | 236.37 | 0.23637 | 30.0356 | 40 | 0.75 |
So, those numbers at the right most column are the Grain Factors for today. @beaker007 started collecting this data from March 20, 2025. We now have more than three month worth of data, which you see on the landing page at Land SPL Stats and that is the same plot (with a twist) on the first image of this post.
Stone Anomaly
I am introducing a new term, as I love to do that! :)
People have been observing this for a while, but no one defined it. Therefore, I see an opportunity to create a new term, a new factor! If you look at the grain factor plot historically, you can easily see that stone remained overvalued by a large amount almost always. If we consider just the production difficulty, Stone is not the most difficult resource to produce, that is Iron. So all else being equal, Iron should be the most expensive resource (and it is if you look at the raw price), but it is not relatively speaking in terms of Grain Factor. Stone Anomaly addresses this problem.
Stone Anomaly is defined as the difference between the price of Stone in Grain Factor, and the average price of Wood and Iron in Grain Factor. In other words, it is the shaded area in the first plot, and the plot below.
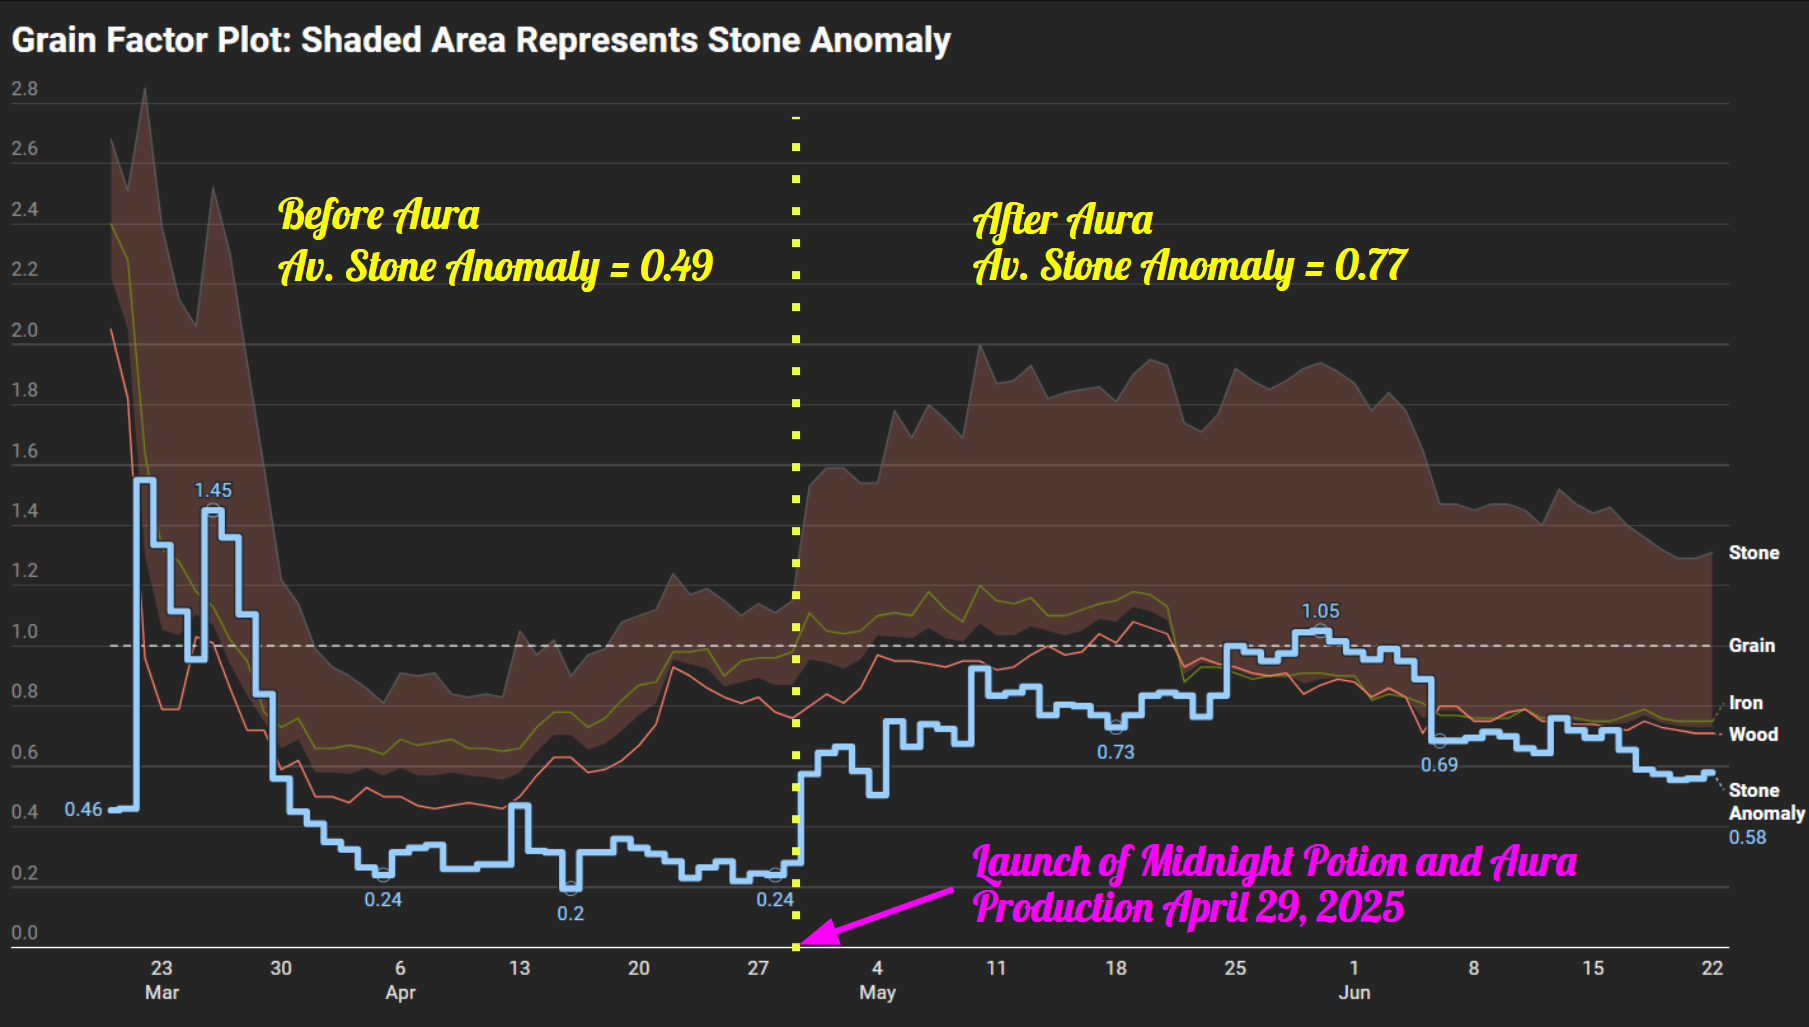
I also plotted the numerical value of Stone Anomaly as a step plot in light blue with labels for better visualization. Notice the Stone Anomaly is much higher after the launch of midnight potion, averaging 0.77. Earlier it was 0.49 on average. In fact if you look carefully at the plot, some of the high number at the beginning of the data collection could be considered edge effect. Majority of the time in April and May, the Stone Anomaly was about 0.3.
Cause of Stone Anomaly
Here I can get into pure speculation, something that I don't like to do often. However, since this is not directly price speculation, I guess it can be okay. I can't find, any stone whale holding stone to artificially inflate the price. So my guess is that the 32% of Praetoria that is currently active, is depleted in Stone, and therefore, the 78% of Praetoria that is currently inactive, is enriched in Stone. Overall, it must even out, because the process of creation of these resources are by random number generators which ensure normal distribution.
Now, I have no idea if this is correct or not, but it is the best educated guess that I can come up with the data I have. It is not possible to know exactly until more of Praetoria is active. Let us get there quickly though!
Grain Factor Table
I modified/rearranged the data, that can be downloaded from the first page of Land SPL Stats, and made a simpler table. I also calculated two additional columns. The Average Wood-Iron column is just an average between the Wood and Iron column, basically represents a mid-point between the two resources. Stone Anomaly, the last column, is the difference between Stone Grain Factor and the Av. Wood-Iron.
| Date | Grain | Wood | Stone | Iron | Av. Wood-Iron | Stone Anomaly |
|---|---|---|---|---|---|---|
| 2025-03-20 | 1 | 2.05 | 2.68 | 2.4 | 2.225 | 0.455 |
| 2025-03-21 | 1 | 1.82 | 2.51 | 2.28 | 2.05 | 0.46 |
| 2025-03-22 | 1 | 0.96 | 2.85 | 1.64 | 1.3 | 1.55 |
| 2025-03-23 | 1 | 0.79 | 2.39 | 1.32 | 1.055 | 1.335 |
| 2025-03-24 | 1 | 0.79 | 2.15 | 1.28 | 1.035 | 1.115 |
| 2025-03-25 | 1 | 1.03 | 2.06 | 1.18 | 1.105 | 0.955 |
| 2025-03-26 | 1 | 1.01 | 2.52 | 1.13 | 1.07 | 1.45 |
| 2025-03-27 | 1 | 0.86 | 2.3 | 1.02 | 0.94 | 1.36 |
| 2025-03-28 | 1 | 0.72 | 1.94 | 0.95 | 0.835 | 1.105 |
| 2025-03-29 | 1 | 0.72 | 1.59 | 0.78 | 0.75 | 0.84 |
| 2025-03-30 | 1 | 0.59 | 1.22 | 0.73 | 0.66 | 0.56 |
| 2025-03-31 | 1 | 0.62 | 1.14 | 0.76 | 0.69 | 0.45 |
| 2025-04-01 | 1 | 0.5 | 0.99 | 0.66 | 0.58 | 0.41 |
| 2025-04-02 | 1 | 0.5 | 0.93 | 0.66 | 0.58 | 0.35 |
| 2025-04-03 | 1 | 0.48 | 0.9 | 0.67 | 0.575 | 0.325 |
| 2025-04-04 | 1 | 0.53 | 0.86 | 0.66 | 0.595 | 0.265 |
| 2025-04-05 | 1 | 0.5 | 0.81 | 0.64 | 0.57 | 0.24 |
| 2025-04-06 | 1 | 0.5 | 0.91 | 0.69 | 0.595 | 0.315 |
| 2025-04-07 | 1 | 0.47 | 0.9 | 0.67 | 0.57 | 0.33 |
| 2025-04-08 | 1 | 0.46 | 0.91 | 0.68 | 0.57 | 0.34 |
| 2025-04-09 | 1 | 0.47 | 0.84 | 0.69 | 0.58 | 0.26 |
| 2025-04-10 | 1 | 0.48 | 0.83 | 0.66 | 0.57 | 0.26 |
| 2025-04-11 | 1 | 0.47 | 0.84 | 0.66 | 0.565 | 0.275 |
| 2025-04-12 | 1 | 0.46 | 0.83 | 0.65 | 0.555 | 0.275 |
| 2025-04-13 | 1 | 0.5 | 1.05 | 0.66 | 0.58 | 0.47 |
| 2025-04-14 | 1 | 0.57 | 0.97 | 0.73 | 0.65 | 0.32 |
| 2025-04-15 | 1 | 0.63 | 1.02 | 0.78 | 0.705 | 0.315 |
| 2025-04-16 | 1 | 0.63 | 0.9 | 0.78 | 0.705 | 0.195 |
| 2025-04-17 | 1 | 0.58 | 0.97 | 0.73 | 0.655 | 0.315 |
| 2025-04-18 | 1 | 0.59 | 0.99 | 0.76 | 0.675 | 0.315 |
| 2025-04-19 | 1 | 0.62 | 1.08 | 0.82 | 0.72 | 0.36 |
| 2025-04-20 | 1 | 0.67 | 1.1 | 0.87 | 0.77 | 0.33 |
| 2025-04-21 | 1 | 0.74 | 1.12 | 0.88 | 0.81 | 0.31 |
| 2025-04-22 | 1 | 0.93 | 1.24 | 0.98 | 0.955 | 0.285 |
| 2025-04-23 | 1 | 0.9 | 1.17 | 0.98 | 0.94 | 0.23 |
| 2025-04-24 | 1 | 0.86 | 1.19 | 0.99 | 0.925 | 0.265 |
| 2025-04-25 | 1 | 0.83 | 1.15 | 0.9 | 0.865 | 0.285 |
| 2025-04-26 | 1 | 0.81 | 1.1 | 0.95 | 0.88 | 0.22 |
| 2025-04-27 | 1 | 0.83 | 1.14 | 0.96 | 0.895 | 0.245 |
| 2025-04-28 | 1 | 0.78 | 1.11 | 0.96 | 0.87 | 0.24 |
| 2025-04-29 | 1 | 0.76 | 1.15 | 0.98 | 0.87 | 0.28 |
| 2025-04-30 | 1 | 0.8 | 1.53 | 1.11 | 0.955 | 0.575 |
| 2025-05-01 | 1 | 0.84 | 1.59 | 1.05 | 0.945 | 0.645 |
| 2025-05-02 | 1 | 0.81 | 1.59 | 1.04 | 0.925 | 0.665 |
| 2025-05-03 | 1 | 0.86 | 1.54 | 1.05 | 0.955 | 0.585 |
| 2025-05-04 | 1 | 0.97 | 1.54 | 1.1 | 1.035 | 0.505 |
| 2025-05-05 | 1 | 0.95 | 1.78 | 1.11 | 1.03 | 0.75 |
| 2025-05-06 | 1 | 0.95 | 1.69 | 1.1 | 1.025 | 0.665 |
| 2025-05-07 | 1 | 0.94 | 1.8 | 1.18 | 1.06 | 0.74 |
| 2025-05-08 | 1 | 0.93 | 1.75 | 1.12 | 1.025 | 0.725 |
| 2025-05-09 | 1 | 0.95 | 1.69 | 1.08 | 1.015 | 0.675 |
| 2025-05-10 | 1 | 0.95 | 2 | 1.2 | 1.075 | 0.925 |
| 2025-05-11 | 1 | 0.92 | 1.87 | 1.15 | 1.035 | 0.835 |
| 2025-05-12 | 1 | 0.93 | 1.88 | 1.14 | 1.035 | 0.845 |
| 2025-05-13 | 1 | 0.97 | 1.93 | 1.16 | 1.065 | 0.865 |
| 2025-05-14 | 1 | 1 | 1.82 | 1.1 | 1.05 | 0.77 |
| 2025-05-15 | 1 | 0.97 | 1.84 | 1.1 | 1.035 | 0.805 |
| 2025-05-16 | 1 | 0.98 | 1.85 | 1.12 | 1.05 | 0.8 |
| 2025-05-17 | 1 | 1.04 | 1.86 | 1.14 | 1.09 | 0.77 |
| 2025-05-18 | 1 | 1.01 | 1.81 | 1.15 | 1.08 | 0.73 |
| 2025-05-19 | 1 | 1.08 | 1.9 | 1.18 | 1.13 | 0.77 |
| 2025-05-20 | 1 | 1.06 | 1.95 | 1.17 | 1.115 | 0.835 |
| 2025-05-21 | 1 | 1.04 | 1.93 | 1.13 | 1.085 | 0.845 |
| 2025-05-22 | 1 | 0.93 | 1.74 | 0.88 | 0.905 | 0.835 |
| 2025-05-23 | 1 | 0.96 | 1.71 | 0.93 | 0.945 | 0.765 |
| 2025-05-24 | 1 | 0.94 | 1.77 | 0.93 | 0.935 | 0.835 |
| 2025-05-25 | 1 | 0.93 | 1.92 | 0.91 | 0.92 | 1 |
| 2025-05-26 | 1 | 0.91 | 1.88 | 0.89 | 0.9 | 0.98 |
| 2025-05-27 | 1 | 0.9 | 1.85 | 0.9 | 0.9 | 0.95 |
| 2025-05-28 | 1 | 0.91 | 1.88 | 0.9 | 0.905 | 0.975 |
| 2025-05-29 | 1 | 0.84 | 1.92 | 0.91 | 0.875 | 1.045 |
| 2025-05-30 | 1 | 0.87 | 1.94 | 0.91 | 0.89 | 1.05 |
| 2025-05-31 | 1 | 0.89 | 1.91 | 0.9 | 0.895 | 1.015 |
| 2025-06-01 | 1 | 0.88 | 1.87 | 0.9 | 0.89 | 0.98 |
| 2025-06-02 | 1 | 0.83 | 1.78 | 0.82 | 0.825 | 0.955 |
| 2025-06-03 | 1 | 0.86 | 1.84 | 0.84 | 0.85 | 0.99 |
| 2025-06-04 | 1 | 0.83 | 1.78 | 0.83 | 0.83 | 0.95 |
| 2025-06-05 | 1 | 0.71 | 1.65 | 0.81 | 0.76 | 0.89 |
| 2025-06-06 | 1 | 0.8 | 1.47 | 0.77 | 0.785 | 0.685 |
| 2025-06-07 | 1 | 0.8 | 1.47 | 0.77 | 0.785 | 0.685 |
| 2025-06-08 | 1 | 0.75 | 1.45 | 0.76 | 0.755 | 0.695 |
| 2025-06-09 | 1 | 0.75 | 1.47 | 0.76 | 0.755 | 0.715 |
| 2025-06-10 | 1 | 0.78 | 1.47 | 0.76 | 0.77 | 0.7 |
| 2025-06-11 | 1 | 0.79 | 1.45 | 0.79 | 0.79 | 0.66 |
| 2025-06-12 | 1 | 0.75 | 1.4 | 0.76 | 0.755 | 0.645 |
| 2025-06-13 | 1 | 0.75 | 1.52 | 0.77 | 0.76 | 0.76 |
| 2025-06-14 | 1 | 0.74 | 1.47 | 0.76 | 0.75 | 0.72 |
| 2025-06-15 | 1 | 0.74 | 1.44 | 0.75 | 0.745 | 0.695 |
| 2025-06-16 | 1 | 0.73 | 1.46 | 0.75 | 0.74 | 0.72 |
| 2025-06-17 | 1 | 0.72 | 1.4 | 0.77 | 0.745 | 0.655 |
| 2025-06-18 | 1 | 0.75 | 1.36 | 0.79 | 0.77 | 0.59 |
| 2025-06-19 | 1 | 0.73 | 1.32 | 0.76 | 0.745 | 0.575 |
| 2025-06-20 | 1 | 0.72 | 1.29 | 0.75 | 0.735 | 0.555 |
| 2025-06-21 | 1 | 0.71 | 1.29 | 0.75 | 0.73 | 0.56 |
| 2025-06-22 | 1 | 0.71 | 1.31 | 0.75 | 0.73 | 0.58 |
Anyone can download this table and data and make their own analysis. Hope this helps!
Finally three definitions:
Production Difficulty measures how much harder it is to produce a resource (Wood, Stone, Iron) compared to Grain in Splinterlands, based on the ratio of their production rates per Production Point per hour (Grain: 0.02, Wood: 0.005, Stone: 0.002, Iron: 0.0005).
The Grain Factor shows how a resource’s (Wood, Stone, Iron) market price compares to its production difficulty relative to Grain in Splinterlands. It’s calculated by dividing the resource’s Grain Equivalent (its price in Grain units) by its production difficulty (4x for Wood, 10x for Stone, 40x for Iron), with a value of 1 meaning the price matches the difficulty.
The Stone Anomaly refers to Stone’s overvalued market price on the basis of Grain Factor, it is measured as the difference between Stone Price in Grain Factor and the mid-point or average Wood-Iron price in Grain Factor.