Selling a Straddle
Recently I was talking to @beaker007 about Liquidity Pool Profit-Loss Chart for theoretical price changes, and I made a comment that it is similar to selling a option straddle. Many people are not familiar with what that is, so I thought it could be a good idea to discuss it. First of all, we are talking about stock options.
Stock options are financial contracts that give the buyer the right, but not the obligation, to buy or sell an underlying asset (most commonly shares of a company's stock) at a predetermined price (called the strike price or exercise price) on or before a specific date (the expiration date). Standardized options contracts typically represent 100 shares of the underlying stock. So, if an option is quoted at $2.00, it actually costs $200 (2.00 x 100 shares).
That is about it. There are two kinds of options. Call and Put. Call Options give the holder the right to buy the underlying stock at the strike price. Put Options give the holder the right to sell the underlying stock at the strike price. Simply speaking, if you expect a stock price to go up, you buy calls, and if you expect a stock price to go down, you buy a put.
The difference between a stock and its option are the following:
- Leverage. That 100 multiplier.
- Ease. It is not easy to short-sell a stock, but it is as simple to buy a put, just as a call
Also just like it is easy to buy a call or put options, it is equally easy to sell a call or put option. So right from the get go, options have many options. You can:
- Buy a call (long position, you think underlying stock will go up)
- Sell a call (short position, you think underlying stock will go down)
- Buy a put (short position, you think underlying stock will go down)
- Sell a put (long position, you think underlying stock will go up)
That is already four different choices. Now you can combine them in variety of different way into different position, and therefore you can have a lot of combinations. Each has a name. Today we will discuss one such strategy, called a short straddle, or selling of a straddle. FYI, to execute this strategy in conventional brokerage account (I use Charles Schwab), you must have margin trading privileges and a fairly 'large' account. Damn, that is a lot of writing before I even get to the strategy!
An option straddle is a neutral options strategy that involves simultaneously buying or selling both a call and a put option with the same strike price and the same expiration date. For a short straddle an investor sells both a call and a put. The position is profitable when the underlying asset's price remains relatively stable and close to the strike price at expiration.
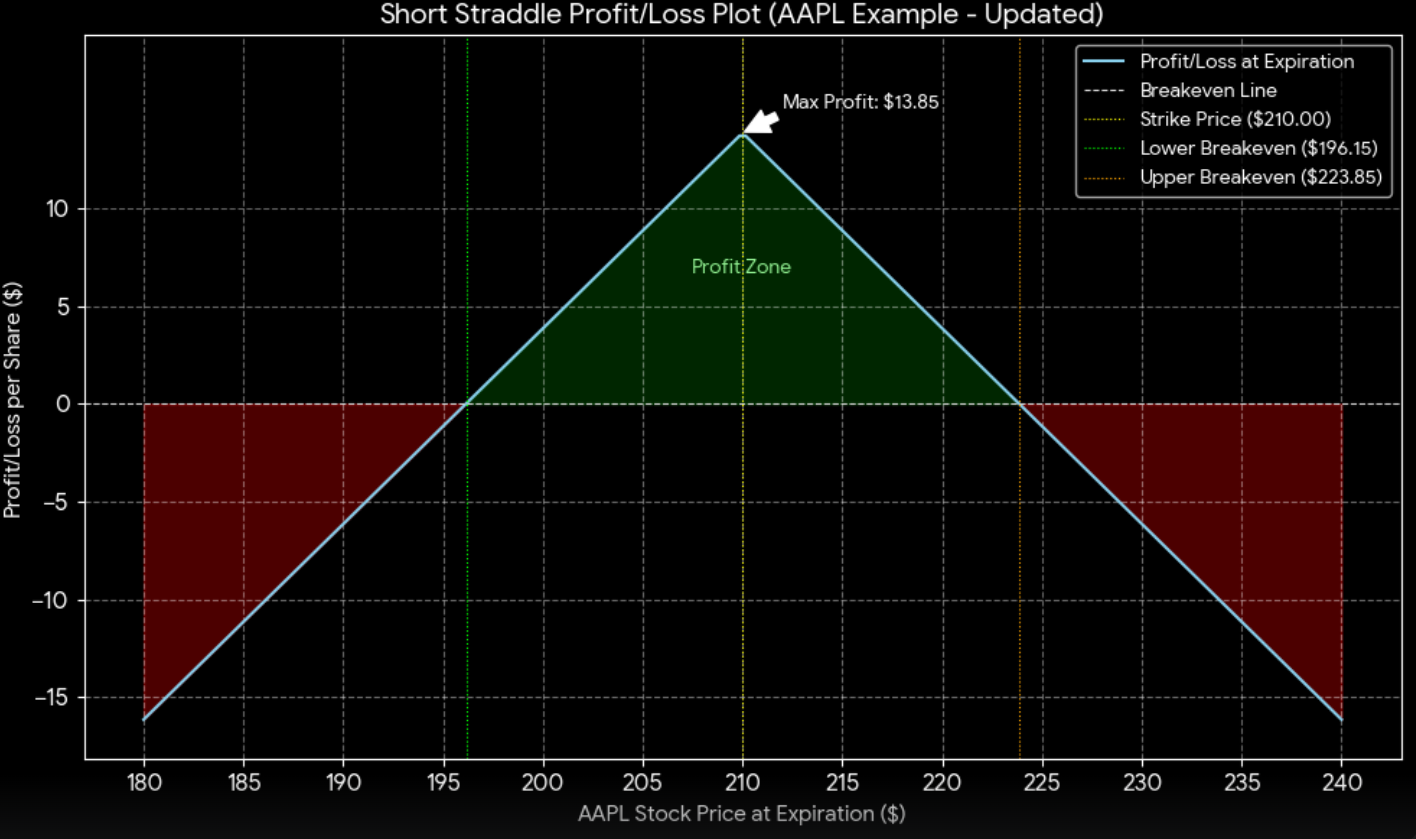
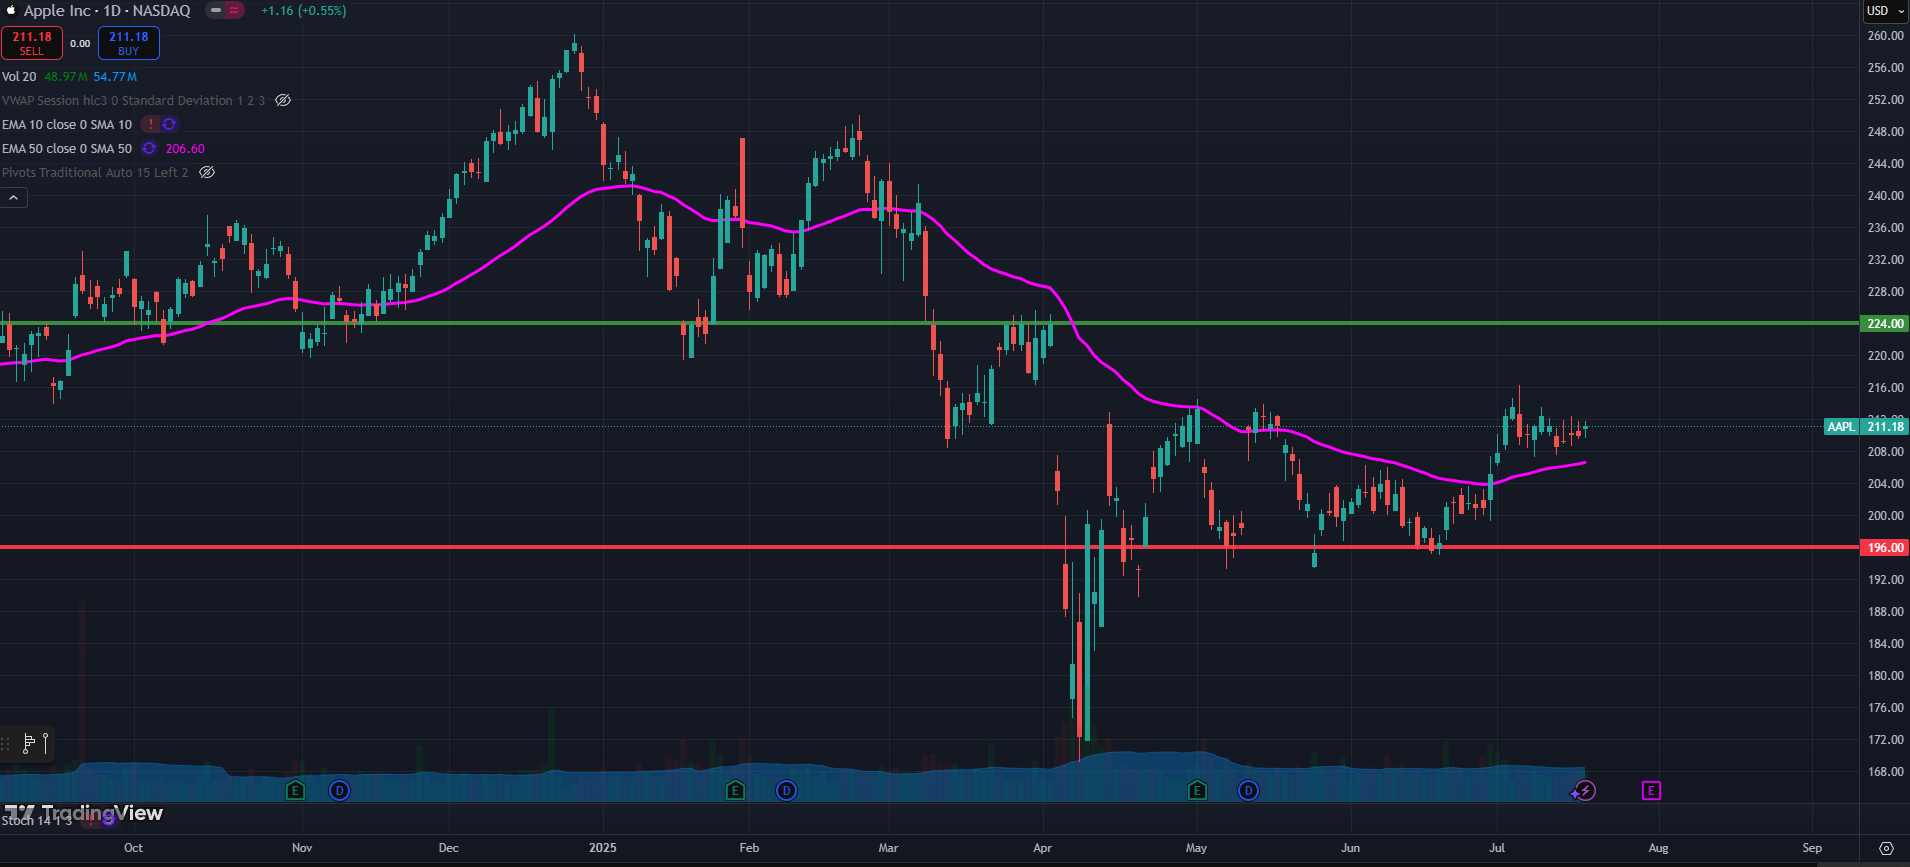
Below is the typical Profit/Loss plot for a short straddle, or selling of a straddle using AAPL stock as an example. I also added the chart of AAPL from tradingview.
Set up of the trade
AAPL is currently trading at $210 (I always do rounding). Since mid-April, it is going sideways, no one knows the future, but one assume that it will continue to go sideways for the next month. If we make that assumption we can set up a short straddle.
Here are current option prices based on the last trade on Friday:
Sell AAPL August 15, 2025 $210 Call: You receive a premium of $7.70.
Sell AAPL August 15, 2025 $210 Put: You receive a premium of $6.15.
Total Premium Received: $7.70 (Call) + $6.15 (Put) = $13.85 per share.
Since one option contract represents 100 shares, the total premium collected is $13.85 * 100 = $1,385.00. Minus the commission, and this will be the max possible profit.
Breakeven Points:
To determine the profit/loss, we need to find the upper and lower breakeven points.
Upper Breakeven Point: Strike Price + Total Premium Received = $210.00 + $13.85 = $223.85
Lower Breakeven Point: Strike Price - Total Premium Received = $210.00 - $13.85 = $196.15
I have highlighted $224 at green, and $196 as red in the chart above. Notice, technically speaking that is fairly nice support and resistance area, approximately. That is a good independent test. The way to read this, in the next 26 days if AAPL trades between $224 and $196 the trade is profitable, and if AAPL trades outside of that, losses will accumulate based on the first plot.
Risks
In financial market, nothing is free. Also there is always someone else is taking the opposite side of your trade. Typically you do this type of trade when there is no event expected. However, if I look at AAPL chart, I can see that earning announcement is July 31. I will NEVER hold a short straddle into the earning. Why? Because AAPL can move $20 - $50 on an earning call and that meaning volatility will be extreme immediately after, and can easily take you out of that trade. Although volatility will likely collapse after, but still the gap maybe too big to close to make the trade profitable. If I am entering this trade, likely I will exit before July 31.
Asymmetric Risk
The point of this discussion was to talk about asymmetric risk. When a person invests in LP, the best outcome is the price of the two underlying stays exactly where it is, and a lot of trading is happening. Therefore, the person in LP will be collecting a lot of fees. Risk is, the fees are small and accumulate over time, just like option premiums are small and accumulate over multiple trades. But the risk profile is large and a single large loss can offset months of small profits. That is the similarity between LP and short Straddle.
https://media.giphy.com/media/v1.Y2lkPTc5MGI3NjExaDBldXhqODk4emZrcnNsMWFkZWhwbnc0OHI3OGxjcTdrdnJsc2hzeSZlcD12MV9pbnRlcm5hbF9naWZfYnlfaWQmY3Q9Zw/35pTQFiy14OeA/giphy.gif
https://files.peakd.com/file/peakd-hive/zord189/Zcxlm2md-azircon.gif