It is ugly out there
As you all know if you follow my blogs, that I work in the oil and gas industry. For the last 9 months, which is basically all this calendar year, oil and gas industry have been going through many rounds of lay off. This is nothing new for an industry that is shrinking for at least multiple decades now, and we can only grow through acquisition. However, I am now seeing the trend spill over into many industries to the overall US job market. As per the latest jobs report, US added only 22K jobs in August. This data typically get revised downward in this cycle, so we can safely say that 22K job growth is NO GROWTH. The opposite of that data is the initial jobless or unemployment claims, which for the week of Sep 6 is 263,000, the magenta curve in the plot below, it is at 4 year high! By the way, that translates to an unemployment rate of 4.3% (typically sustained rate of >6% is considered recession)
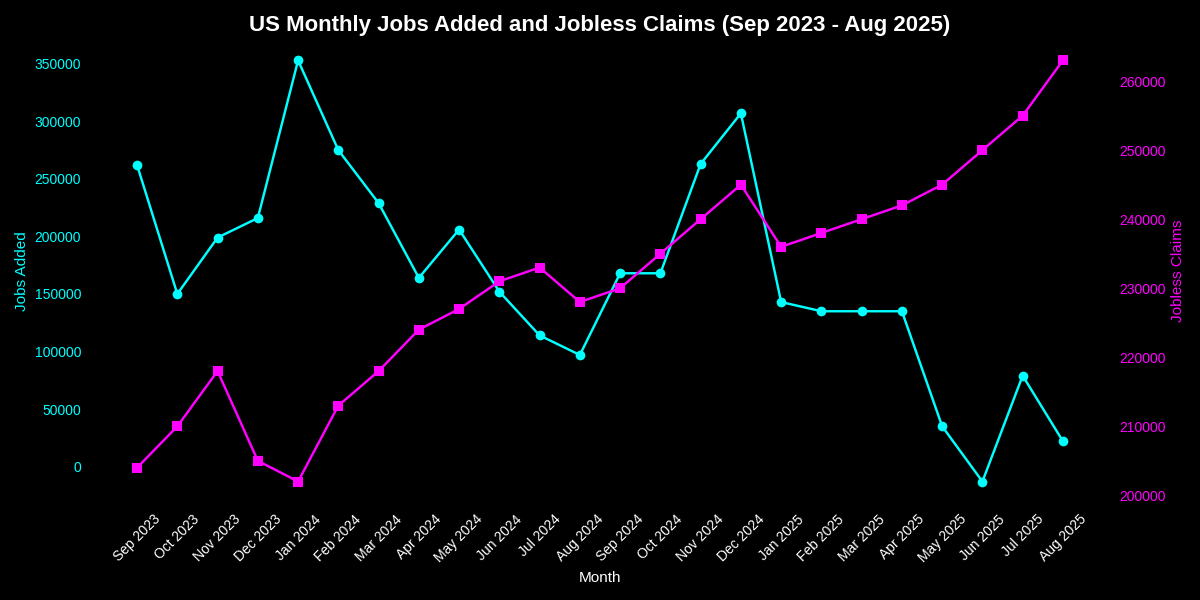
The plot above is very simple. The blue line, the jobs created, is going down, and the magenta line is making new high. This is typically a precursor to a recession.
Trouble is recession is not an easy thing to define mathematically or by economic indicators. Definition of recession is easy, but the metric to judge it is very hard. Let me explain:
A recession is typically defined as a significant decline in economic activity that is widespread across the economy and lasts for a sustained period.
However, there are many factor or metrices to judge recession. Typically not all of them line up at the same time.
Two-Quarters Rule:
A recession is often identified when real Gross Domestic Product (GDP) declines for two consecutive quarters (six months). This is a widely used rule of thumb, though not absolute, as it may miss shorter or less severe downturns. Trouble with this is the fact that this is a lagging indicator. Meaning, you only find out after six months of negative GDP growth, so my the time you find out that you are 'officially' in recession, you are already in a recession for 6 months! You see the problem?
NBER Definition:
The National Bureau of Economic Research (NBER) in the U.S. provides a more nuanced definition, describing a recession as "a significant decline in economic activity spread across the economy, lasting more than a few months, normally visible in real GDP, real income, employment, industrial production, and wholesale-retail sales." The NBER considers the following items
- Real GDP: Declines or very low growth in inflation-adjusted GDP.
- Employment: Rising unemployment rates or significant job losses.
- Real Income: Decreases in personal income (adjusted for inflation).
- Industrial Production: Declines in manufacturing and industrial output.
- Wholesale-Retail Sales: Drops in consumer and business spending.
As you can see, there are multiple criteria, In most case you might check, 3 or 4 boxes out of five. Now it is up to you to say if you are in a recession or not! Well, depends on your life situation, you maybe in recession for many months, if not years by then!
Key Economic Indicators
These are the ones I like, because it is publicly available and you can make your own judgement call.
-
Unemployment Rate: A sharp increase (e.g., above 6-7%) or sustained rise can signal a recession. However, this is a lagging indicator. Just like GDP decline of 1-2% for 6 months as mentioned above, is also a lagging indicator.
-
Jobless Claims: A persistent rise in initial jobless claims (e.g., consistently above 300,000-400,000 weekly) indicates labor market weakness. Again, lagging indicator
-
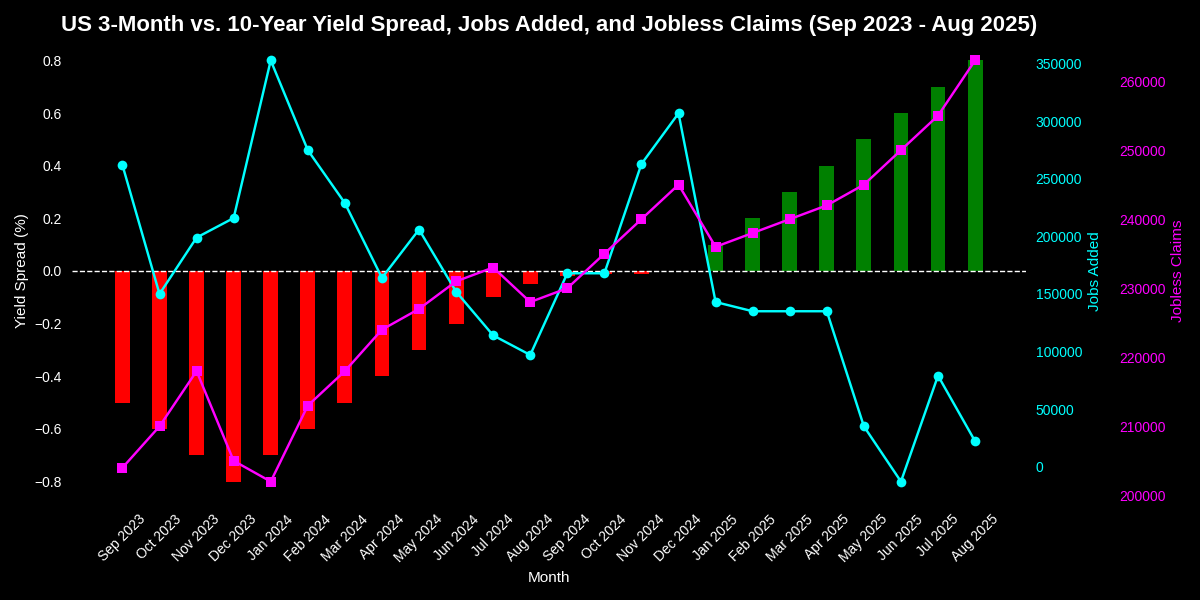
Yield Curve Inversion: A sustained inversion of the yield curve (e.g., 3-month minus 10-year Treasury yields turning negative) is a leading indicator, often preceding recessions by 6-24 months. This difference between 3-mon and 10-yr (or any other number) is called a yield curve spread. This one I like it a lot, because this happens well before the onset of recession, so this is a forward looking indicator.
-
Consumer Confidence: Sharp declines in indices like the Consumer Confidence Index reflect reduced spending, a key recession driver. Again, slow, and lagging indicator.
-
Industrial Production and Retail Sales: Consistent declines in these metrics signal reduced economic activity. This is unfortunately hard to judge and difficult to interpret.
Yield Curve
Out of all these, the Yield Curve and rather the Yield curve spread is most useful to me personally. I already explained the reason, but for the uninitiated let us discuss a bit more.

A typical healthy yield curve translates to the plot above where, the longer term US treasury bond yield rate are progressively higher. This makes sense in normal cases. You are paid more to hold a coupon longer term. So in this particular case yields were:
3-month = 0.5% 10- years = 2.5%
Therefore yield spread between 3-mon and 10-yr is (2.5-0.5) = +2%. The spread is positive.
Here is the cool part. Since this is a forward looking indicator, people study this and plot this in gory details. On this plot, every time the spread goes negative, or to the top red part of the plot, a recession follows. This is NEVER wrong, so far! :)
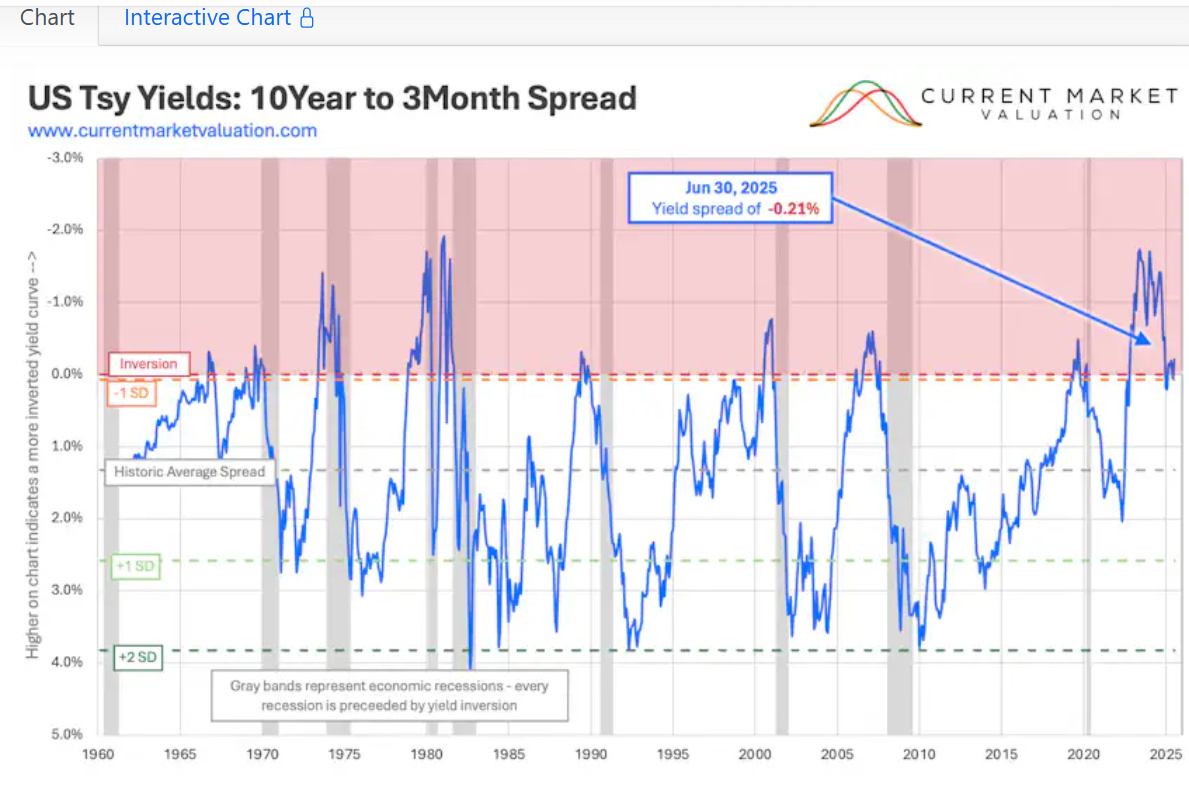
Well, if you read this plot, we have been pushing negative yield spreads and therefore inverted yield curves for months.
Where is our recession? Incoming?
Are we in one already?
I have no prediction or advice for you, only thing I can say, if you are in a job, keep it. Do whatever you can to keep it. Take a pay cut to keep. Because, it is ugly out there.