In my last post about our Farmer's Market, I went only into revenue, and it was very interesting (at least for some...). This time, I went to the number of clients attended, and then put that into correlation with the revenue.
Higlights:
- we attend on average between 10 and 20 clients per vendor per day
- there's a moderately strong correlation between clients attended and revenue
- outliers will destroy the world
- for each new client attended, the total revenue goes up by $7.36
- if I exclude the outliers, it's only $1,95 per extra client attended
https://images.hive.blog/0x0/https://files.peakd.com/file/peakd-hive/beelzael/2423wZuYf6s3zxb4FZEQfmQiupdh8ByDkBYX7DrftNQ26kPaAgaBrAVDaH26SM1LVdAkb.jpg
For those who do enjoy statistics and maths, below this introduction you will find the full interpretation, which will be 2 pages in my "study". I'm having a lot of fun doing this, way more than I should, and it does not help my coffee consummation. But it helps me a lot to reflect about the Farmer's Market as a stable and strong economic pillar of our community in Cotacachi.
The more I calculate and interpret, the clearer it becomes that I had underestimated our impact in the local economy, and in people's lives for that matter.
As mentioned before, Ecuador is a country with a low GDP, high income inequality (Gini-Index of 44,6), 11% of the population in extreme poverty and another 27% in poverty (2024 Data). Though Cotacachi city is considered Urban, the bigger part of the Cantón is rural. Generating an extra income even of "only" $2 is a significant contribution in that setting.
Besides that, the Farmer's Market helps the local businesses to sell more goods and with that produce more and employ more locals, which is usually the case. In the last post, I already explained the real trickle down effect that we enable, not that neo-liberal BS promoted by kleptocratic governments (yes, frustration building). We really have a big impact, and it didn't take many of us, though quite a bit of effort, vision and patience (mainly with other humans).
Small communities matter. Small communities do the difference. Crunching through all that data, I'm a little more hopeful today than I was yesterday.
Clients attended
Directly related to the income is of course the number of clients attended. While we see some booths busy all the time, others have a more relaxed market day, and usually, that should be noticeable in the numbers as well.
Question
How many clients do you attend on a regular day?
[ _ ] 1 - 5
[ _ ] 6 - 10
[ _ ] 11 - 20
[ _ ] 21 - 50
[ _ ] 51 - 100
[ _ ] more than 100
Answers
| Clients attended | Answers | Total Clients |
|---|---|---|
| 1-5 | 17 | 51 |
| 6-10 | 22 | 176 |
| 11-20 | 33 | 495 |
| 21-50 | 25 | 950 |
| 51-100 | 2 | 152 |
| 100+ | 1 | 150 |
| Total | 100 | 1974 |
| Median | 11 - 20 | |
| Average | 9,04 | 20 |
Again, we went for ranges to establish the pattern. The total clients where consequently calculated based on the mid-points of the range.
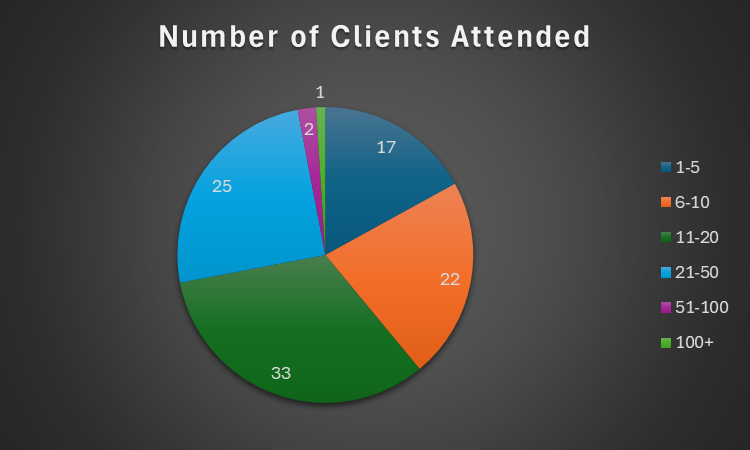
The first thing that sticks out is that 38% of our vendors attend 10 or less people, which raises the question why so few, which we will address later with a correlation. The good thing is that more than half of the vendors attend between 11 and 50 clients per market day, which in my eyes is a healthy rate that can sustain an average business.
Interpretation
I used the same method as with revenue to calculate the total amount of clients that are attended at the Farmer’s Market. Please remember that some of them go to several booths and buy from several vendors, so this number is not representative of the number of total humans that visit the Farmer’s market – those are less than the 1974 attended clients that I calculated.
The median and averages are not as consistent in this set of data as it is in revenue. The median is at 11-20 attended clients (meaning, 50% of the data sample is below, and 50% above that), while the average calculated from the answers is only 9 people per day, and the average calculated from the total is 20 people per vendor per day.
The calculated average is a little high as the outliers are included, but probably closer to the truth in total (same as it was with revenue), while the average derived from the answers is closer to the truth for the majority of vendors.
Correlations
The calculated correlation between the revenue segment and the segment of number of clients attended is 0,77, indicating a moderately strong correlation between the two segments (meaning, when one goes up, it's very likely that the other one goes up, too). That correlation also lets us assume that 60% of the variations we see in revenue is explained with the number of clients attended by the vendor. The other 40% might be due to other factors.
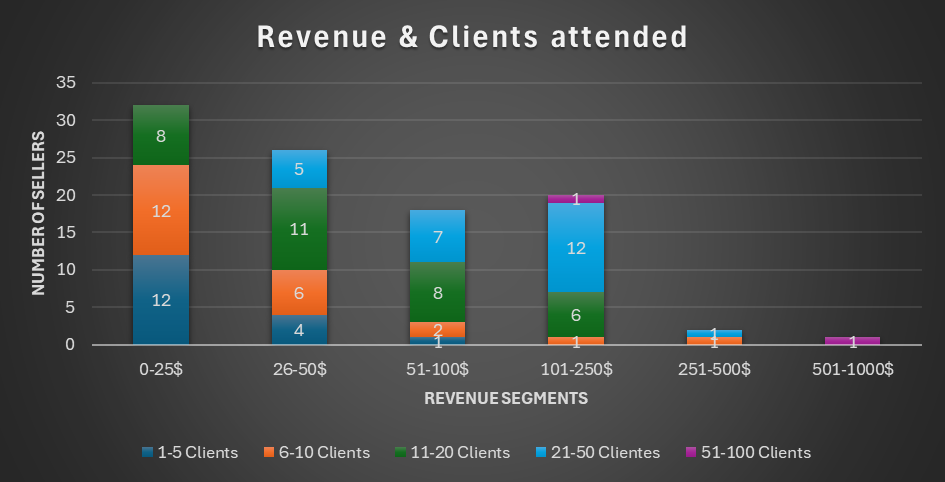
When we combine the answers regarding revenue and clients attended, we can confirm that the more clients are attended by the venors, the higher the revenue is. I excluded the $1000+ Revenue and the 100+ Clients attended as they are the same booth, and unique.
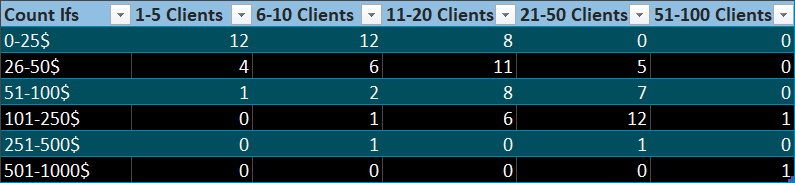
It is to note that not each client attended converts into a customer. For example, I suspect that of the 8 vendors that attend 11-20 clients per day, only half of those converts into a customer. It also depends on the value of products that are being sold. Vegetables have less revenue per client, bread has a lot more, and meat products generate the most revenue per client, as we will see later.
Conclusion
Around 2000 attended clients per day is a great outcome for our market. If we relate that to the $9200 daily revenue, we can derive that each client attended leads to $5 in revenue. We can also see that generating a higher rate in clients attended will probably lead to higher overall revenue, as there is a moderately strong positive correlation between the revenue and the clients attended.
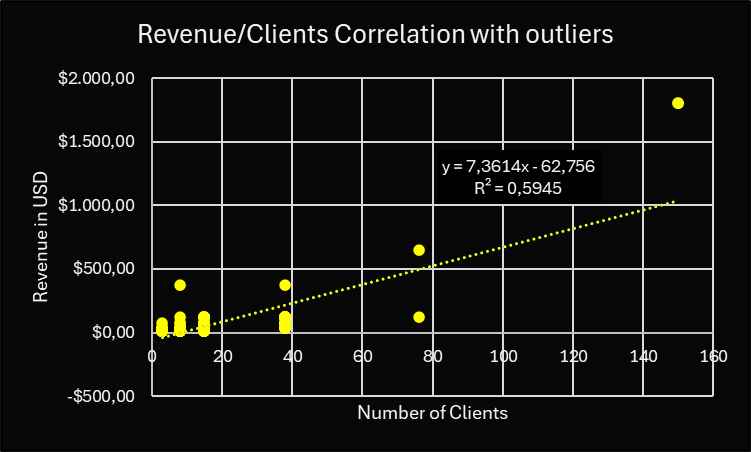
Using the total set of data available, we can conclude that each new client visiting the Farmer’s Market would generate $7.36 in revenue per day. Unfortunately, that is mostly based on a total of 4 outliers in revenue/clients attended and 1 in clients attended/revenue. If the new client does not visit any of those booths, the probable impact on the total revenue is much lower.
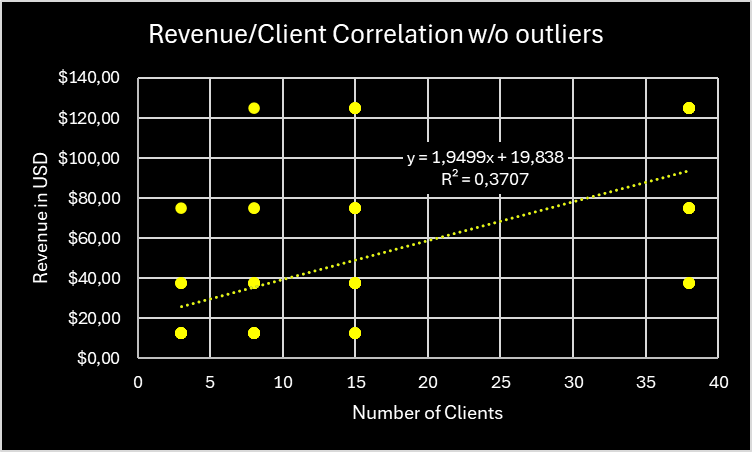
Excluding the 5 outliers, we would gain $1,95 extra revenue for each new person that is attended at the Farmer’s Market. Although that sounds very small, it could have a big impact especially on those vendors that are currently in the $0-25 range.
Additionally, the r² goes from ~0,6 to ~0,37. That gives us a clue about the factors that determine the variation in revenue for those sellers who have less revenue. While in the first chart the 60% of the variation in revenue is explained by the number of clients attended, it's only 37% in the chart excluding outliers. Hence, there are other factors that influence more in the lower revenue segment. We will explore and calculate those in the following chapters.
To Consider
The data in this section can be skewed by misunderstanding the question, as it could be interpreted either as only clients that make a purchase, or clients that engaged in total.
That's it. That's chapter 2. Again, I'm very grateful for any feedback, especially if I did something wrong or my interpretation is flawed. I want to create the best possible report on this.