Grafana is a a nifty tool and create dashboards based on various data sources. One of them is Loki which aggregates logs via various methods and Grafana can be used to display them.
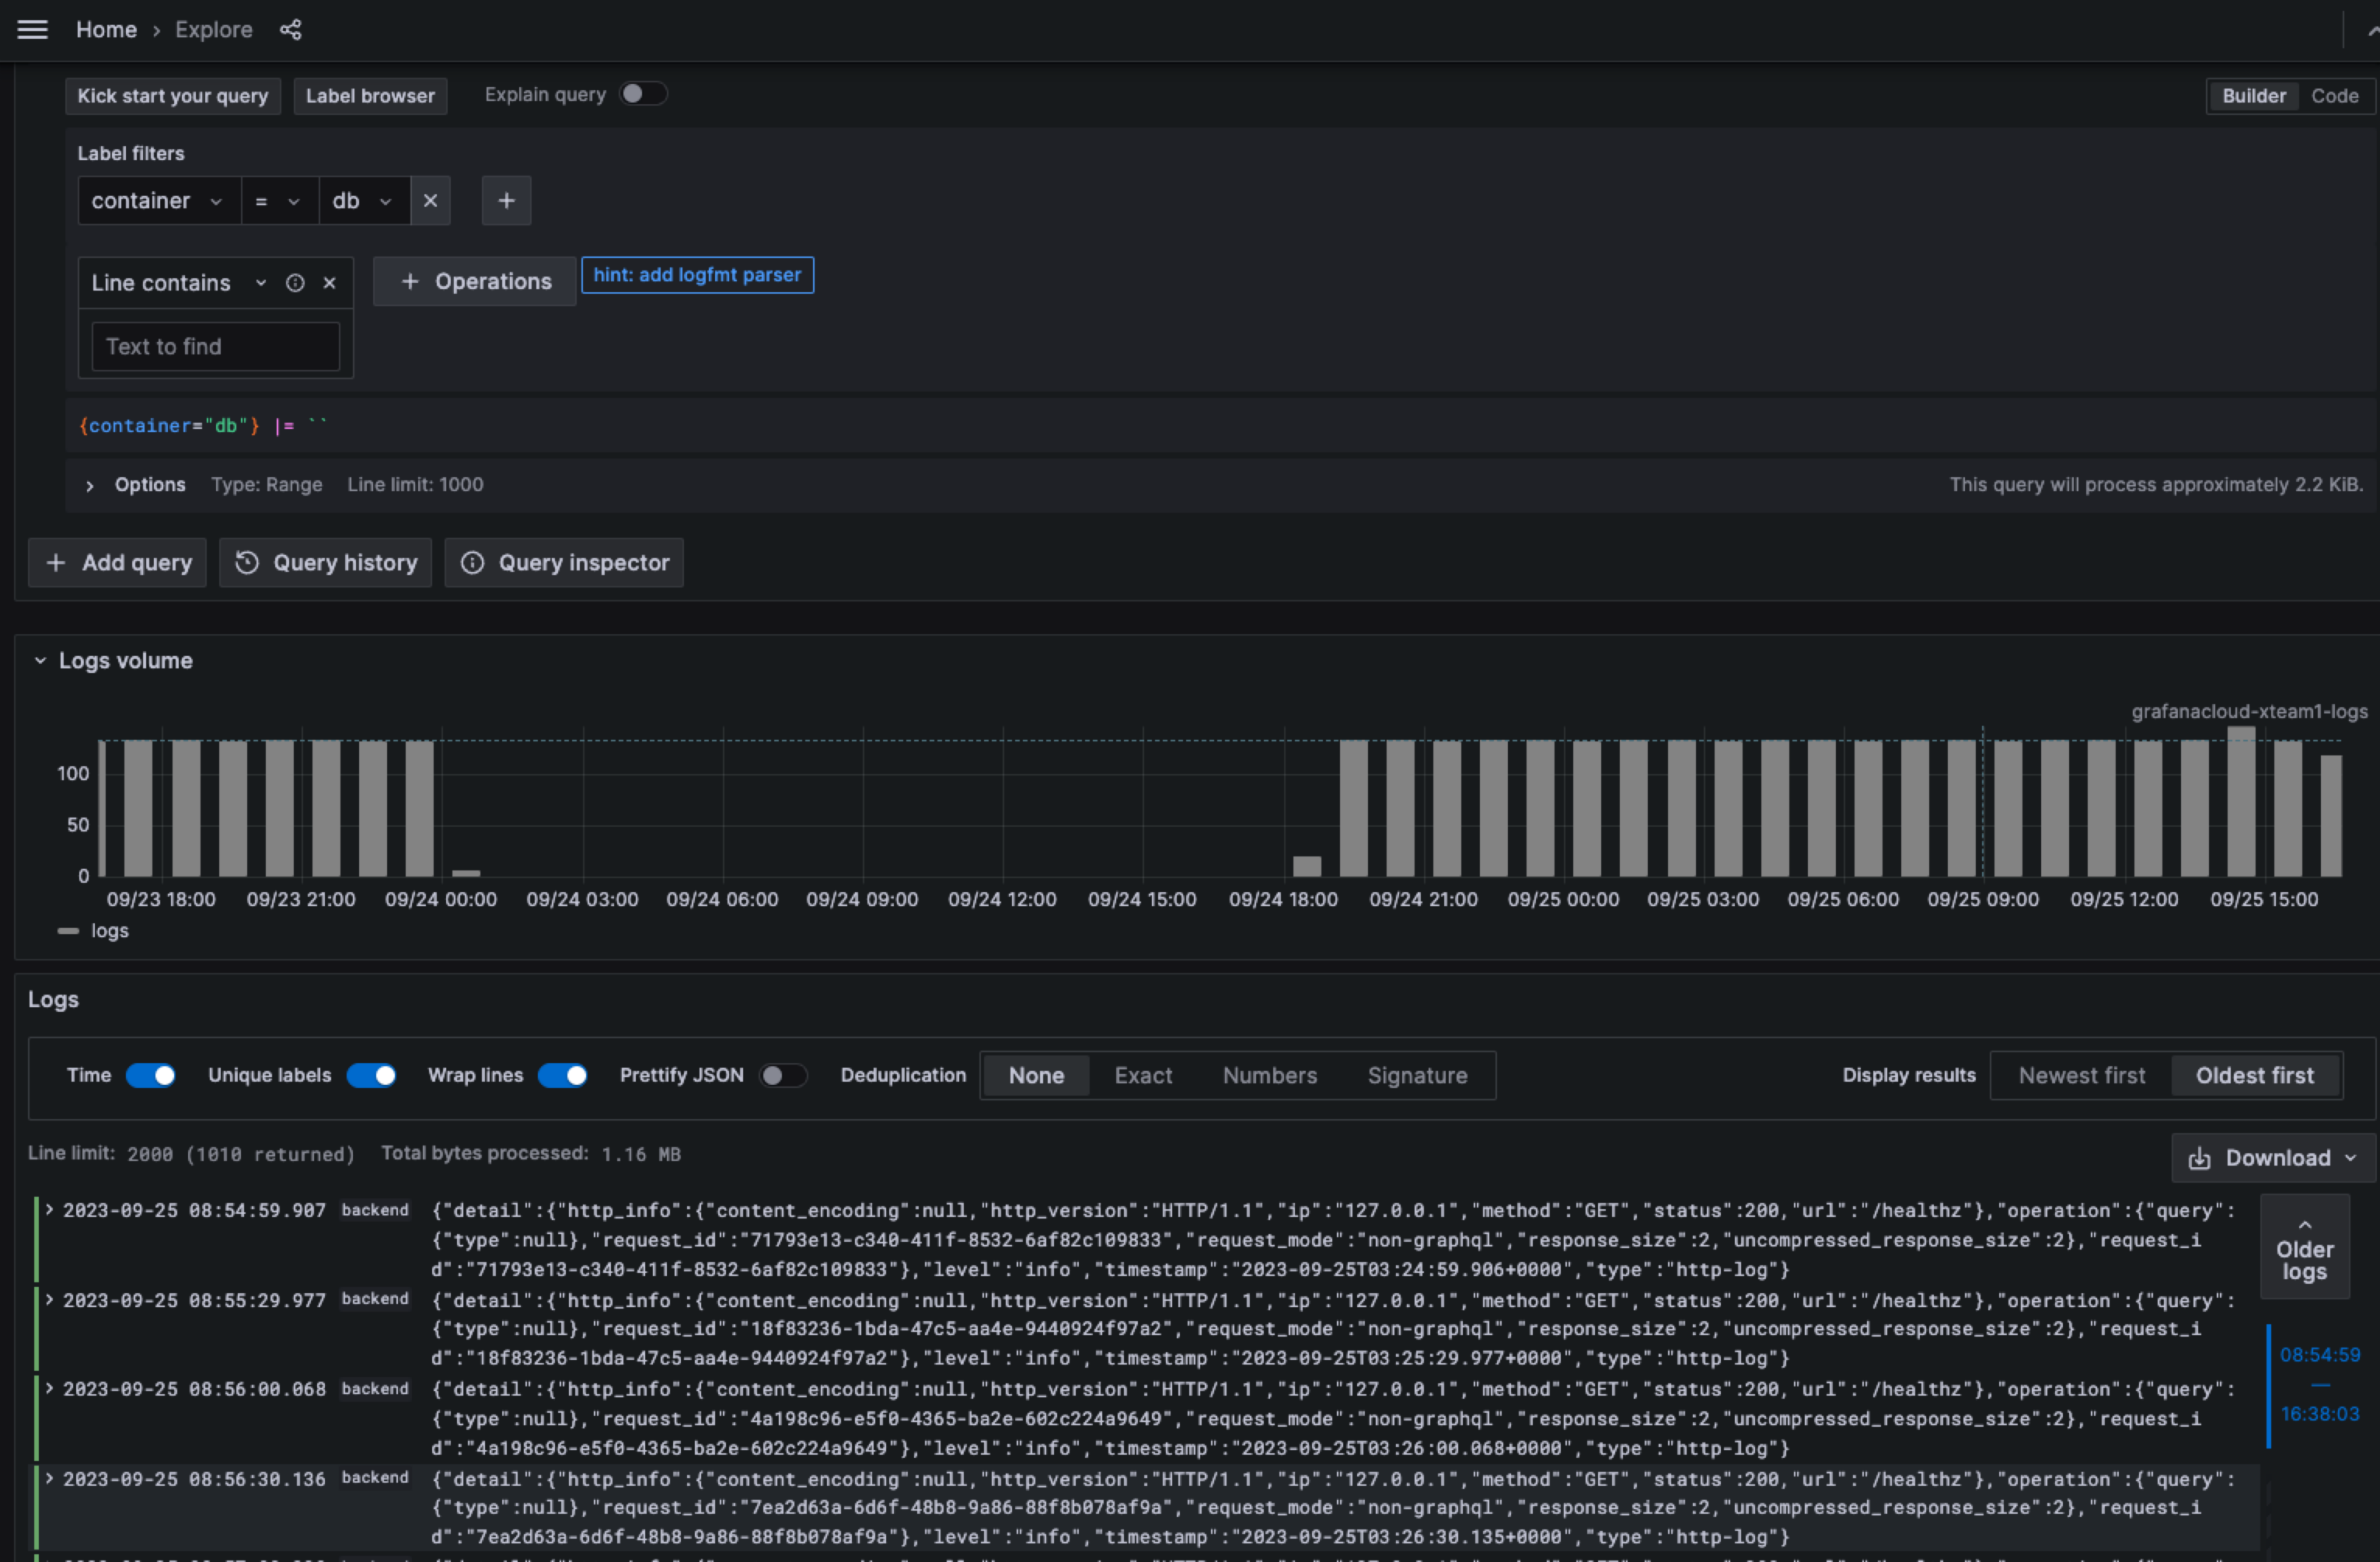 [Back-end logs from a NextJS appkication with PostgreSQL as db]
--
Its handy to get development logs and if the application that you are working is open source and sharing the logs from local is allowed, then, using the Grafana Labs free tier is a great use case.
[Back-end logs from a NextJS appkication with PostgreSQL as db]
--
Its handy to get development logs and if the application that you are working is open source and sharing the logs from local is allowed, then, using the Grafana Labs free tier is a great use case.
Sending logs from Docker
Many a times the application may not be supporting instrumentation for all use cases. For example NextJS seems to supporting Traces and not logs quite well at this point. One easy trick is send the logs via promtail.
Lets take the use case of the local application under development running in a dockerized manner. In such cases, we can use the following trick to send the logs to Loki.
In the docker-compose.yml find the services section if you have add labels
services:
  backend:
    container_name: backend
    image: backend
    restart: always
    build:
      context: ./backend
    depends_on:
      db:
        condition: service_healthy
    env_file: ./backend/.env
    volumes:
      - ./backend/migrations:/hasura-migrations
      - ./backend/metadata:/hasura-metadata
    ports:
      - "8080:8080"
    labels:
      # Add the key and service name labels
      service.name: bebe
      logging: "promtail"
      logging_jobname: "containerlogs"
Once you are setup, then start a promtail container as follows:
docker run -d --name promtail --restart always -v /var/run/docker.sock:/var/run/docker.sock -v /var/lib/docker/containers:/var/lib/docker/containers:ro grafana/promtail:latest -config.file=promtail/config.yaml
The promtail config file can be:
# bash
root@adcf64feff04:/# vim /etc/promtail/config.yml server:
  http_listen_port: 0
  grpc_listen_port: 0

positions:
  filename: /tmp/positions.yaml

clients:
  - url: https://GrafanaLabsUserID:@logs-prod-018.grafana.net/loki/api/v1/push

scrape_configs:
  - job_name: flog_scrape
    docker_sd_configs:
- host: unix:///var/run/docker.sock
refresh_interval: 5s
filters:
- name: label
values: ["logging=promtail"]
    relabel_configs:
- source_labels: ['__meta_docker_container_name']
regex: '/(.*)'
target_label: 'container'
    pipeline_stages:
- cri: {}
- multiline:
firstline: ^\d{4}-\d{2}-\d{2} \d{1,2}:\d{2}:\d{2},\d{3}
max_wait_time: 3s
 # https://grafana.com/docs/loki/latest/clients/promtail/stages/json/
- json:
expressions:
level: level
How to find
$ echo -n ":" | base64
This will make the listener to start looking for the logs & send to Grafana cloud.