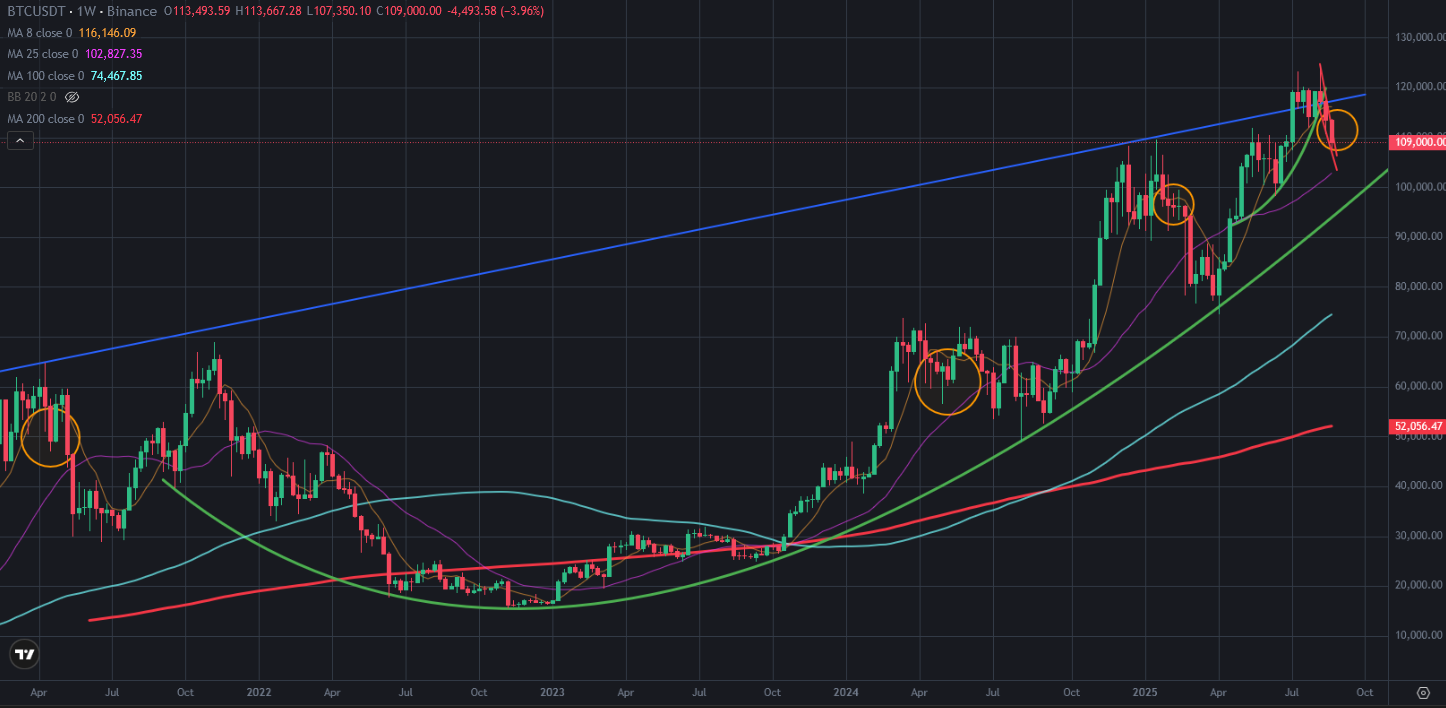
This is 3rd week that we have seen weekly red candles on Bitcoin price chart. After touching all time high level at 122K USD, Bitcoin price is going down. We have see 3 weekly red candles after all time high level. It may be a price correction.
Here you can see weekly chart of Bitcoin price. We have seen these weekly red candles series at the beginning of 2024 and 2025. We did see more weekly red candles in 2022 and 2023. There is no market crash. So, weekly red candles series may end at 3rd week.
Here you can see the indicators on weekly chart of Bitcoin price. When we look at the indicators, it was possible to see price correction on Bitcoin price chart. Because Fisher Indicator reversed down from the top. MACD Indicator also reversed from the top. There is great downtrend line on RSI Indicator. It is tested 3 times to break up.
We will see mega bullish season after Bitcoin broke up this resistance on RSI Indicator.
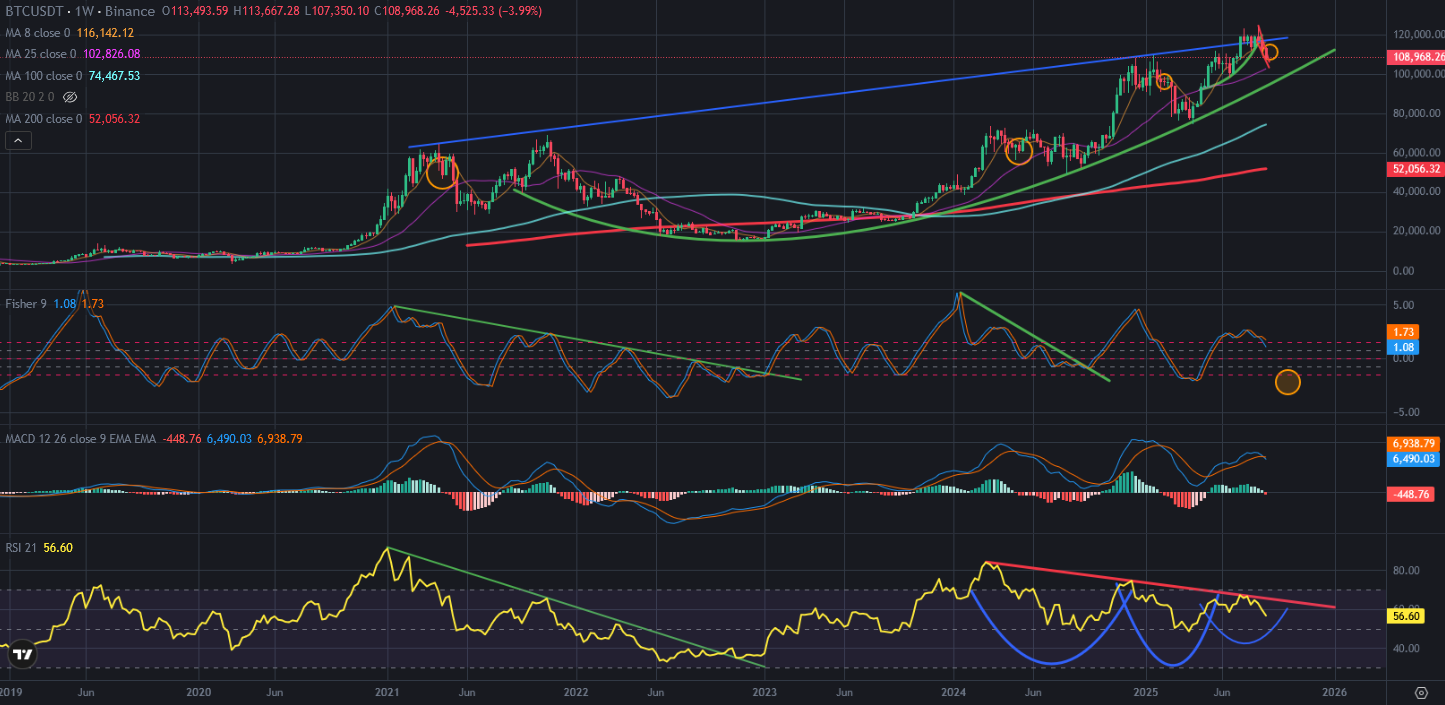
There is great pattern on RSI Indicator at weekly chart of Bitcoin price. We will see huge price pumps on Bitcoin price chart and all crypto market after breaking up this downtrend line. We should follow this trend.
We will see.
Posted Using INLEO