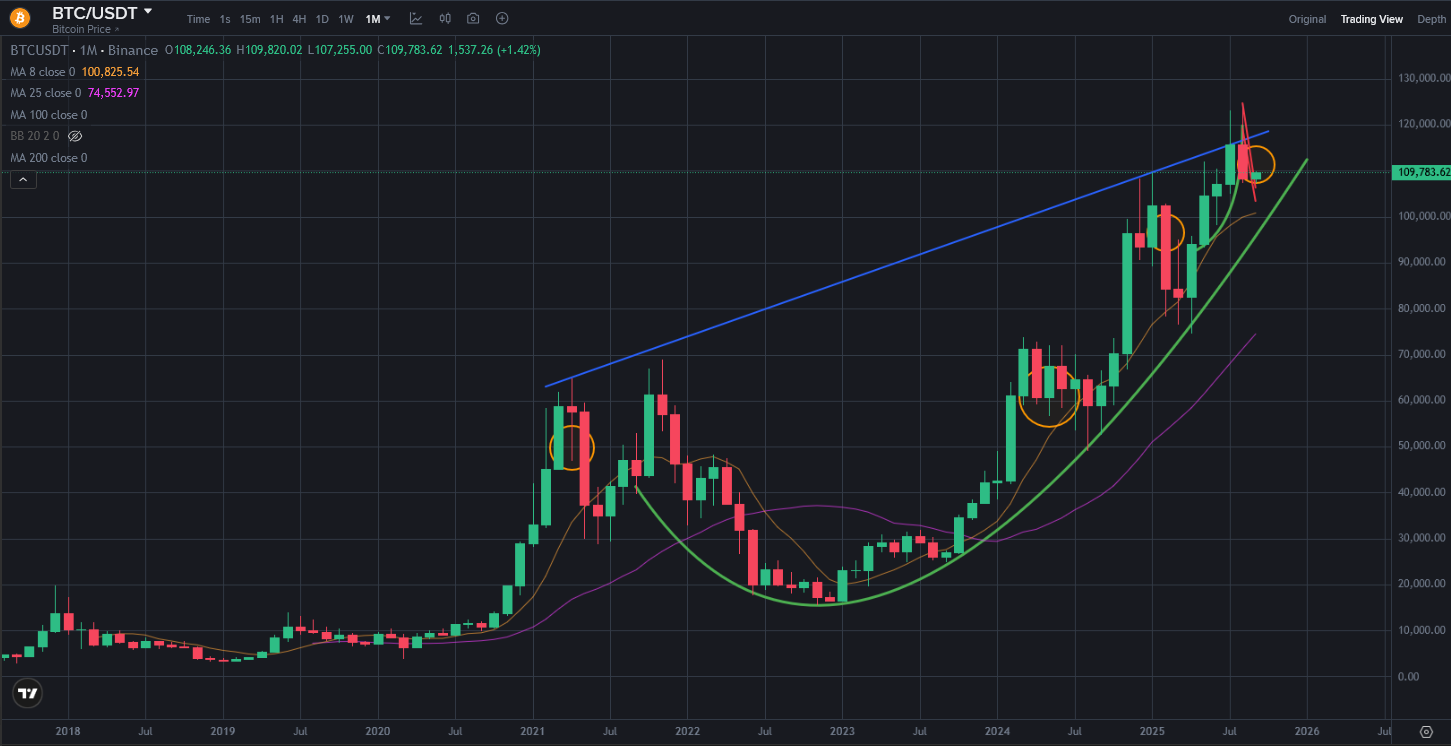
There is great great monthly candles series on Bitcoin price chart. Yesterday was the last day of the month. Bitcoin price chart got red monthly candle. It can be said it is price correction after getting 4 green monthly candles.
Here you can see monthly chart of Bitcoin price. There is 8-month moving average that shows us lon term trend. It is at 100K USD. Bitcoin price has range to continue bullish trend. Even Bitcoin price chart gets more monthly red candles, There will be no problem for long term trend.
Here you can see the indicators on monthly chart of Bitcoin price. There is great downtrend line on RSI Indicator. There is great support line on RSI Indicator. They will be crossed in a few months. We will see huge moves on Bitcoin price chart. Fisher Indicator is spending time. It reversed down after getting monthly red candle. It is great chance for correction.
MACD Indicator is trying to continue to go up. If Bitcoin price chart gets more monthly candles, we will see going up on MACD Indicator.
So, there is no negative appear on the indicators. Bullish trend will continue more months.
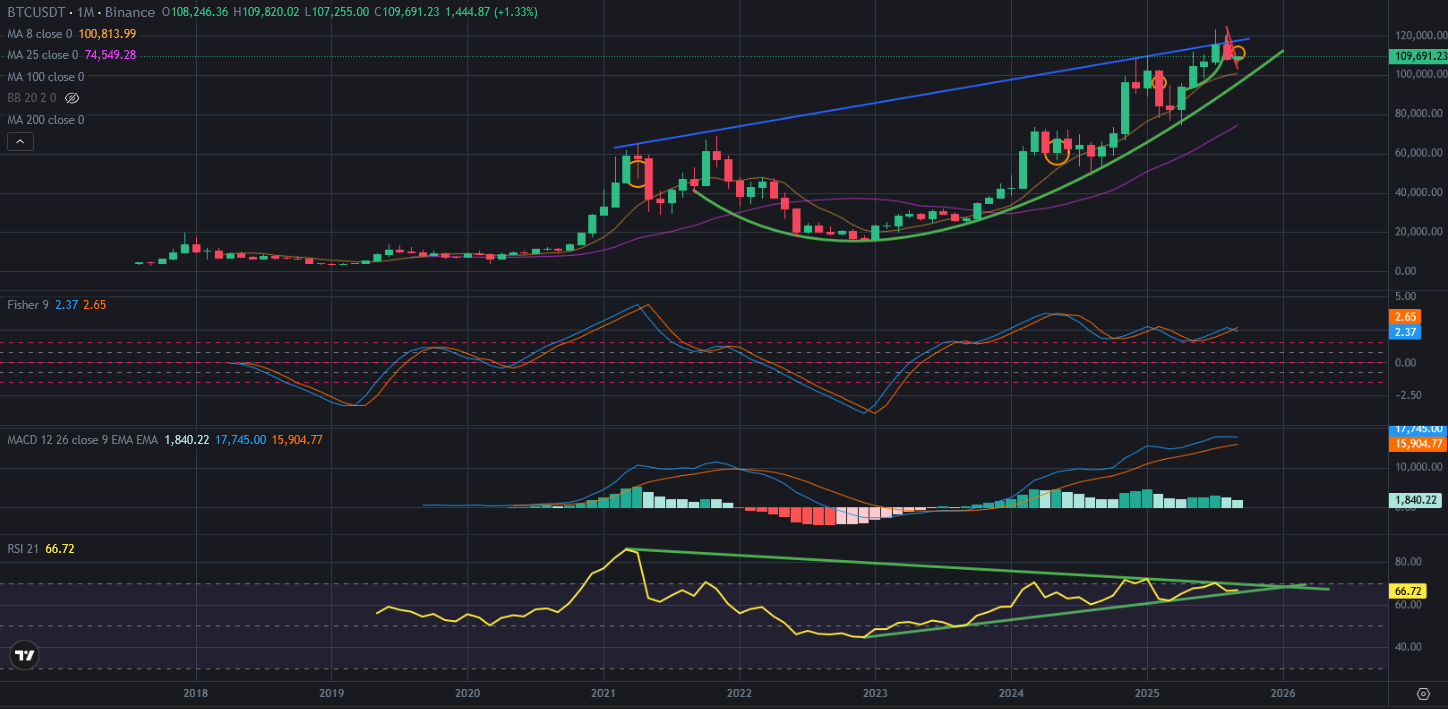
We may see parabolic price pumps on Bitcoin price chart in a few months. We should follow the resistance on RSI Indicator in monthly chart. After breaking up this resistance, we may see Bitcoin price at 150K USD.
We will see..
Posted Using INLEO