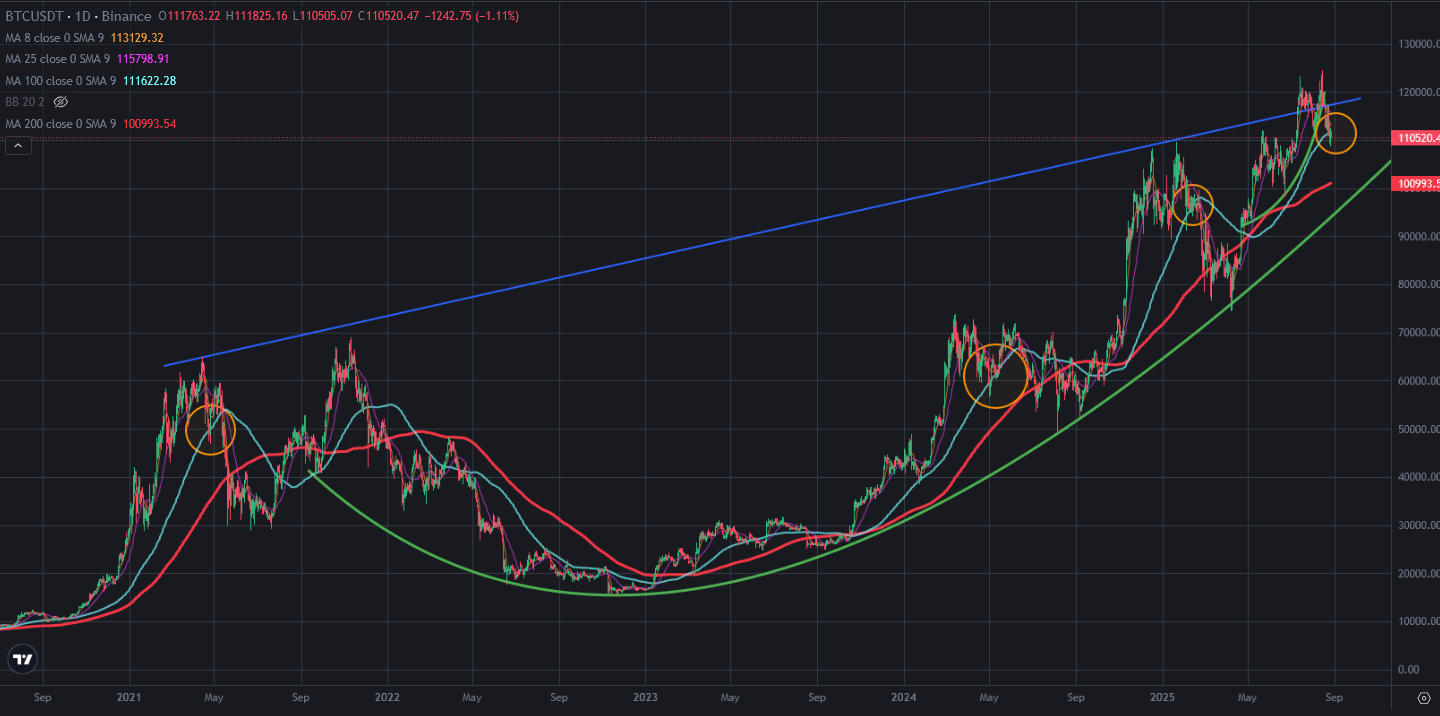
Bitcoin price broke down 100-day moving average after 7 months. It is one of great support line for Bitcoin price chart that suporrted Bitcoin price lots of times. After breaking down 100-day moving average, we have seen huge price drops on Bitcoin price chart.
Here you can see daily chart of Bitcoin price. There was great resistance on Bitcoin price chart coming from all time high level. Even it is broken up, Bitcoin price reversed down and went below this resistance. It may be a bullish trap. After reversing, Bitcoin price broke down 100-day moving average. You can see what happened after breaking down 100-day moving average. I circled the similarities between past and now. We may see price drop on Bitcoin price chart.
Here you can see the indicators on daily chart of Bitcoin price. There are lots of great bowl pattern on RSI Indicators. It seems it is broken down. Bitcoin price should reverse up to make a bearish trap. If not, we will see price drop on Bitcoin price chart. MACD Indicator is going down. Even Fisher Indicators is on the bottom, it can not reverse up.
Even indicators seems bearish, Bitcoin price can make a bearish trap. If it happens, all of indicators will start to appear bullish.
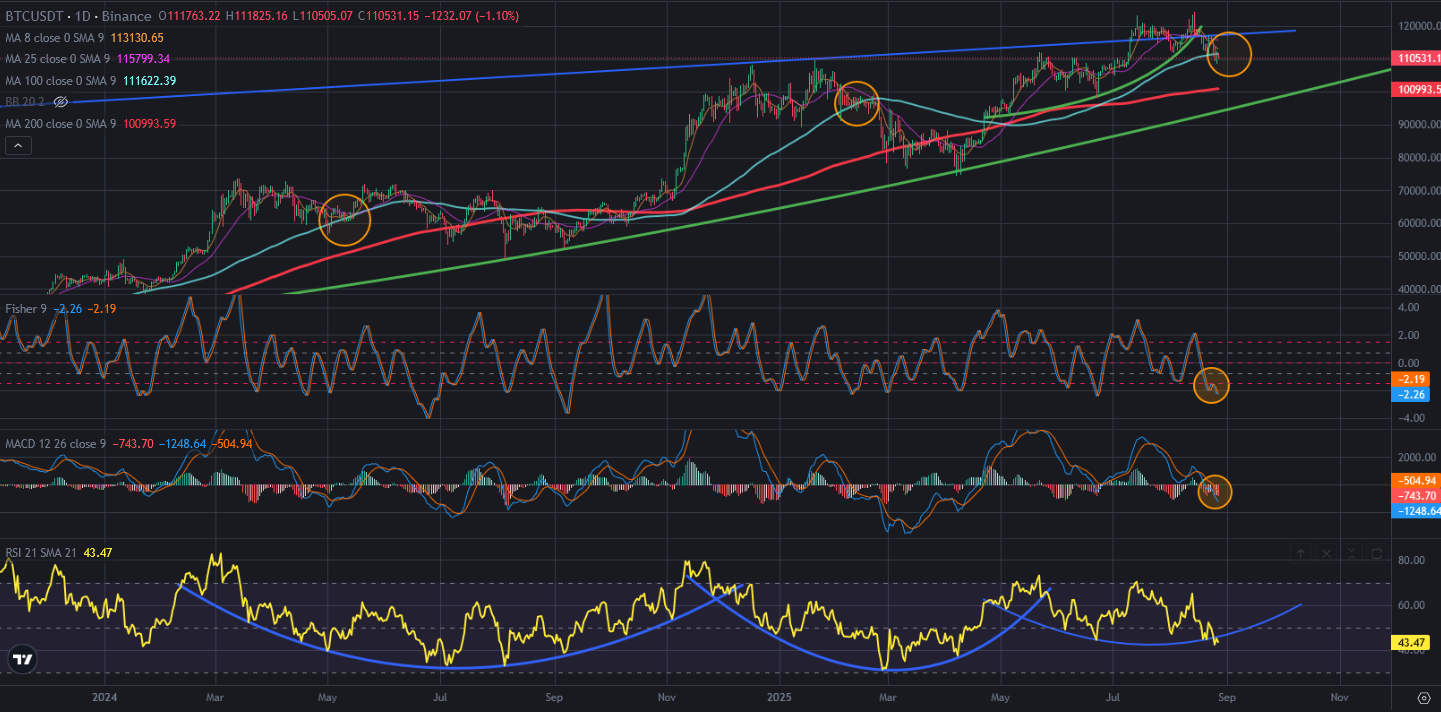
Bitcoin price should make a bearish trap. If not, we will see huge price correction. 200-day moving average is the first support line following Bitcoin price.
If we see huge price drop 200-day moving average will be the first great support.
We will see..
Posted Using INLEO