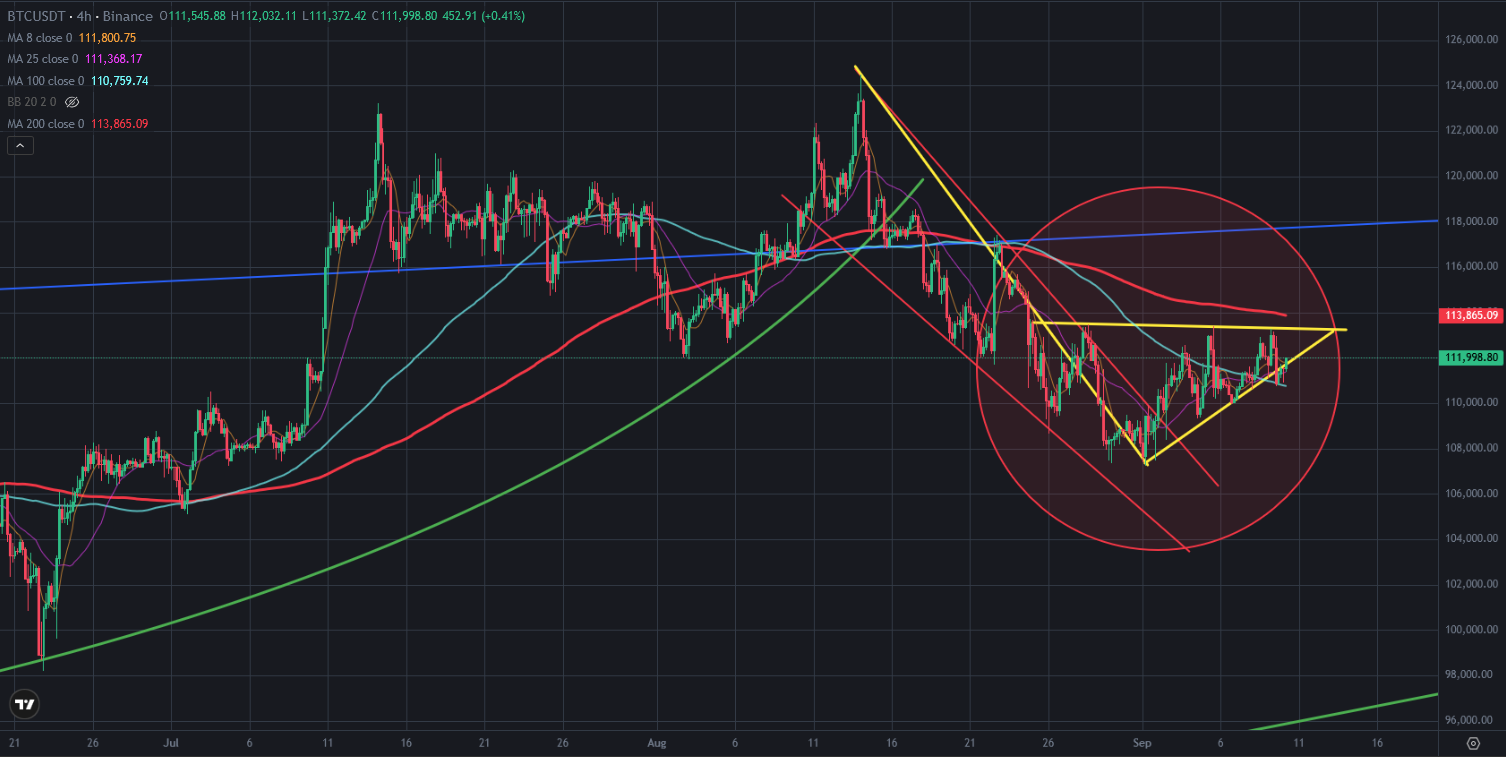
There was bearish flag pattern on Bitcoin price chart. I shared an analysis while Bitcoin price touching the top level of this pattern. Most of investors was waiting to see breaking up this pattern but I said Bitcoin price may reverse down from this resistance. and It reversed down.
Here you can see 4-hour chart of Bitcoin price. After reversing down from the top level of this flag pattern, Bitcoin price broke down the bottom line of this pattern. The bottom line seems as a support for Bitcoin price chart and It is broken down. Even it is broken down, Bitcoin price reversed up again and went into this bearish flag pattern. There is no negative appear on Bitcoin price chart yet.
Here you can see the indicators on daily chart of Bitcoin price. Fisher Indicator is on the top and ready to reverse down. MACD Indicator is close to touch the resistance which downtrend line coming from the top. When we look at the indicator, it may be possible to see reverse down on Bitcoin price chart.
When we look at moving averages on Bitcoin price chart, you can see why Bitcoin price reversed down yesterday. Bitcoin price reversed down yesterday to make daily close below 100-day moving average and It happened. Bitcoin price closed the day 100-day moving average..
I shared an analysis about this average yesterday and showed 25-day moving average will cross down 100-day moving average. It was a bearish signal. This is why Bitcoin price can not close the day above 100-day moving average..
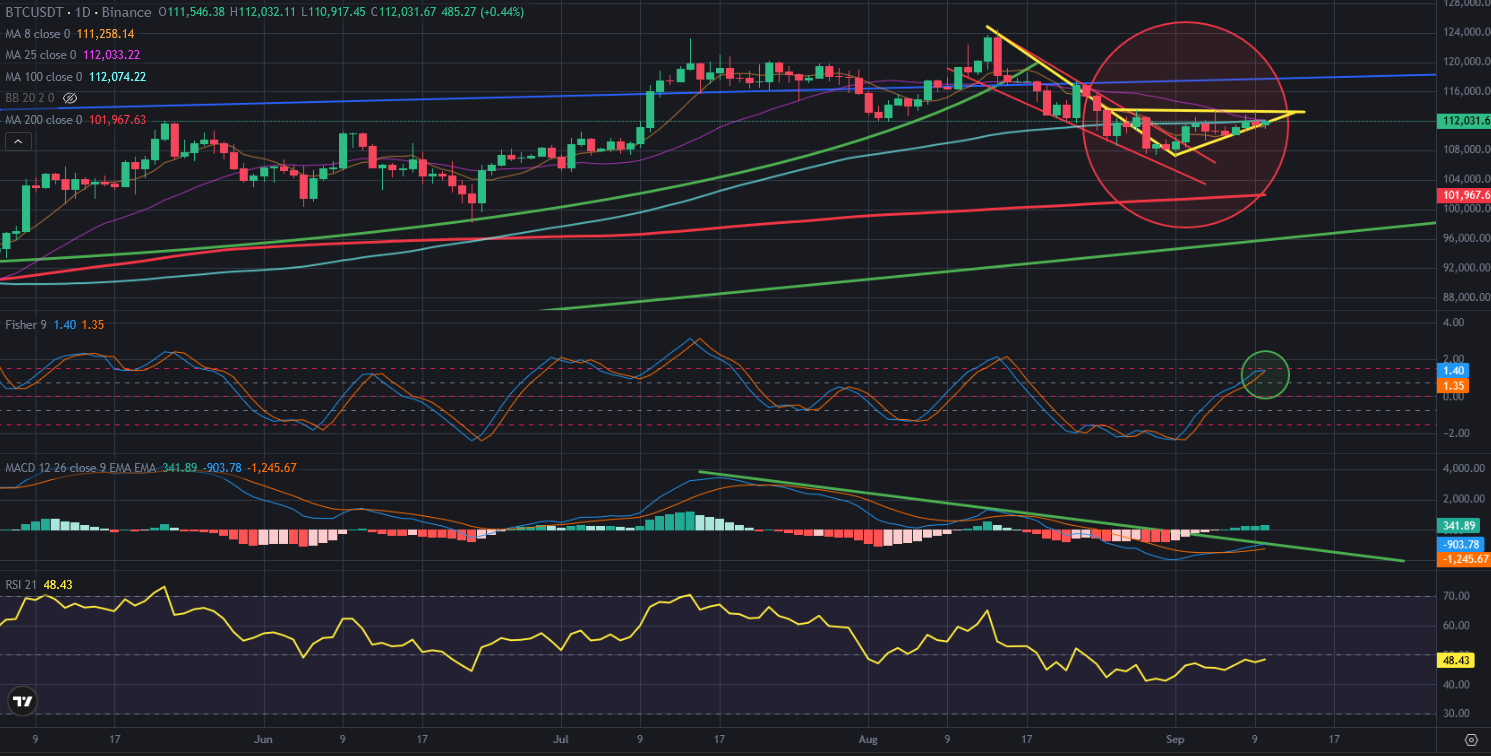
Even Bitcoin price is above 100-day moving average today, I am waiting to see daily close below -day moving average.
We will see..
Posted Using INLEO