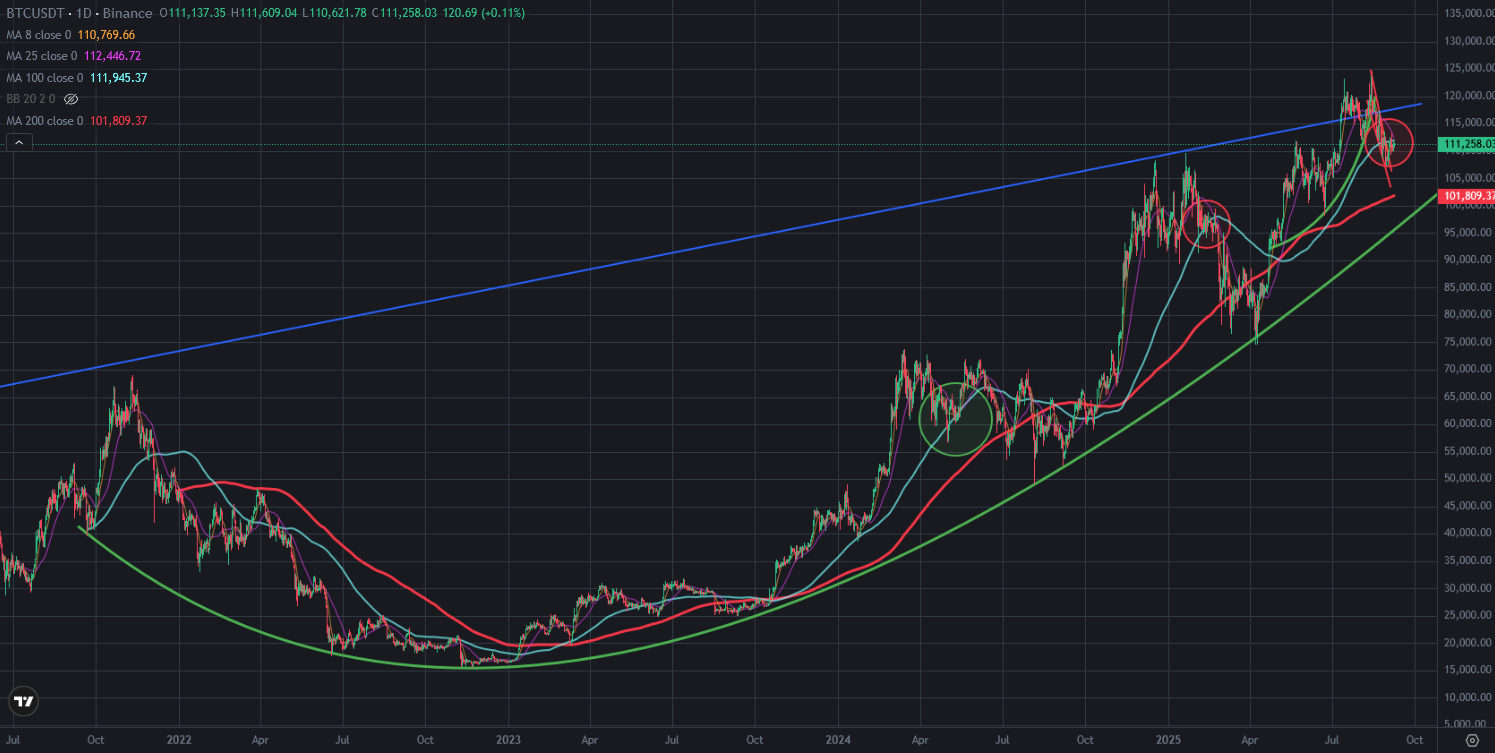
There is great resistance on Bitcoin price chart. After breaking down this resistance, Bitcoin price stuck between 100-day and 200-day moving average. Even Bitcoin price can not break up this resistance, another moving average is going down and it will cross down in a few days
Here you can see daily chart of Bitcoin price. 25-day moving average will cross down 100-day moving average in a few days. You can see what happened after crossing down on these moving averages. We may see another bearish wave on Bitcoin price chart after breaking down 100-day moving average by 25-day moving average.
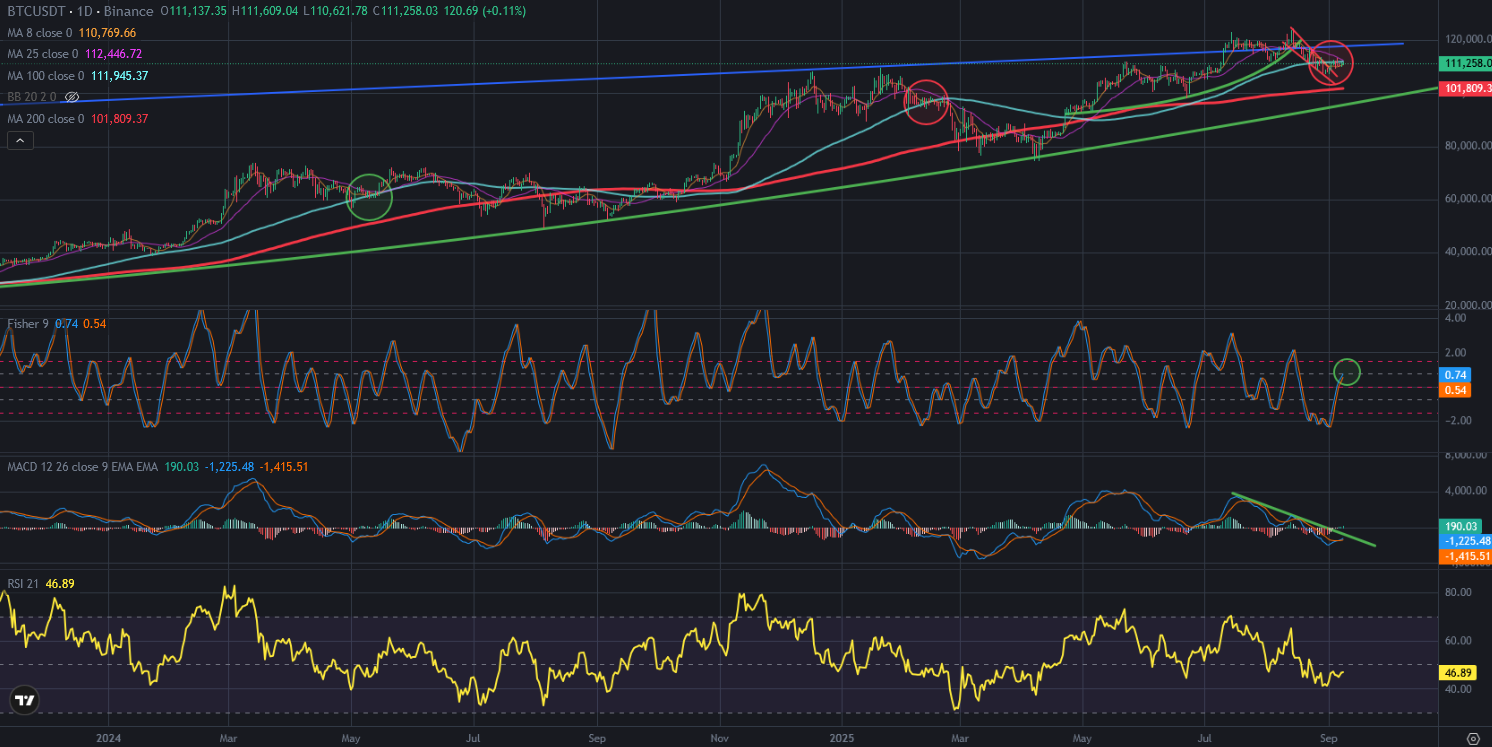
Here you can see the indicators on daily chart of Bitcoin price. There is downtrend line on MACD Indicator. If we see downtrend wave on Bitcoin price chart, MACD Indicator will not break up this downtrend line and This great resistance will resist MACD Indicator.
Fisher Indicator is close to top and It will reverse down when we see downtrend wave on Bitcoin price chart.
So, it is so possible to see another downtrend wave on Bitcoin price chart in this week.
100-day moving average is one of great resistance on Bitcoin price chart. When we look at past, we can see future. 100-day moving average will resist Bitcoin price chart and It will be hard to break up again.
We will see..
Posted Using INLEO