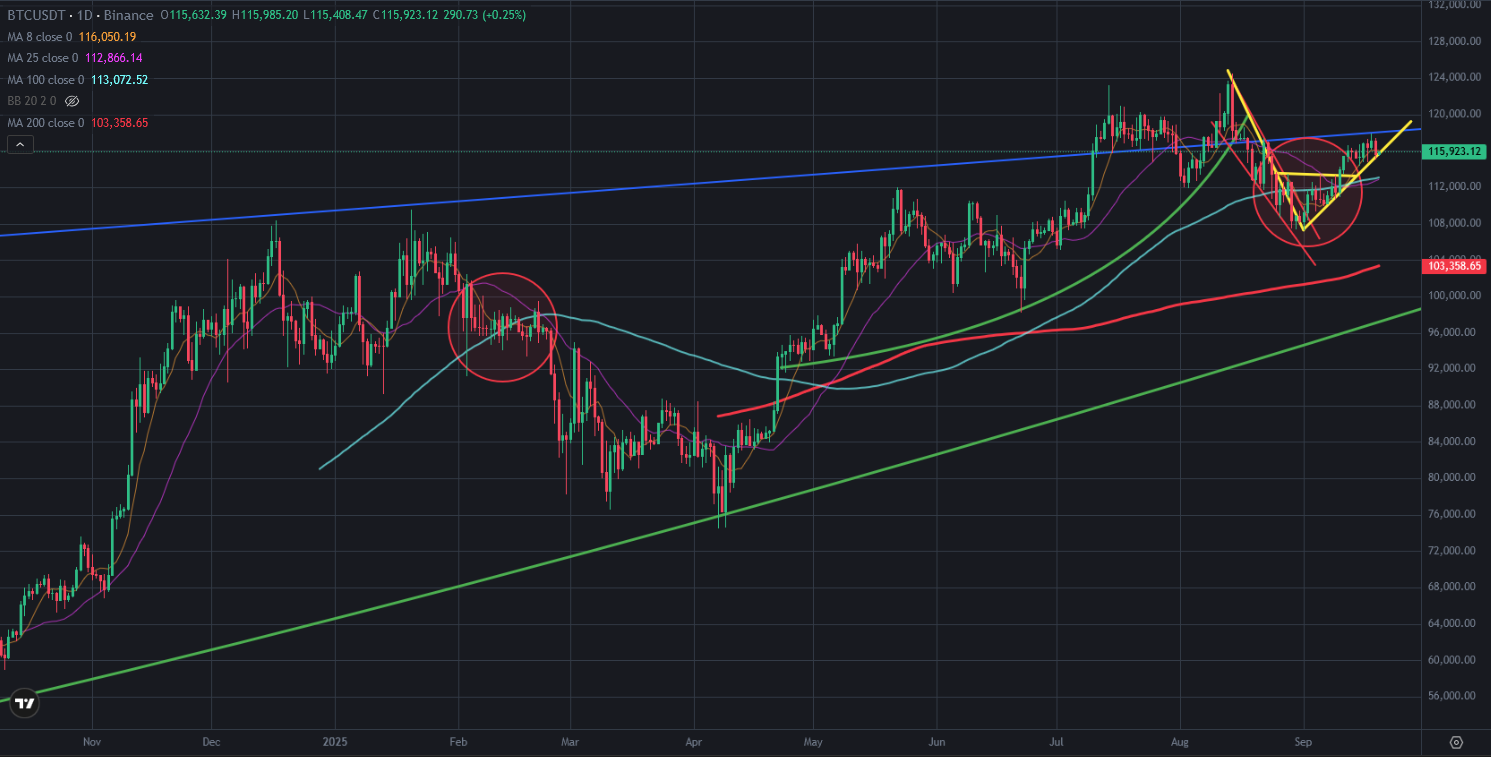
Bitcoin price stuck between great resistance and mini uptrend line. I shared a few analysis about this resistance and support lines. Even Bitcoin price tried to break up great resistance after good news from FOMC meeting, It could not break up. There may not be enough hype to break up this great resistance..
Here you can see daily chart of Bitcoin price. After touching great resistance, Bitcoin price got daily red candle. There is too narrow range on Bitcoin price chart. Bitcoin price touched mini uptrend line after touching great resistance coming from all time high. Bitcoin price is trying to stay above this mini uptrend line.
Even it seemes broken down mini uptrend line, Bitcoin price tried to close the day above this mini uptrend line.
Here you can see the indicators on daily chart of Bitcoin price. Fisher Indicator reversed down from the top. We will see going down on Fisher Indicator.
MACD Indicators will reverse down if we don't see green candles.
RSI Indicator stuck between down and uptrend lines. We will see breaking up or down on this indicator. After daily close yesterday, RSI Indicator touched uptrend line. If we see a daily red candle, we will see breaking down on RSI Indicator. It will be the proof of price correction.
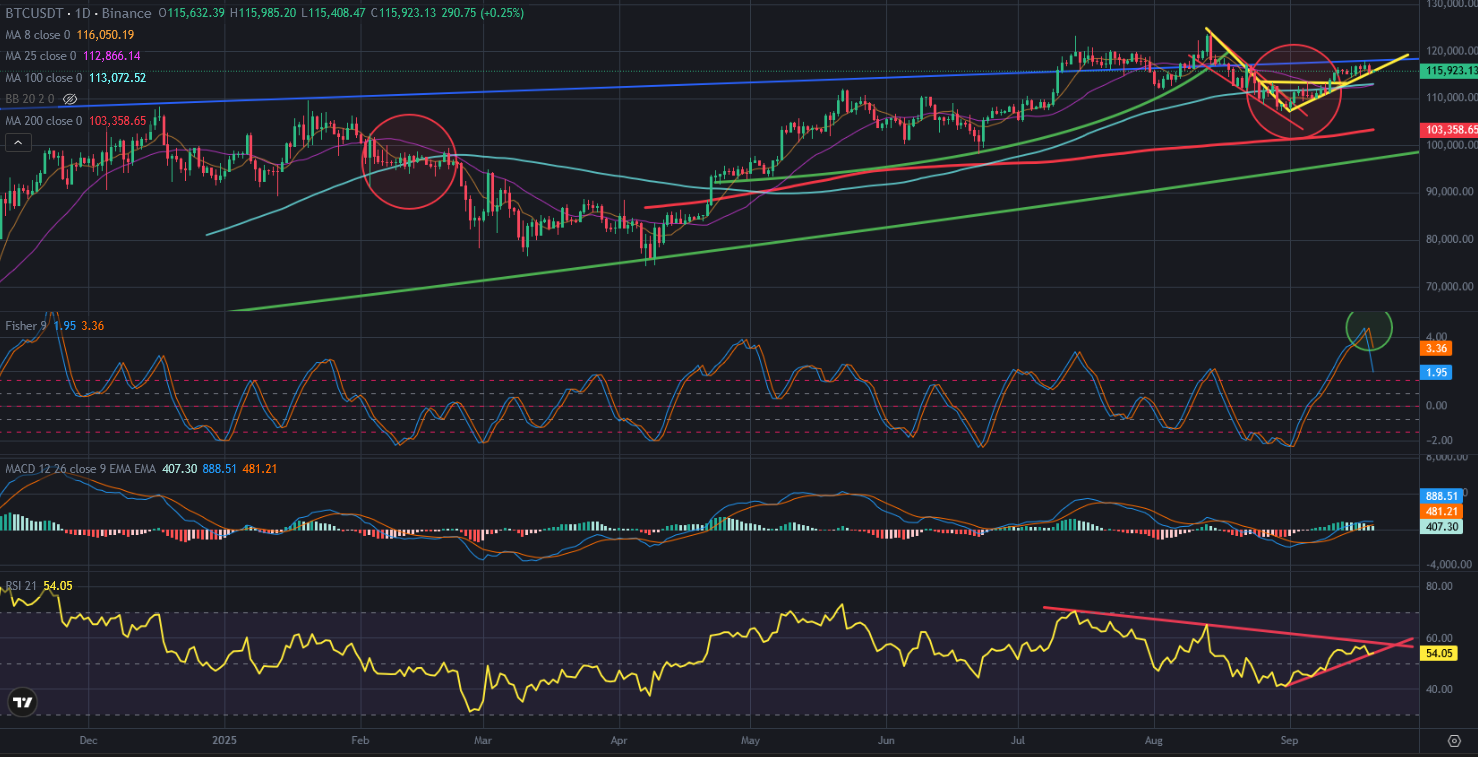
So, it is more possible to be breaking down the indicators on minim uptrend line on Bitcoin price chart. We should be careful in this week.
I am also waiting big pump or big dump on Bitcoin price chart until 24th September.
We will see..
Posted Using INLEO