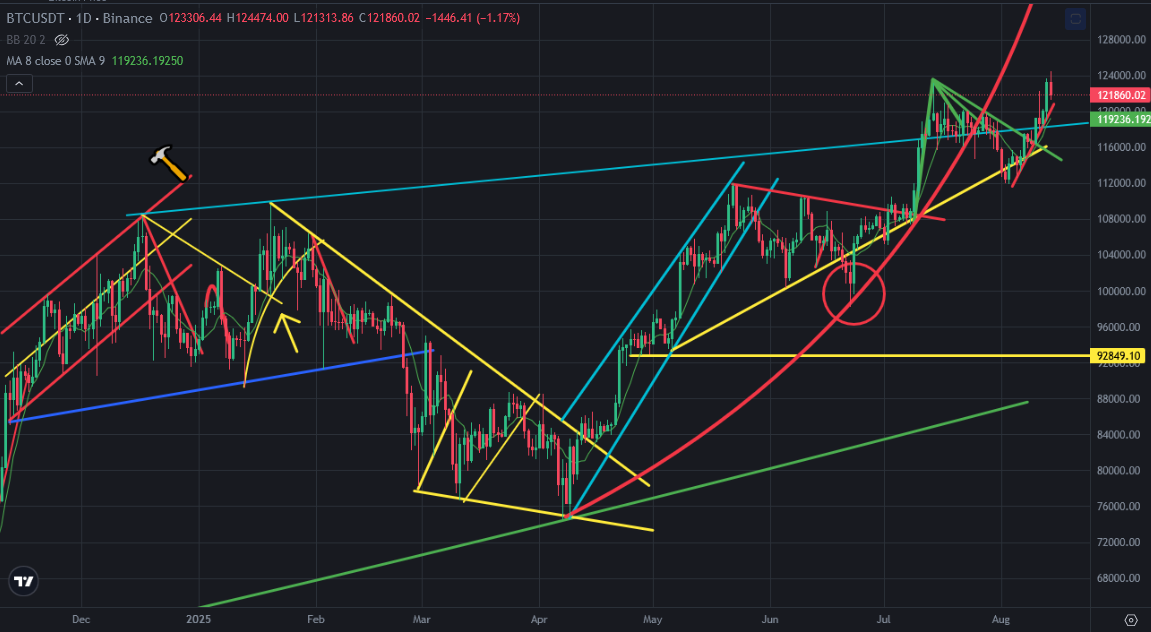
Bitcoin price is going up slowly. Even it gets huge daily green candle, we can see red daily candle after this green day. Bitcoin price is close to uptrend line. This is the main support for Bitcoin price chart.
Here you can see daily chart of Bitcoin. After breaking down parabolic uptrend line, Bitcoin price supported by linear mini uptrend line. We have not seen going up closely mini uptrend line in this year. We have seen uptrend channel.
It is linear uptrend line and Bitcoin price is close to this support. We should be careful about this move. If we see 2 daily red candle, we may see breaking down on mini uptrend line.
Here you can see the indicators on daily chart of Bitcoin price. Bitcoin price destroyed all mini downtrend lines on the indicators. If we see reversing down from this level, There will be negative divergence on daily RSI Indicator. It is only major reason for bearish scenario.
MACD Indicator reversed up from the bottom. We may see going up until great resistance on this indicator.
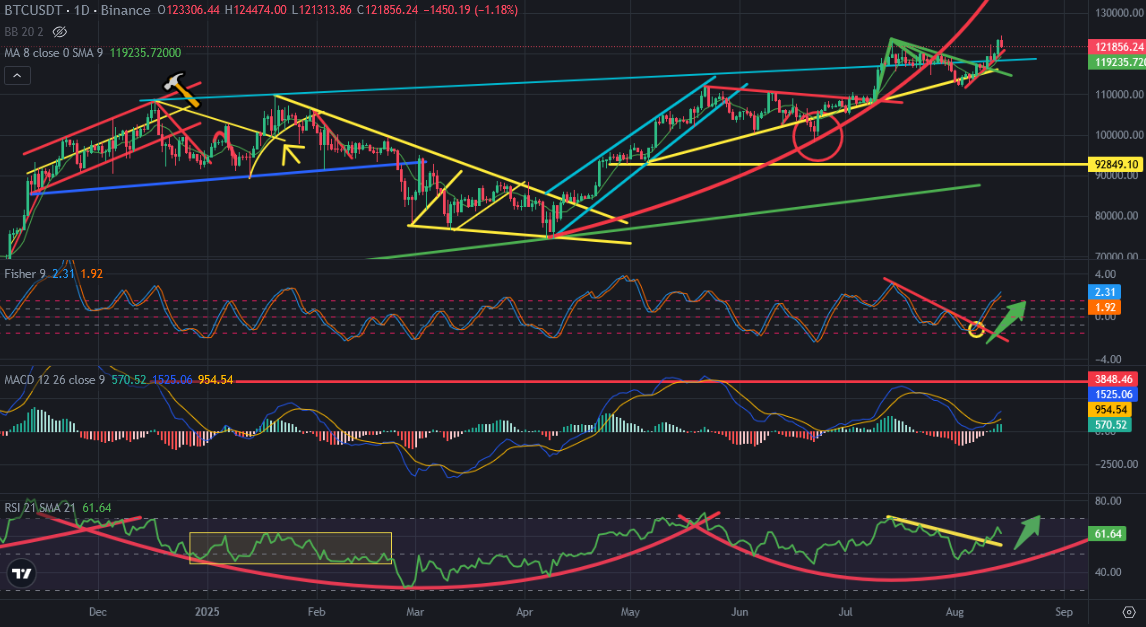
Even it seems bullish, we should be careful for possible price correction on Bitcoin price chart. Because Bitcoin price is going up slowly and it is close to mini uptrend line.
We will see..
Posted Using INLEO