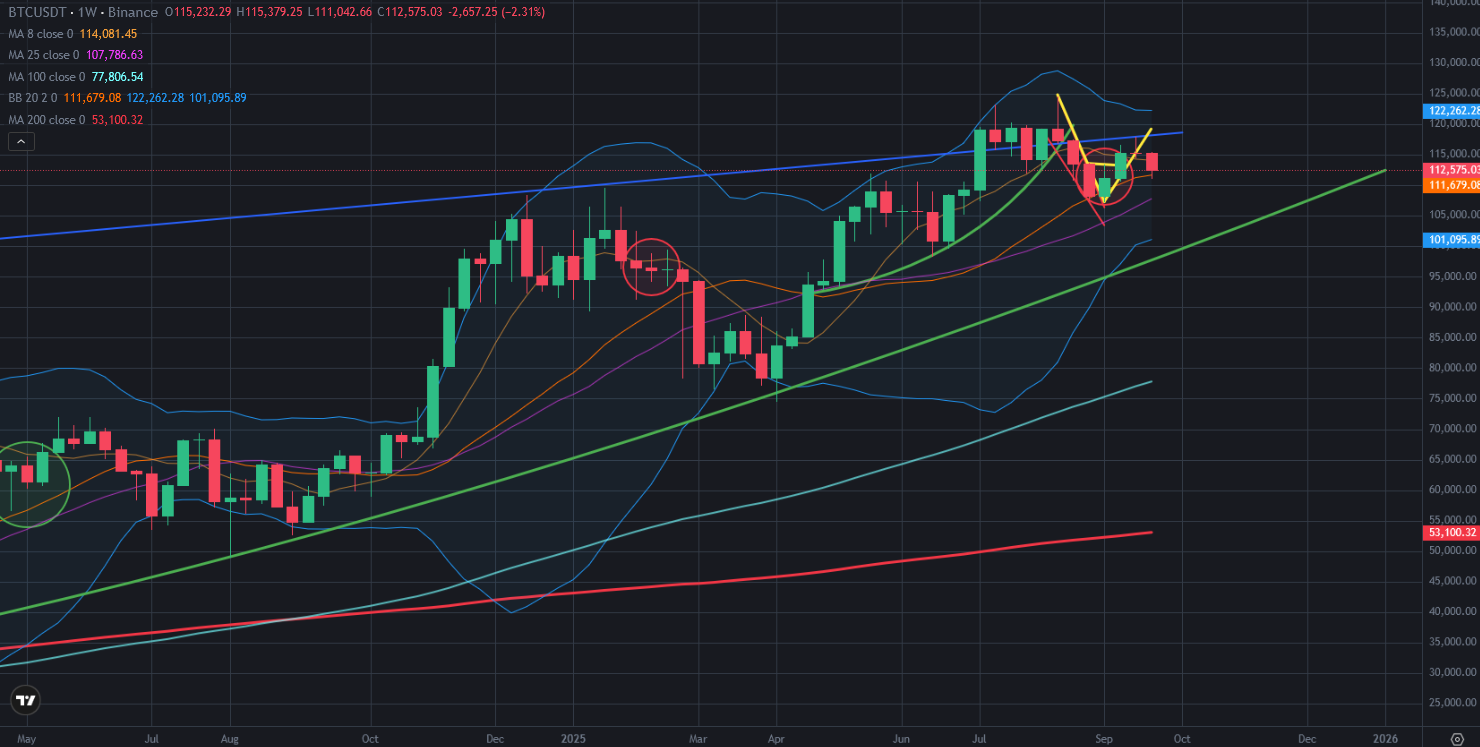
This is 2nd week that Bitcoin price got weekly red candles. It is great signal for us to see midterm trend. Even Bitcoin price got price correction in last 2 weeks, it is still above the middle line of Bollinger Bands
Here you can see weekly chart of Bitcoin price. Bitcoin price is trying to stay above great support level. You can see what happened before when Bitcoin price broke down the middle line of Bollinger Bands. Bitcoin price went down to the bottom line of Bollinger Bands when it broke down. It is always possible to see same scenario. We should be careful.
Even there is bearish scenario on Bitcoin price chart the indicators are showing us the preparation on bullrun. Here you can see weekly chart of Bitcoin price and the indicators. There is great resistance on RSI Indicator. When it is broken up, we will see parabolic pumps on Bitcoin price chart. MACD Indicators is trying to reverse up. Fisher Indicator is on the middle level.
The most impartant pattern is on RSI Indicator. We may see breaking up on this indicators in a few weeks. When it breaks up, we should fasten the belts.
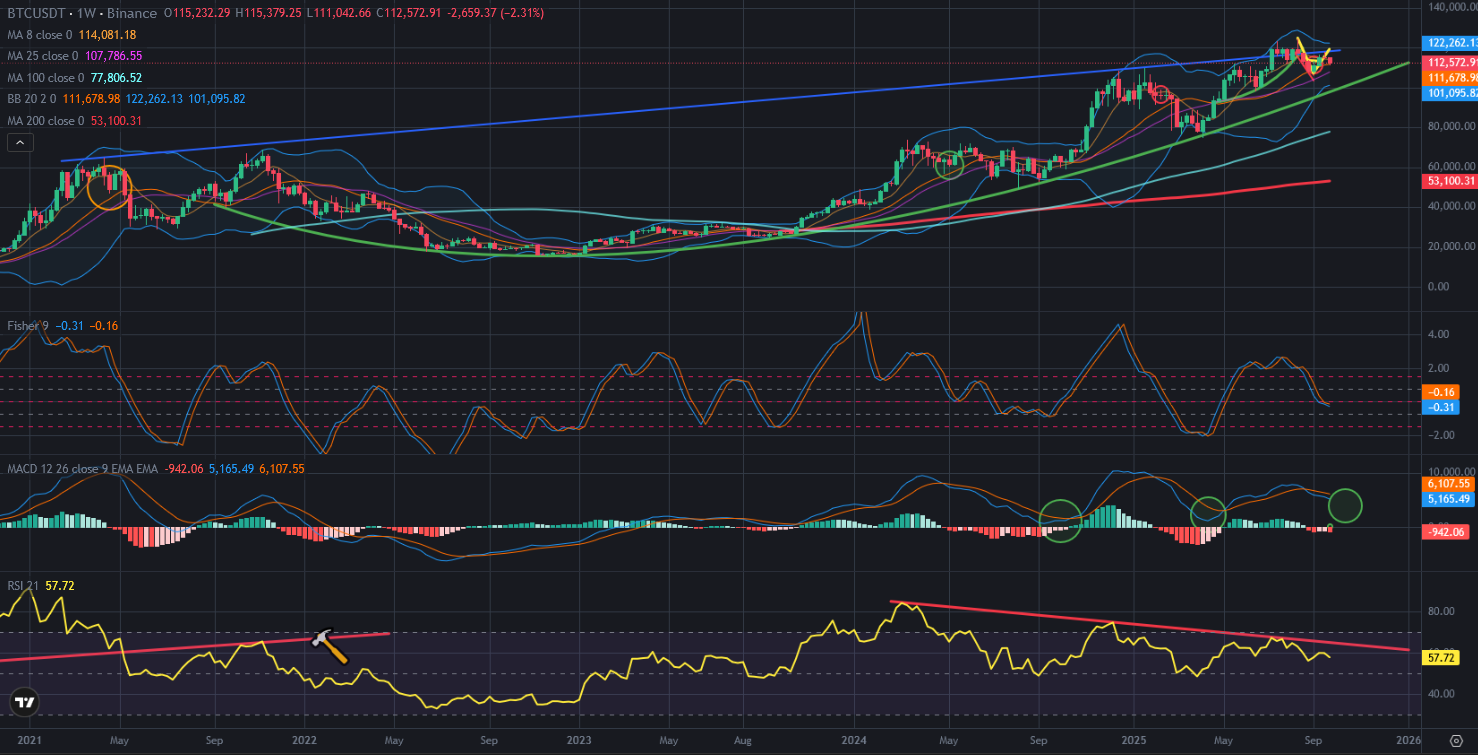
Even there is bearish moves on Bitcoin price chart, There is great bullish pattern on weekly chart of Bitcoin price. We should follow RSI Indicator on weekly chart of Bitcoin to see breaking up great resistance.
We will see..
Posted Using INLEO