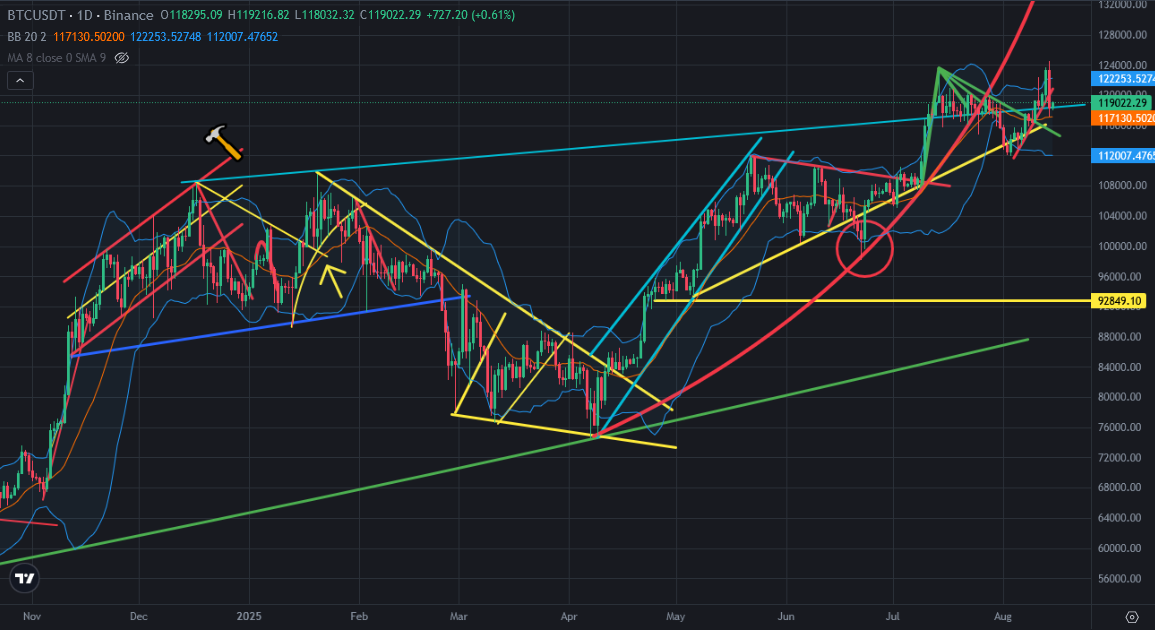
There was mini uptrend line on Bitcoin price chart. I shared a few analysis about this mini uptrend line. I was possible to see breaking down on this mini uptrend line and It happened yesterday. Bitcoin price supported by great support line coming from all time high levels.
Here you can see daily chart of Bitcoin price. There was parablolic uptrend line, It is broken down. There was linear mini uptrend line, It is broken down. The middle line of Bollinger Bands also supported Bitcoin price while going down. So, 117K USD level is great support level for Bitcoin price chart.
Here you can see the indicators on daily chart of Bitcoin price. Even MACD Indicator reversed up from the bottom, we have seen same scenario before. We may see reversing down on MACD Indicator again. Because Fisher Indicator is on the top and reversed down.
Even RSI Indicator broke up mini downtrend line, It reversed down. There is great bowl pattern on RSI Indicator. We may see touching the bottom of this great bowl pattern.
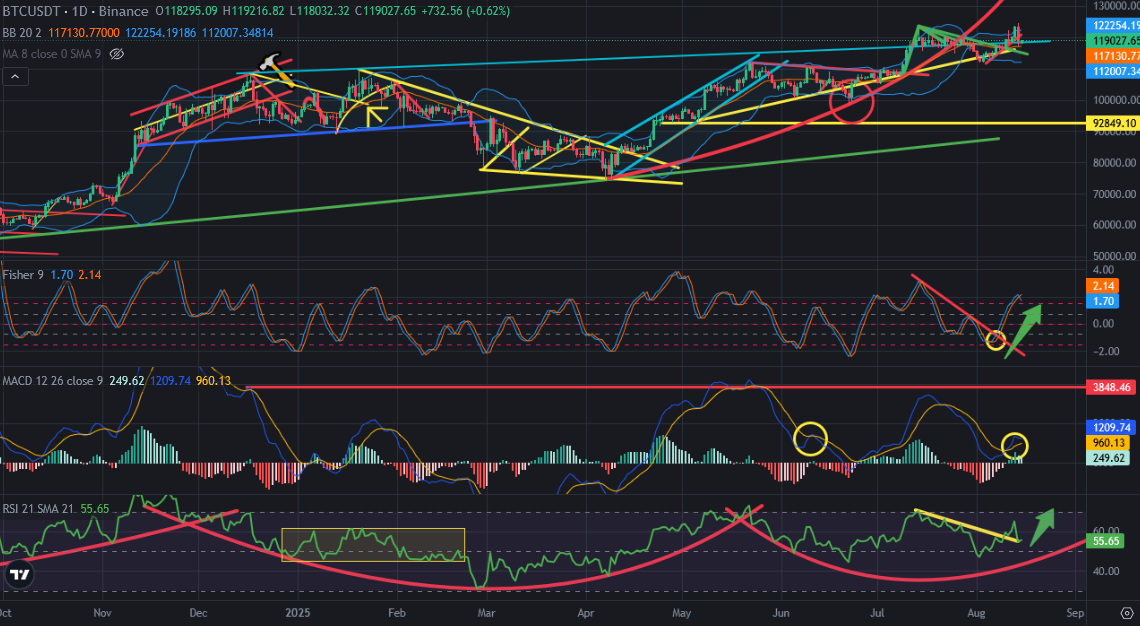
So, we may see price correction on Bitcoin price chart and crypto market in this month. I am waiting price correction at the end of this month. The bottom level may be the touching bowl pattern on RSI Indicator.
We will see..
Posted Using INLEO