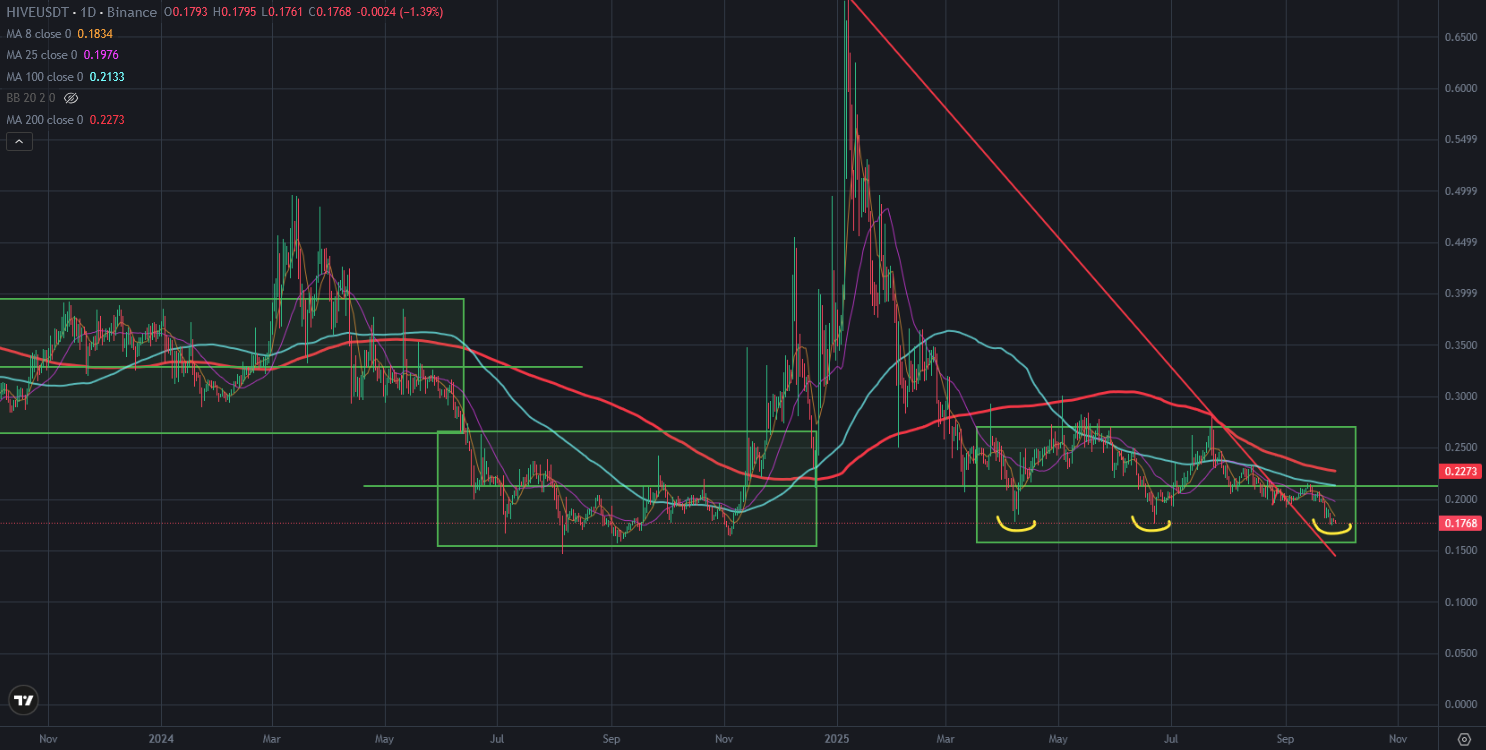
There is great bottom pattern on Hive price chart. Triple Bottom Pattern appears on Hive price chart. Hive price went down from 0,70 USD to 0,17 USD in this year. We have seen Hive price touching 0,17 USD for 3 times in this year. There may be great bottom level for Hive price chart. Because Hive price reversed up after touching 0,17 USD..
Here you can see daily chart of Hive price and my draft. I shared this draft a few years ago and It worked as well. Hive price was in depression zone. Even Hive price broke down the middle line of this depression zone, It reversed down at past. It may be possible to see same reversing up on Hive price chart. I drew the similarities of reversing up on Hive price chart. I hope we will see the same reversing up on Hive price chart.
Here you can see the indicators on daily chart of Hive price. Fisher Indicator is on the bottom and trying to reverse up. MACD Indicator is also trying to reverse up. Even RSI Indicator broke up downtrend line, Hive price could not go up. It is a bearish trend signal on Hive price chart. Even bearish signals are on Hive price chart, it may be great level to pick up discounted Hive.
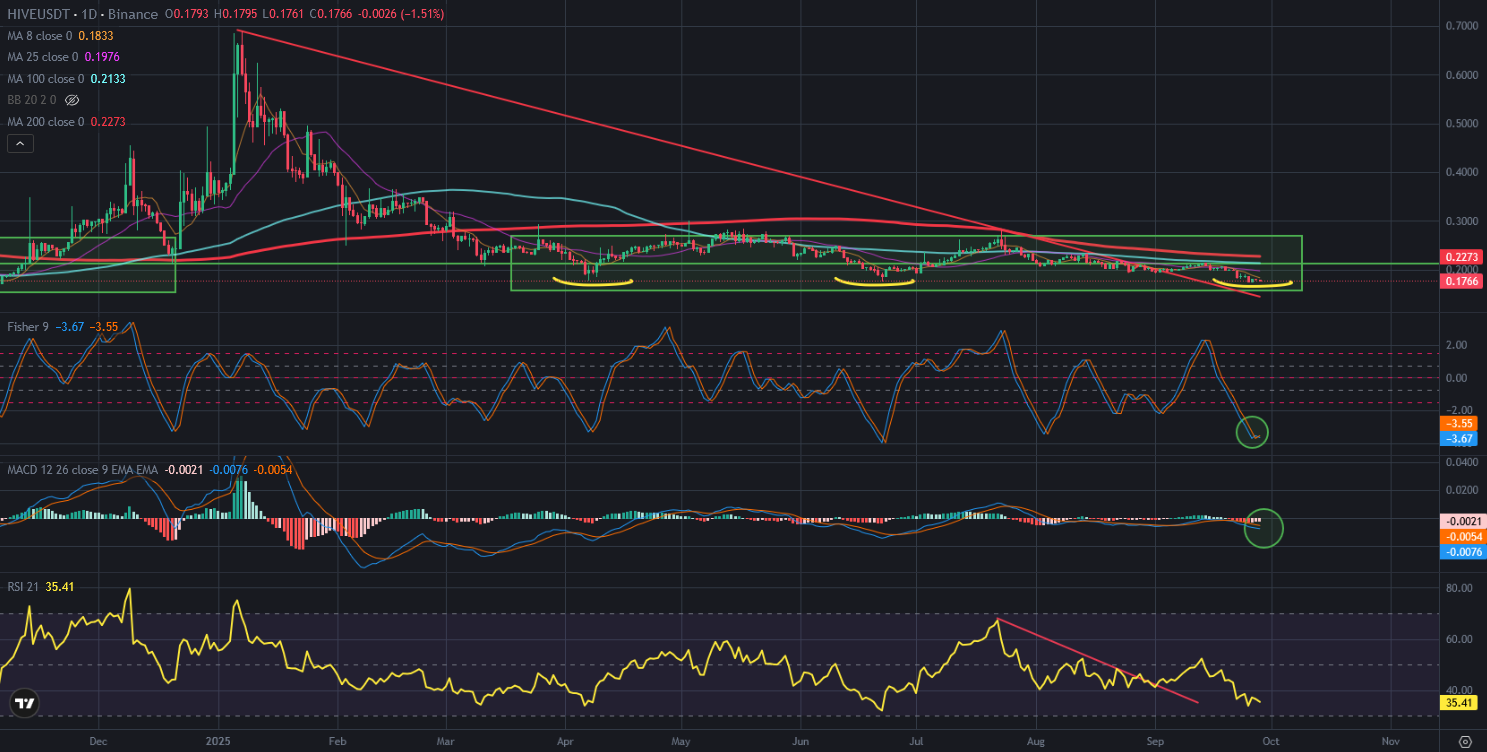
Hive price marketcap is below 100M USD. This is why I say for Hive price is discounted. Indicators are on the bottom in daily chart. It may be great level and time to pick up.
We will see..
Posted Using INLEO