English [🇺🇸]
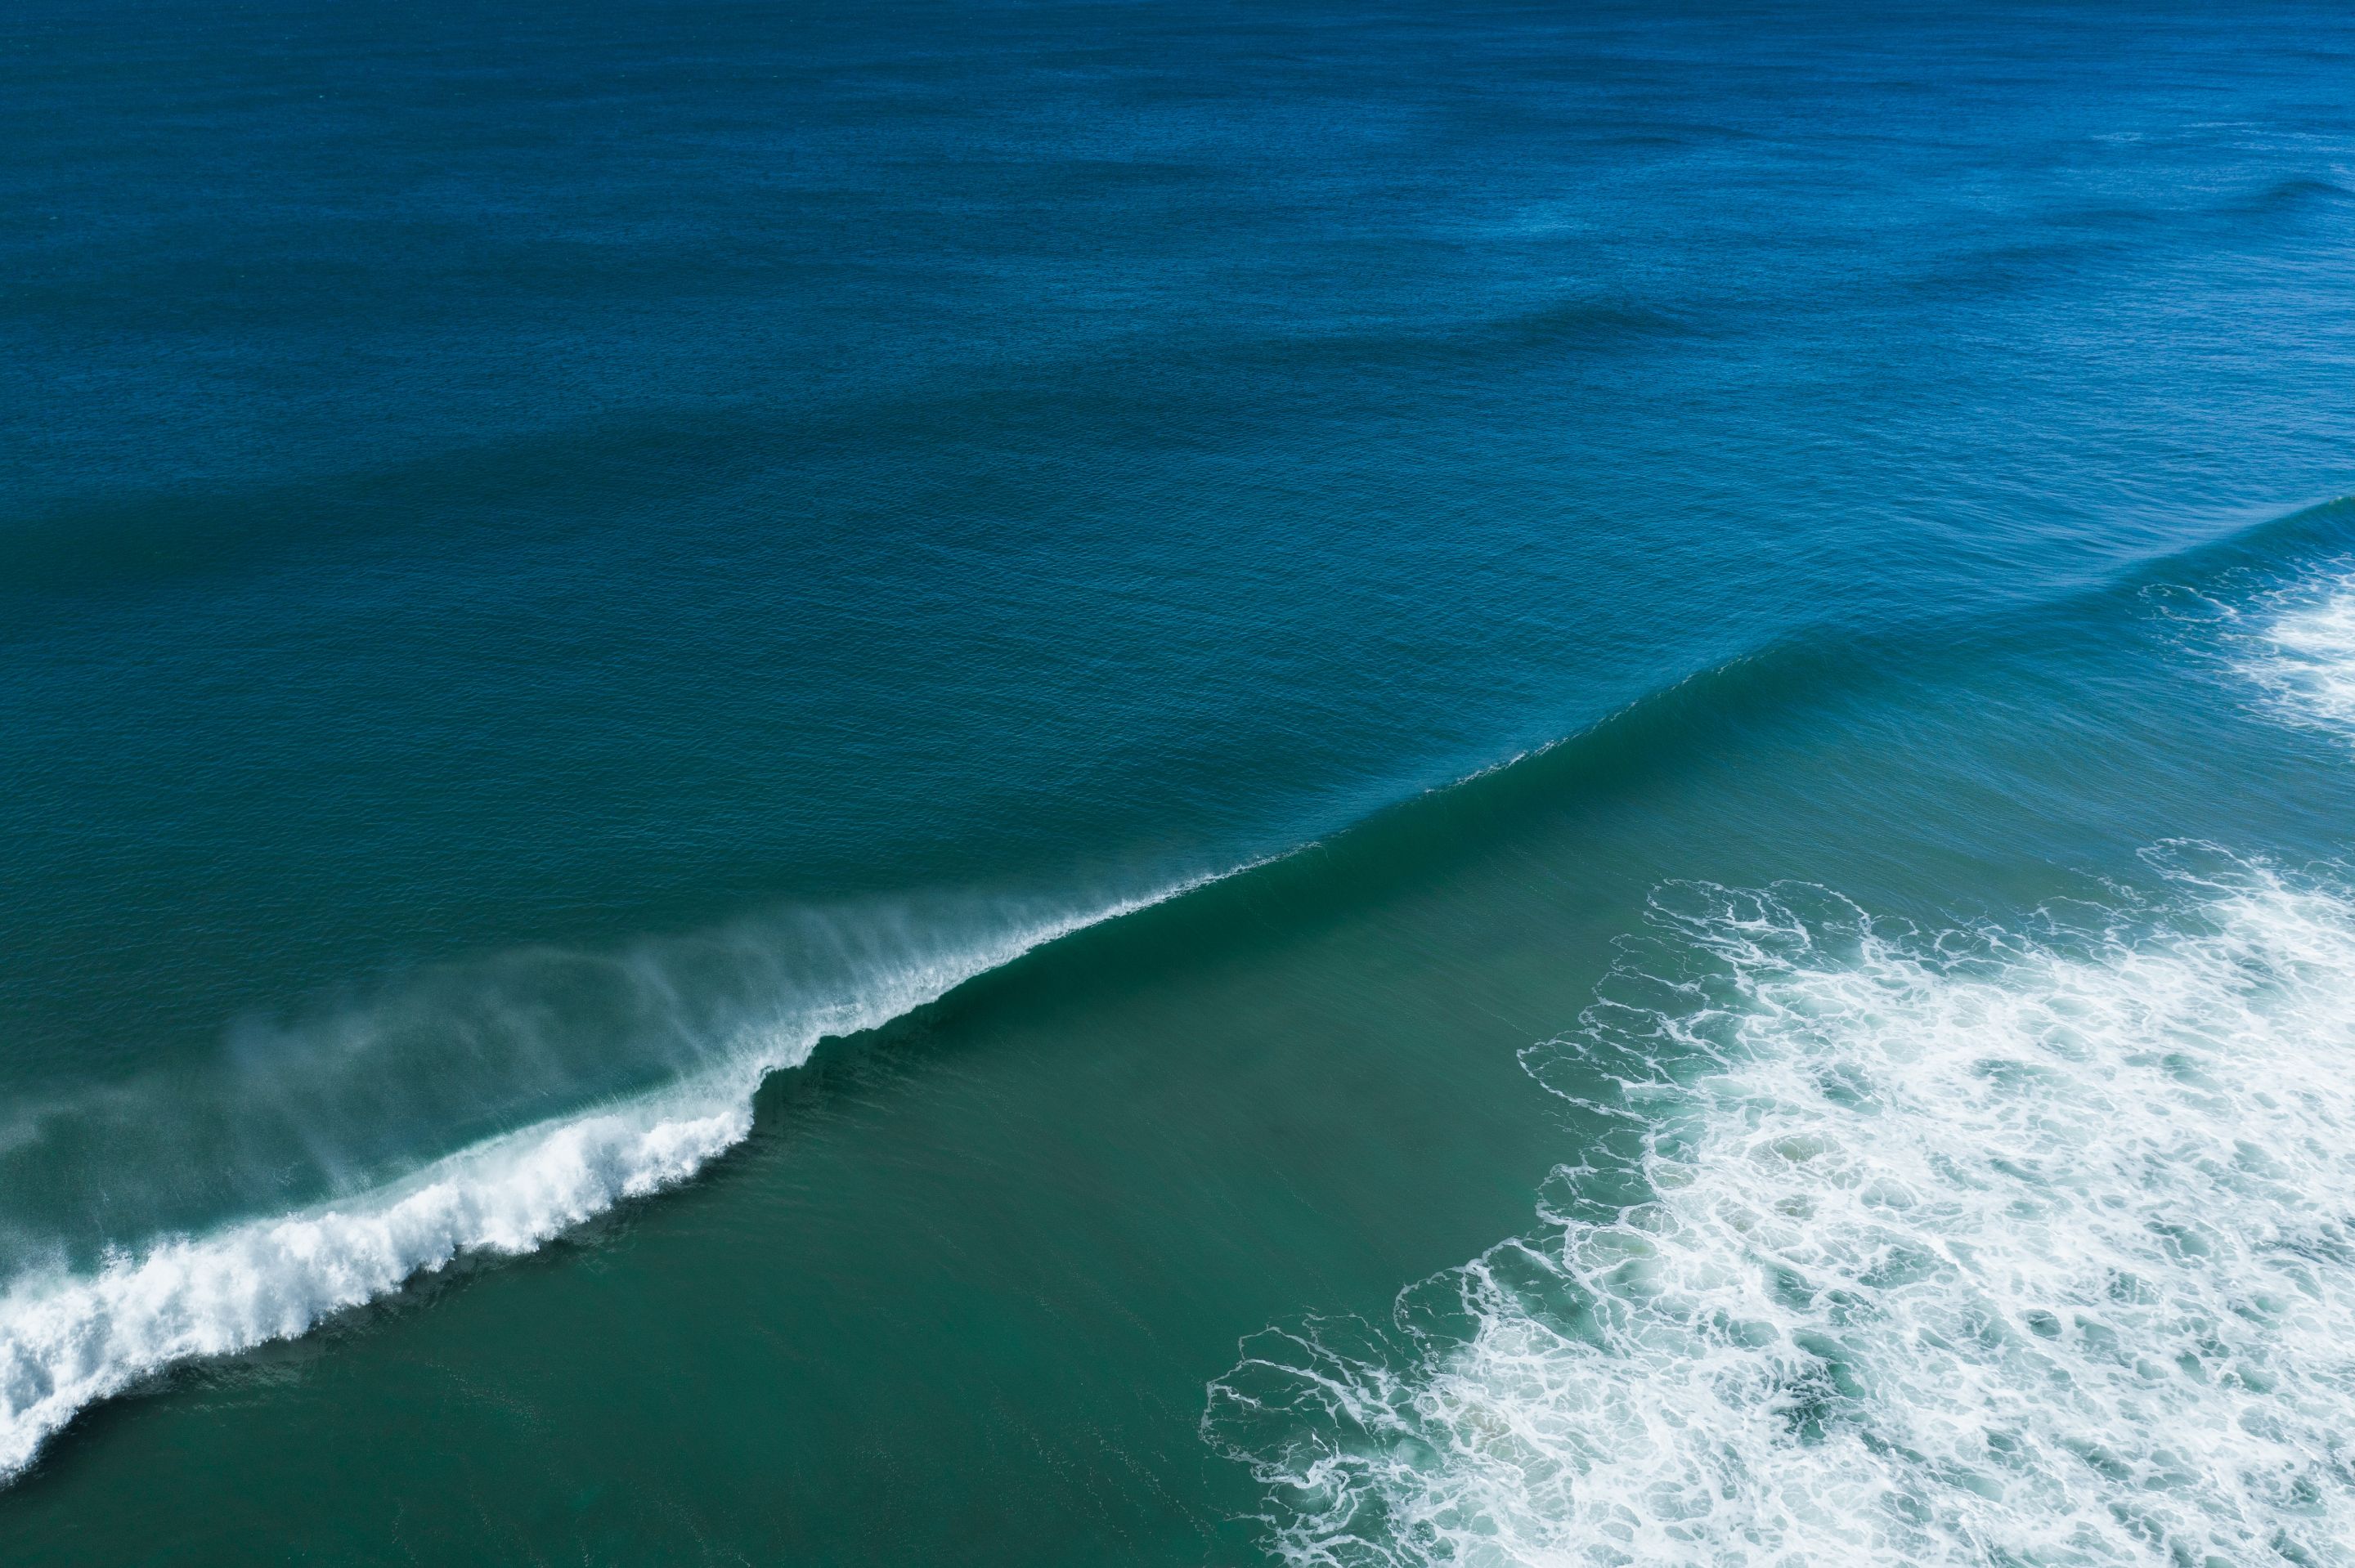 Photo by Ben Mack (Pexels)
Have you ever arrived at the beach, super excited to surf, got there, and the sea was horrible? Yeah, who never went through this, huh? So, I created this post for you to learn how to read wave forecasts, program yourself for surfing (or any other activity at sea that you will practice), and avoid making any more mistakes! Remembering that, I will explain how I see it and what I think is essential to analyze!
Understanding and knowing how to read the wave forecast depends on the combination of several factors together, which are: - wave height - direction of swell - swell period - energy and power - wind direction - get to know the spot where you are going to surf
All these factors are super important, and I'll talk about each one of them here. For this, I will teach you how to read the wave forecast through the Surfguru website @surfgurupro, which currently offers the most complete information regarding wave forecasts in Brazil. And remember that all the instructions here are for you to access the site by phone. For those who read everything, there is a special surprise at the end of the post.
And a tip: I've already explained here how waves are formed, and if you haven't read this post yet, it can help you better understand some of the things I will discuss here.
🌊 Identifying swells in the ocean
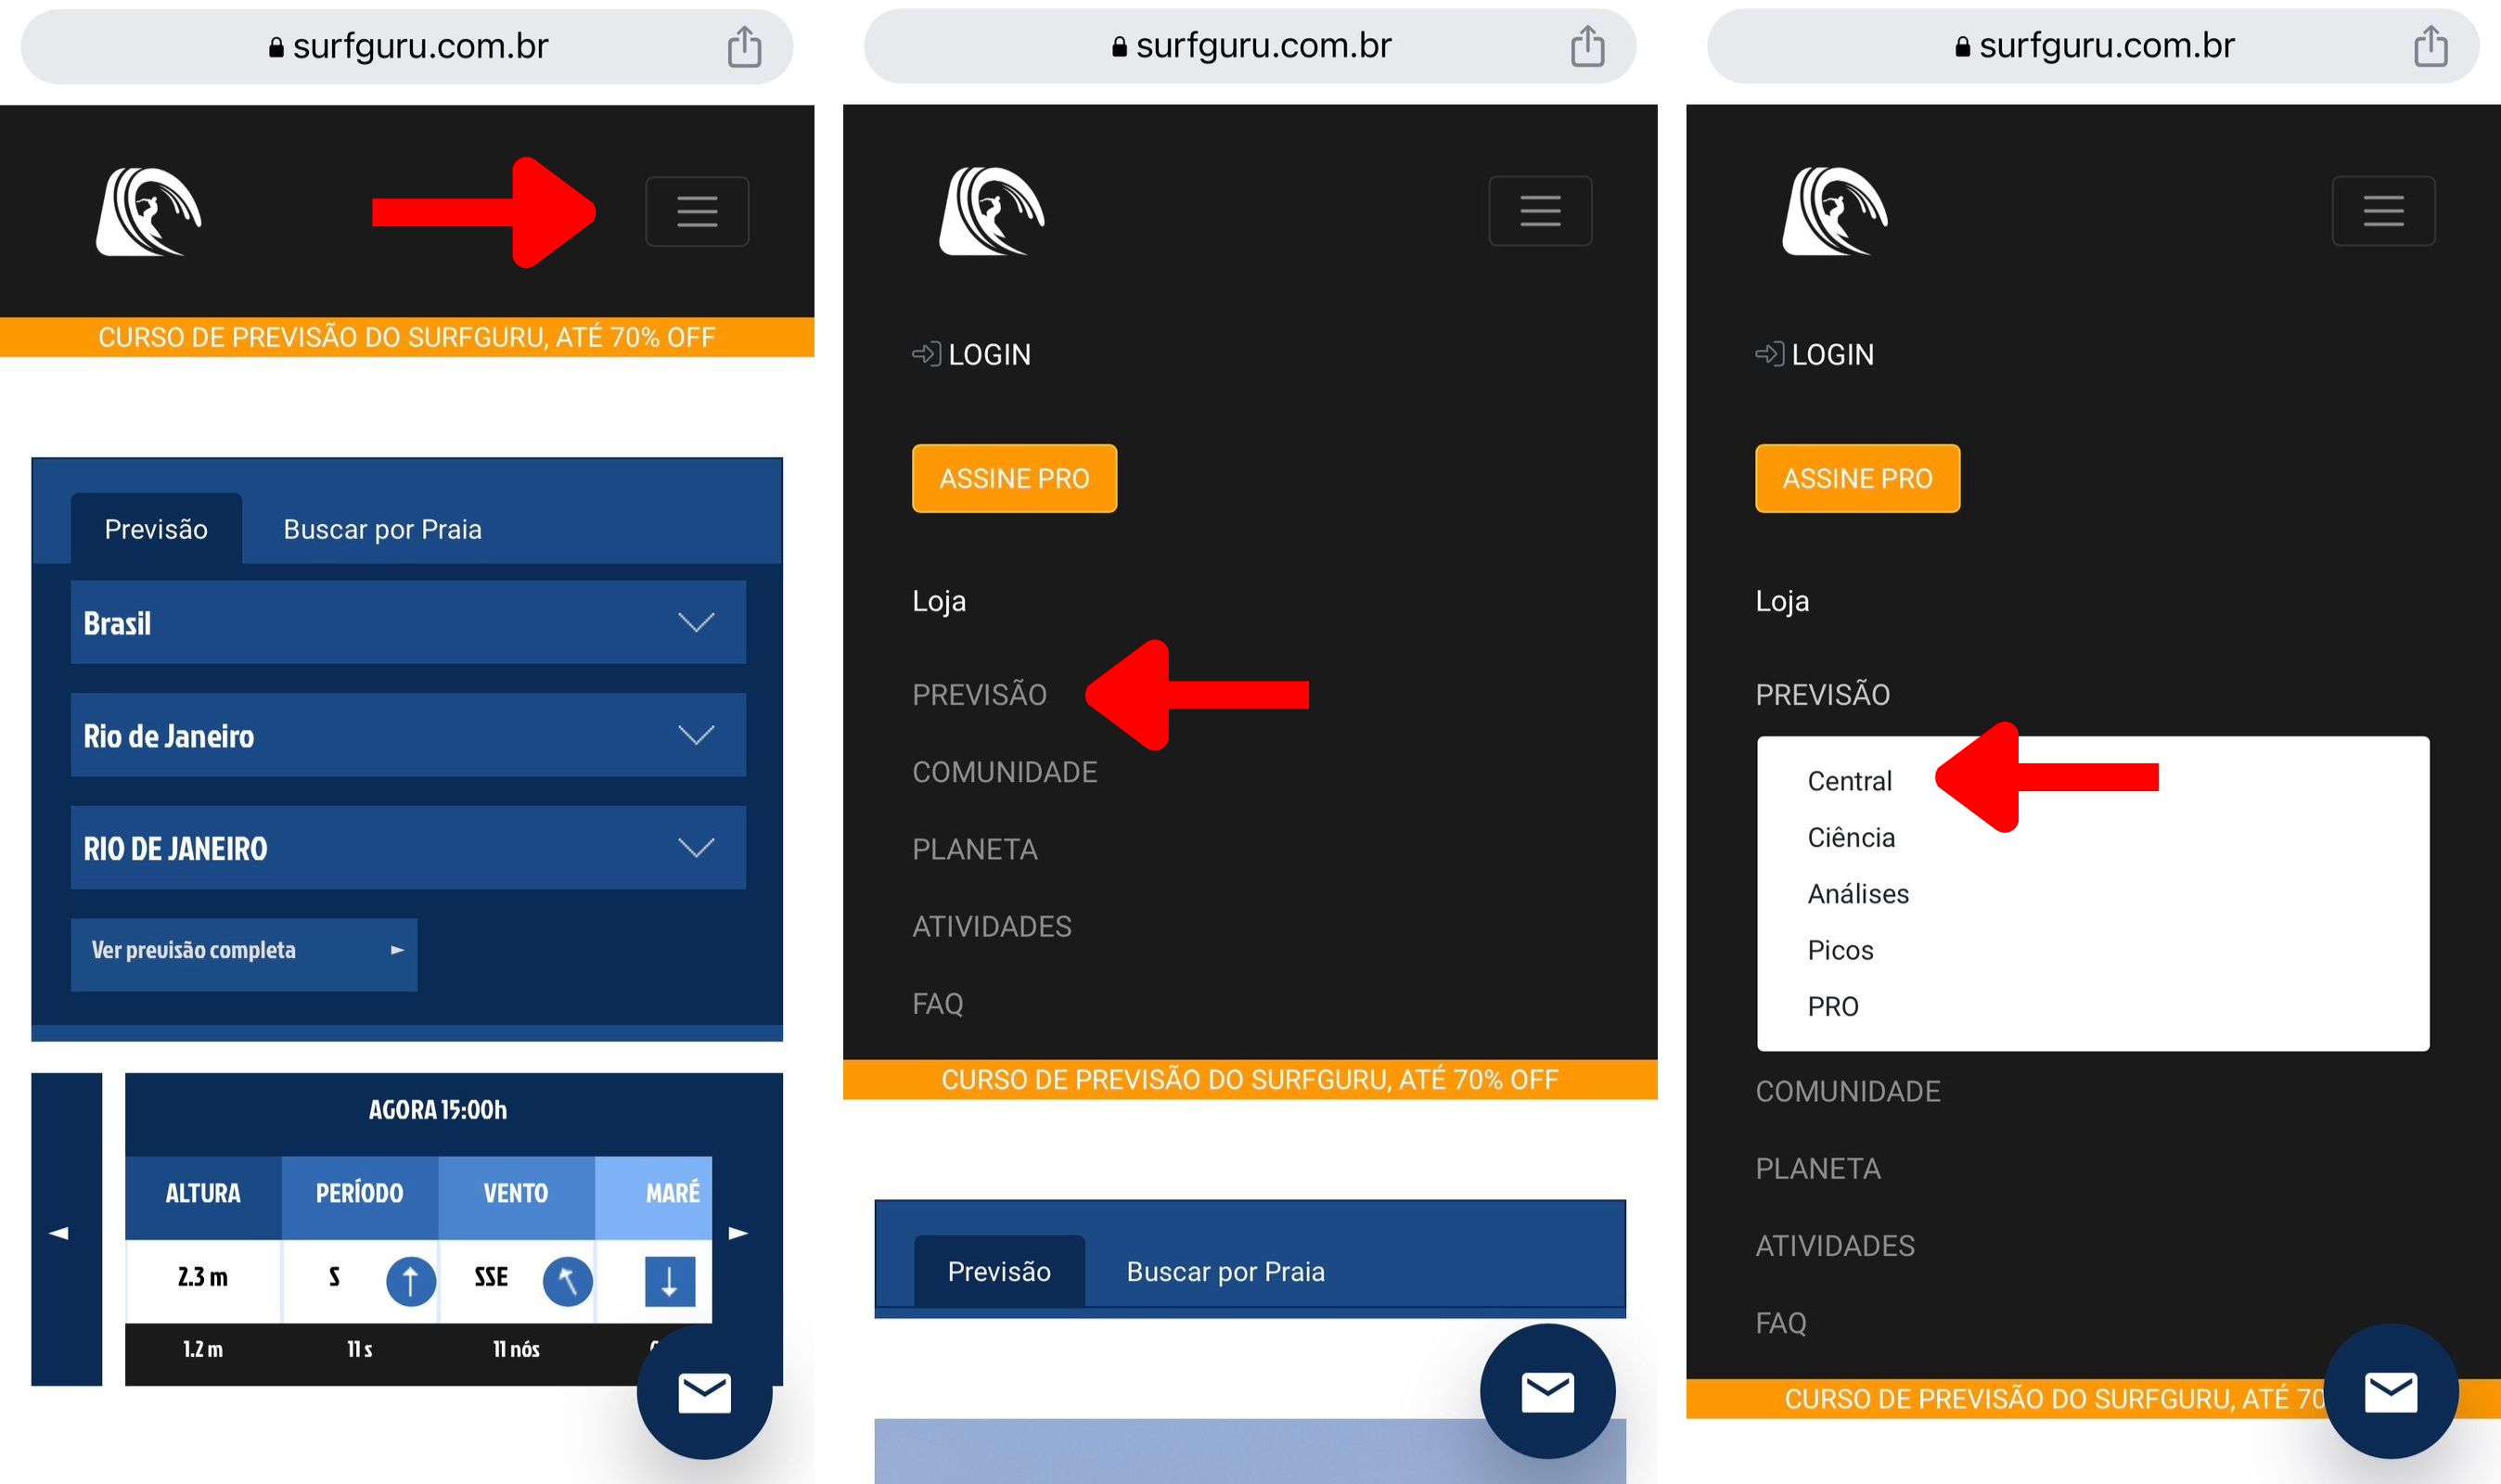
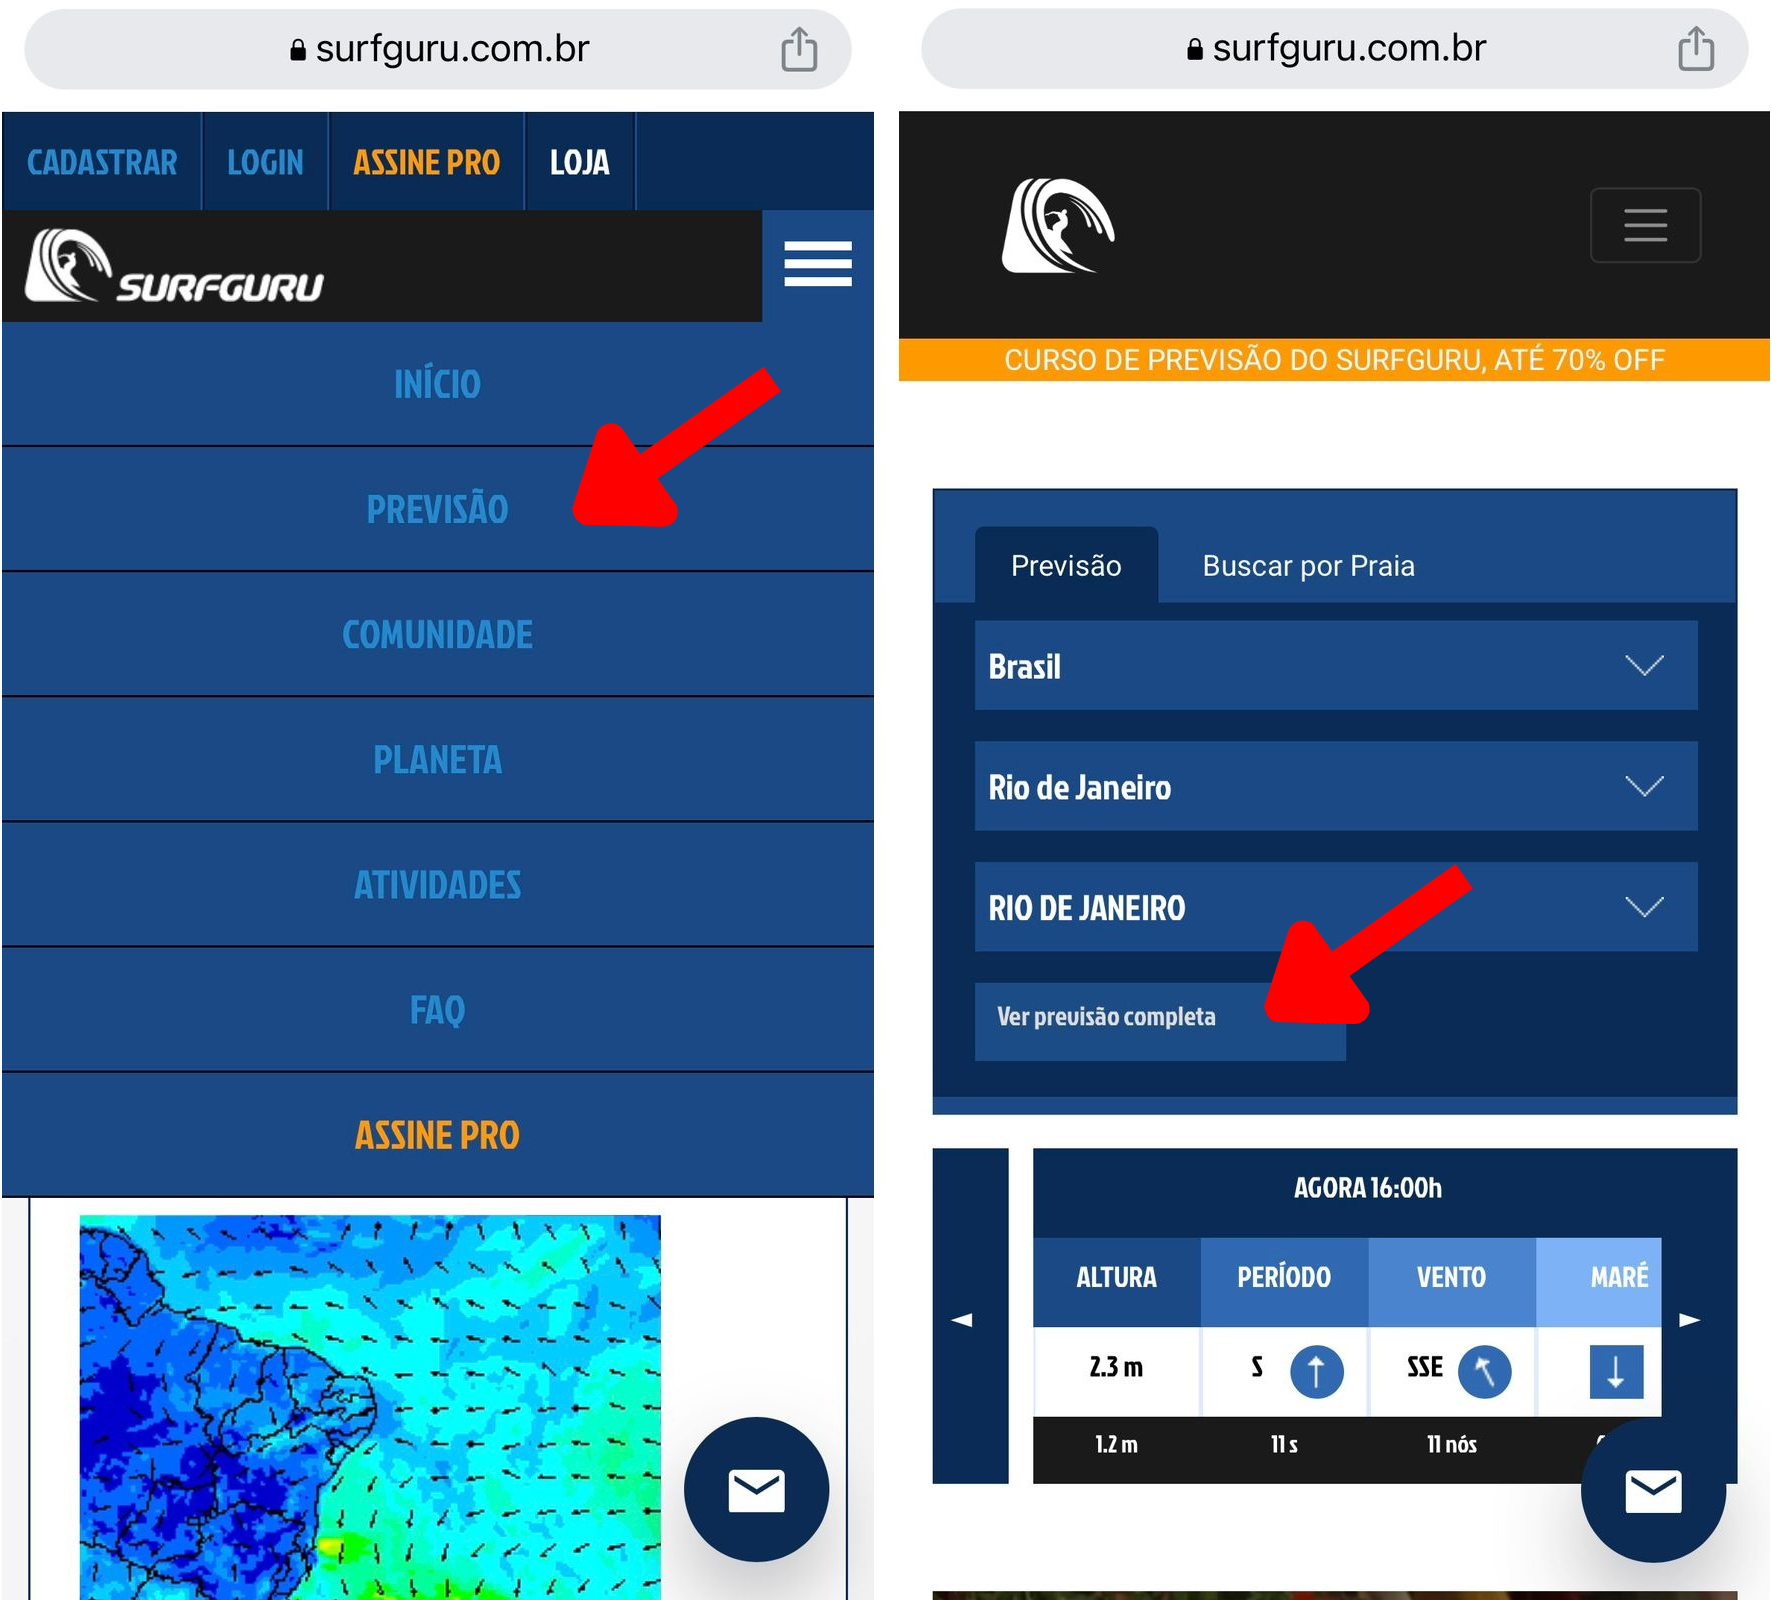
First, let's briefly understand how things happen in the open sea before reaching the coast. To get started, go to www.surfguru.com.br and click on the three dashes on the upper right side of the page, click "Previsão" (Forecast), and then "Central".
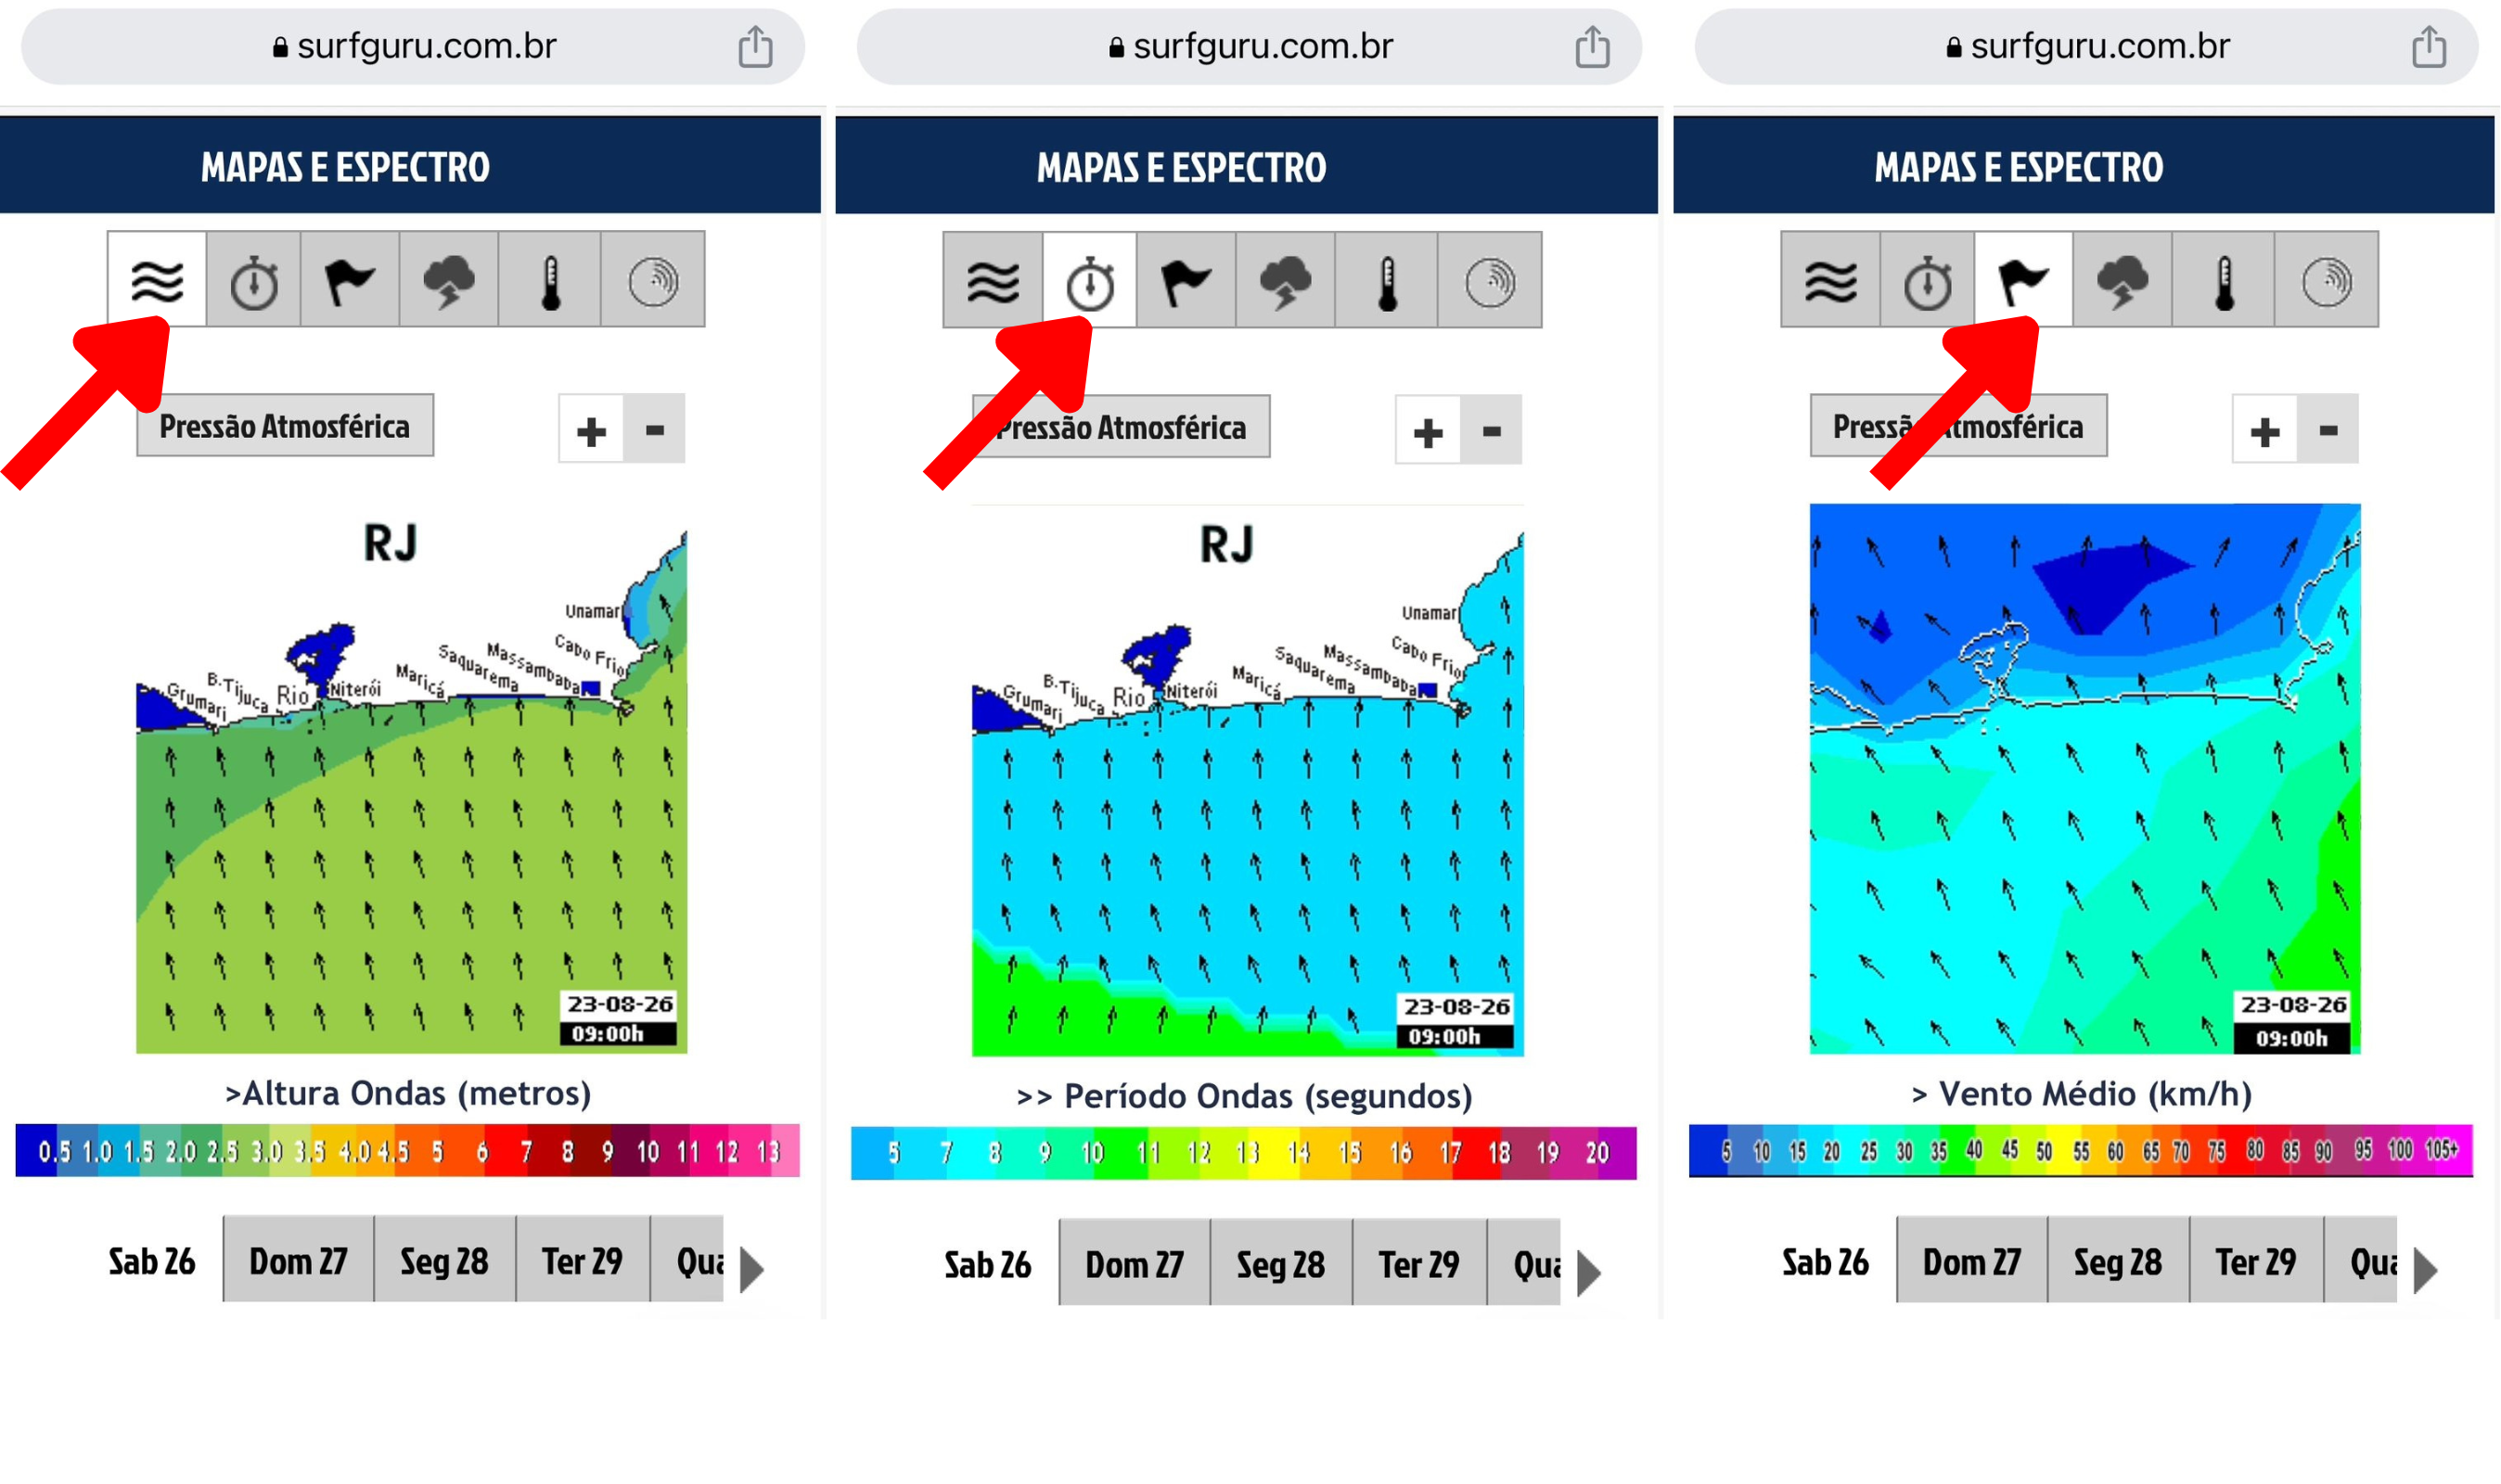
Soon, it will open the forecast for Brazil (if you are in Brazil) and show the map of Brazil and the Atlantic Ocean represented with a color scheme. On the icons above the map, you have the option to see: - the height of waves: three-wave icon - the period: clock icon - the direction of the winds: flag icon
And below the map, dragging the scroll bar to the right, you can see the forecast for the next few days.
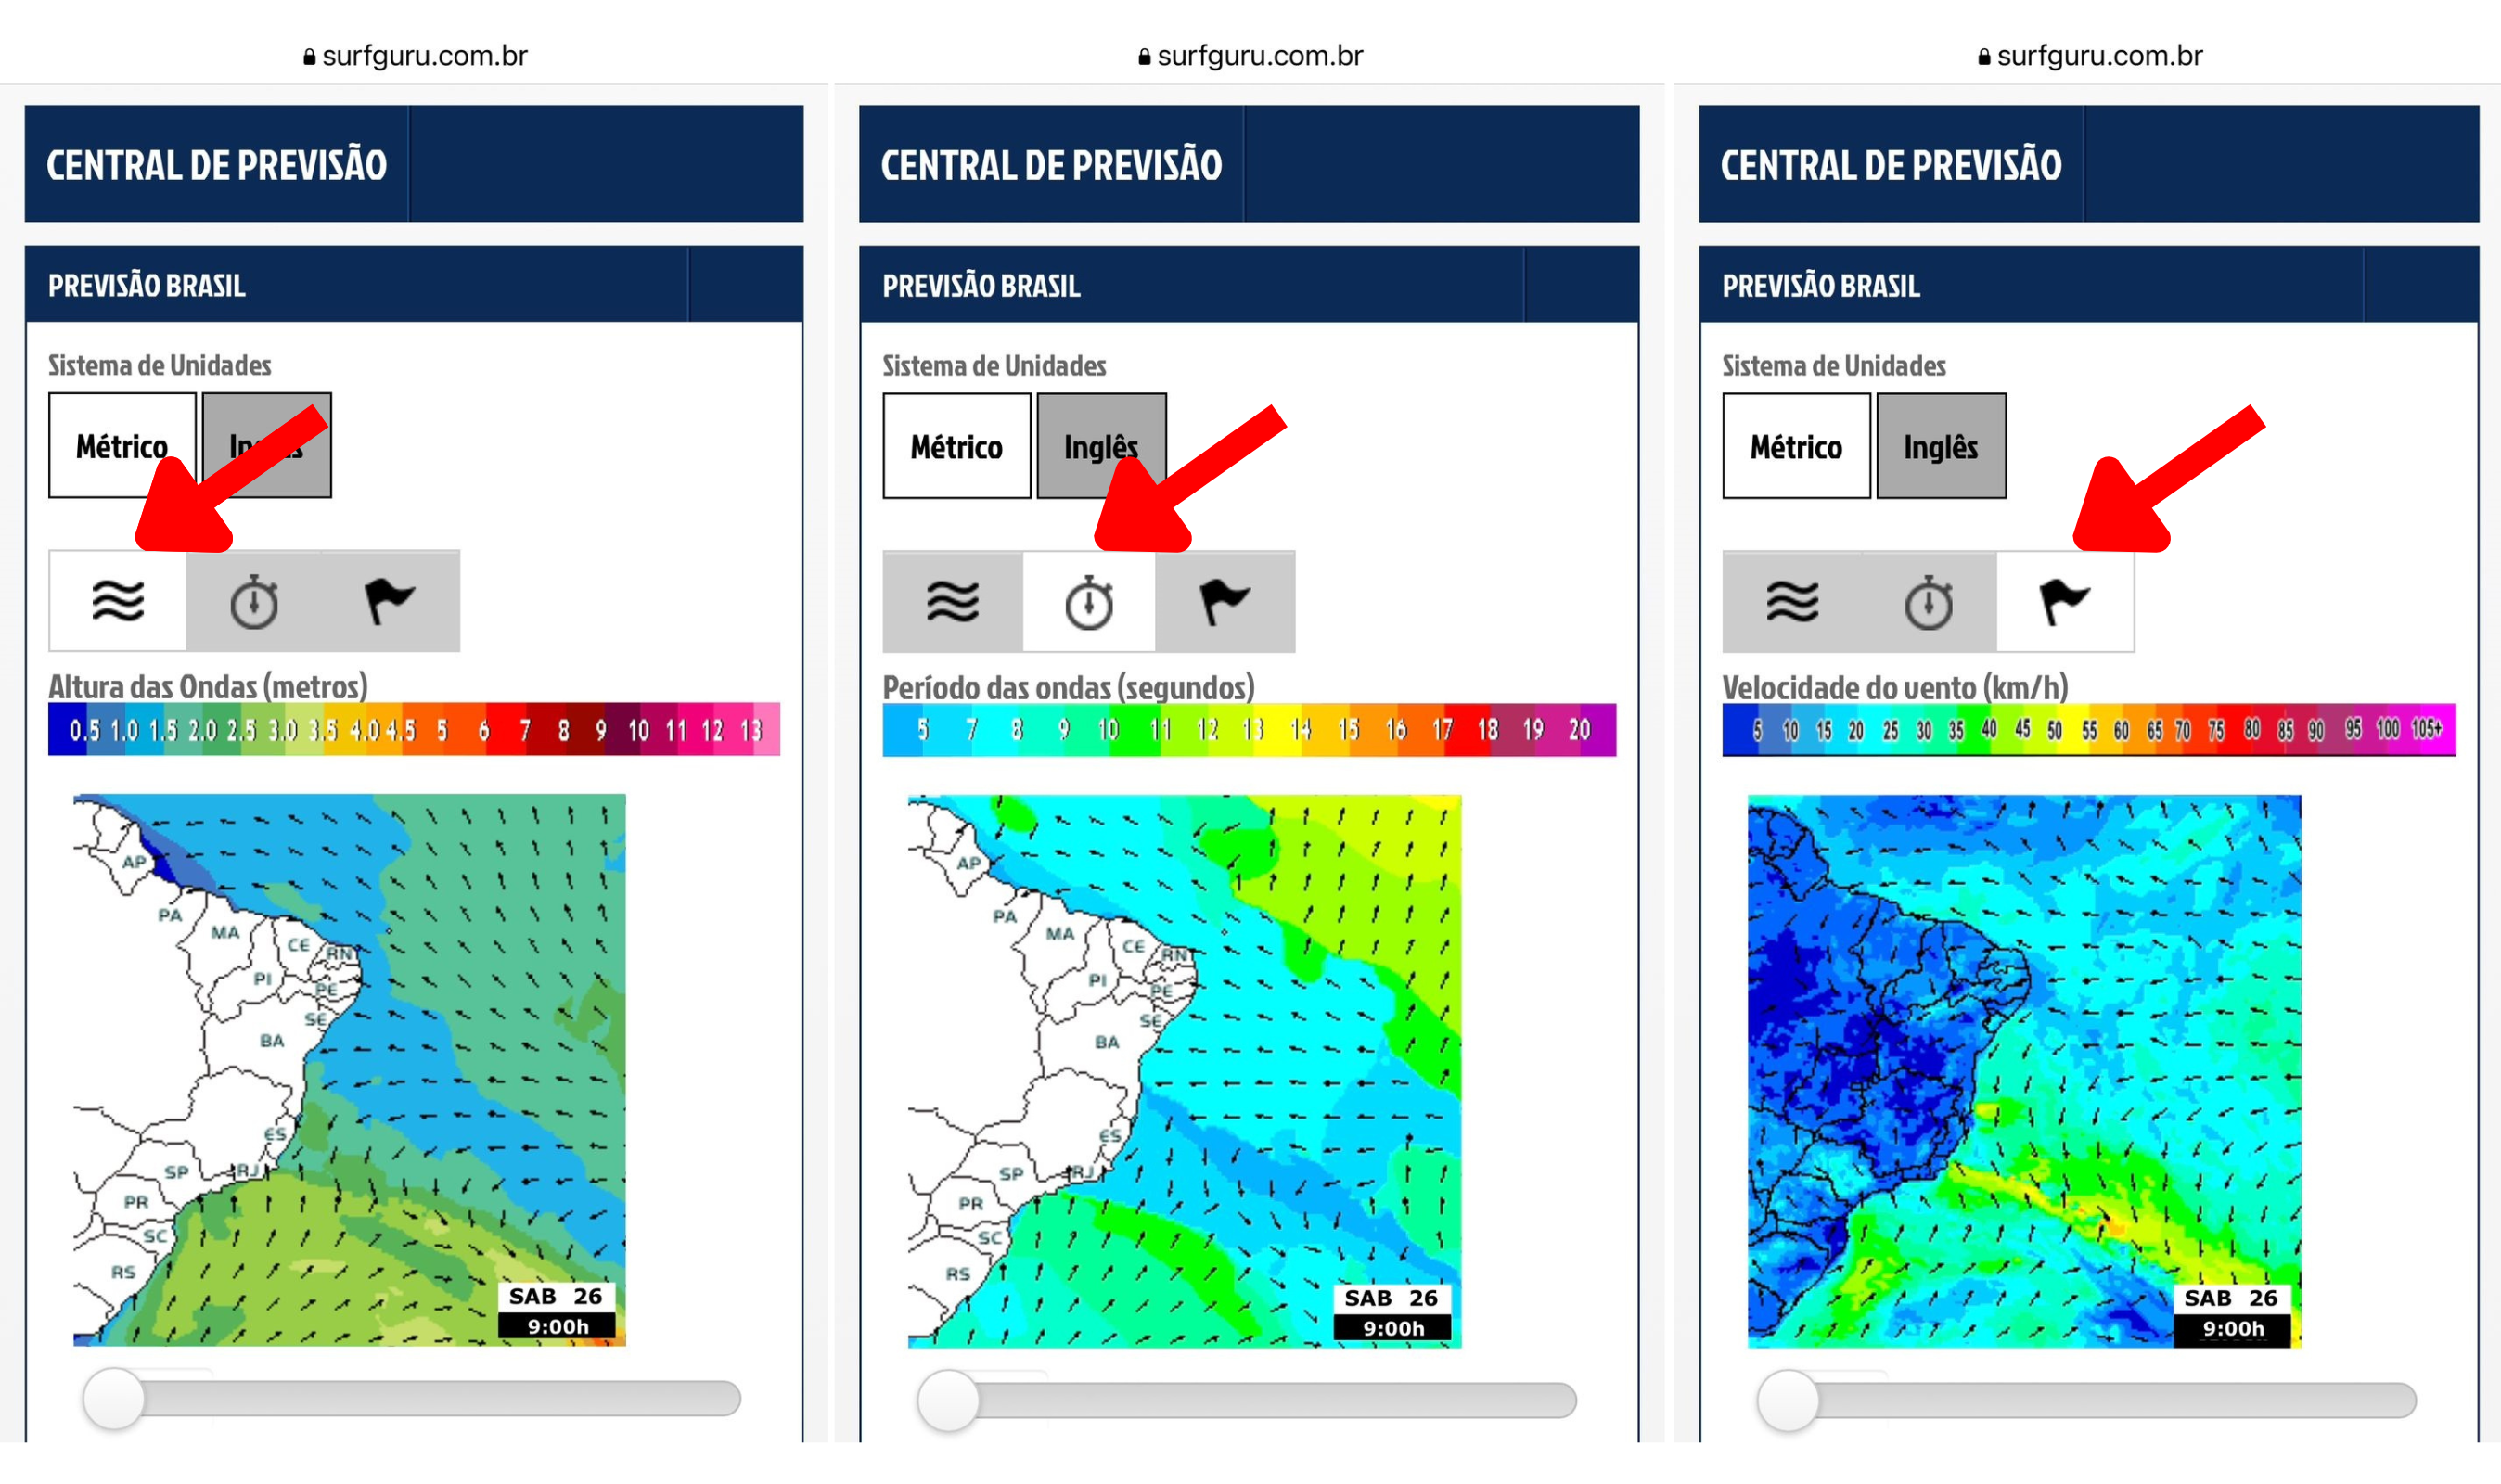
🔹 Wave height map
On this map (three-wave icon), it is possible to get an idea of the heights of the waves forming in the oceans and their direction. Here, the color gradient represents the height of the wave (the hotter it is, the higher the wave height), and the arrows the direction of the swell.
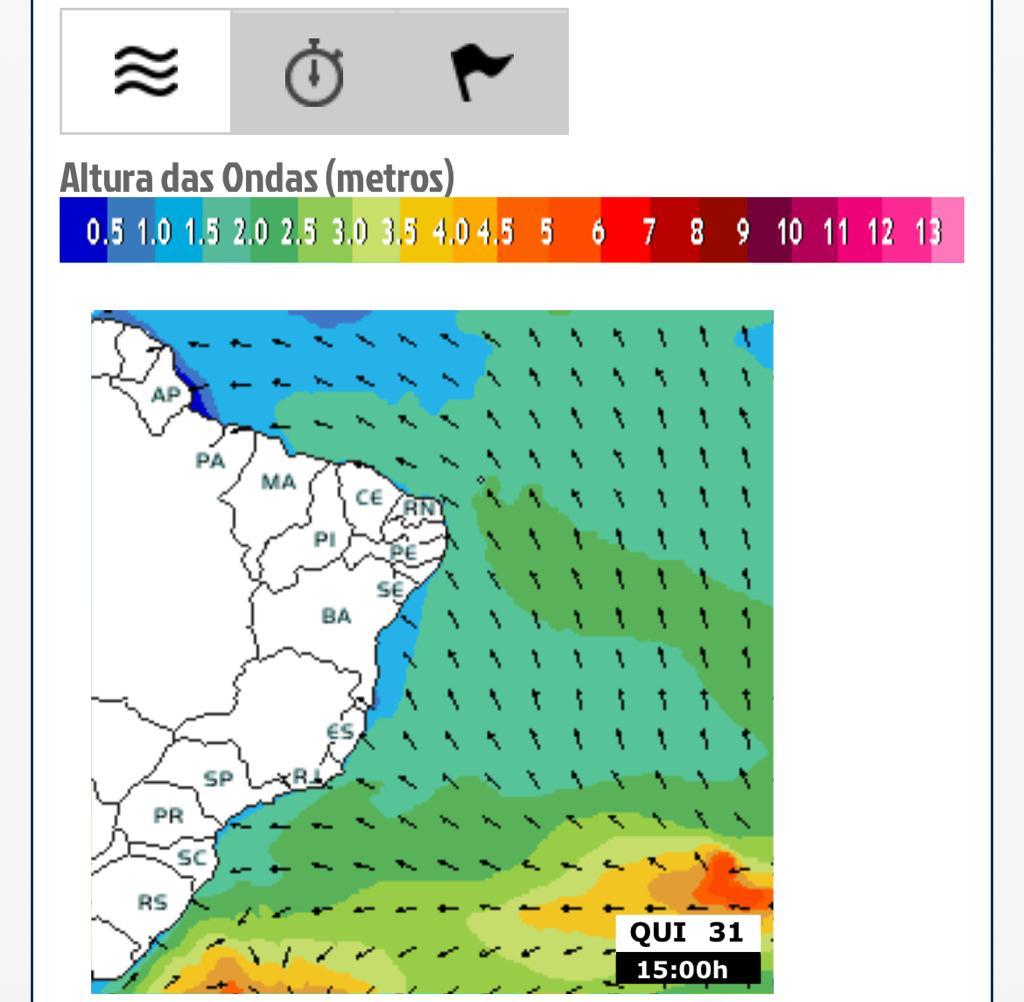
Remember that whenever we talk about the direction here (whether it's the swell or the wind), it's always where it comes from and not where it's going.
🔹 Period map
The period is nothing more than the time between two waves. How so? Imagine sitting on your board at the lineup and having a stopwatch on your wrist. You start its timer as soon as one wave passes you and stop the timer when the second wave passes you. That time between the two waves is the swell period and is one of the most important parameters to help you when reading the forecast.
You can see the period by clicking the "clock" icon above the map.
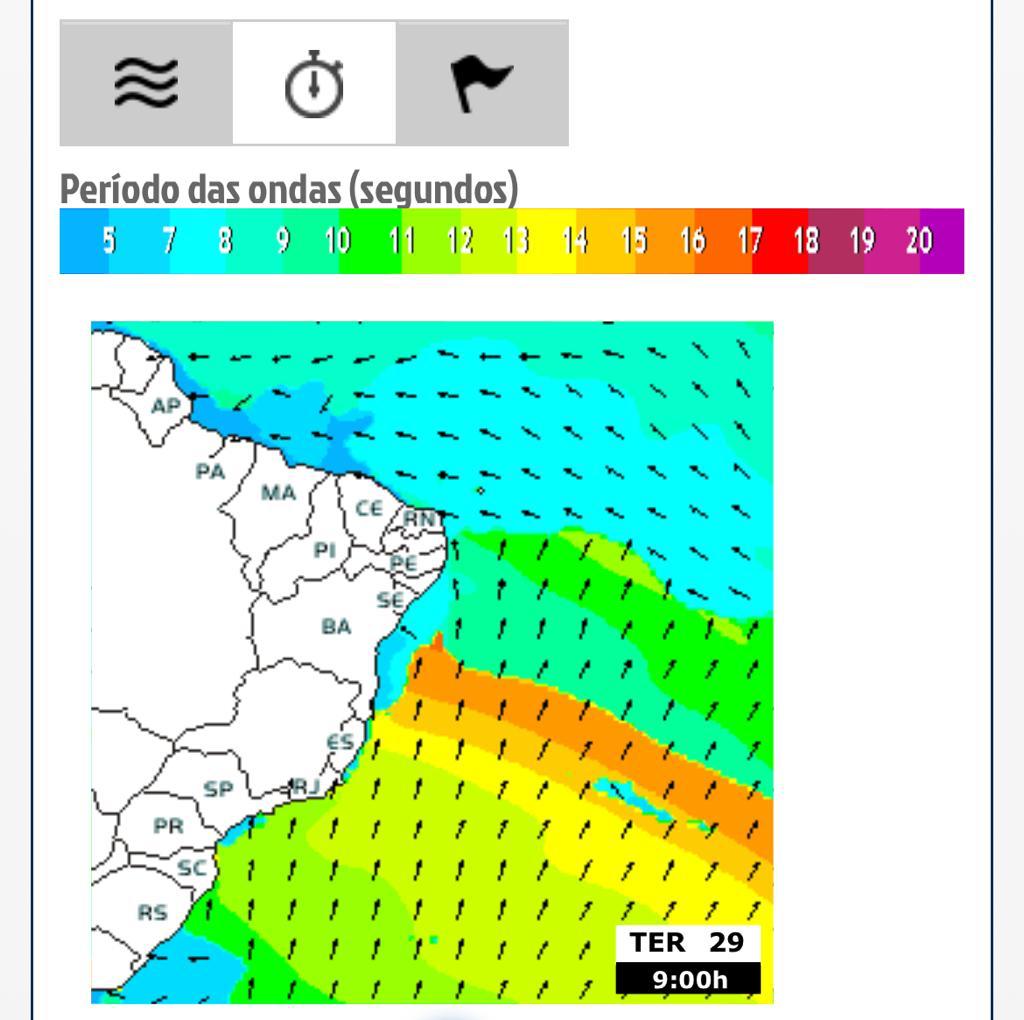
In general, longer periods are related to more aligned and organized waves (which would be a swell or groundswell), and smaller periods generate waves with a more messy formation (which would be a wind swell).
It is essential to observe the sea and know which are the best formations for each surf spot. In general, point breaks benefit from waves with longer periods, but some beach breaks can work very well with lower periods.
In the period map, you will also see a color gradient, where the warmer colors represent a longer period and the colder shades a smaller period. If the warm colors are touching close to the coast where you surf, there must be a swell!
It is possible to observe a gradient effect forming a swell in the period map, like a rainbow. This happens because waves with a longer period are faster, and as they move across the ocean, they group together in blocks like runners in a marathon, the fastest first and the slowest last.
Tip: Here in Brazil, a period above 12 seconds indicates that there must be a swell!
🔹 Wind map
In the third icon (little flag), it is possible to see the formation and intensity of the winds in the ocean, in which you can identify where the fetch is forming. The warmer the color in the map, it indicates where the fetch is.
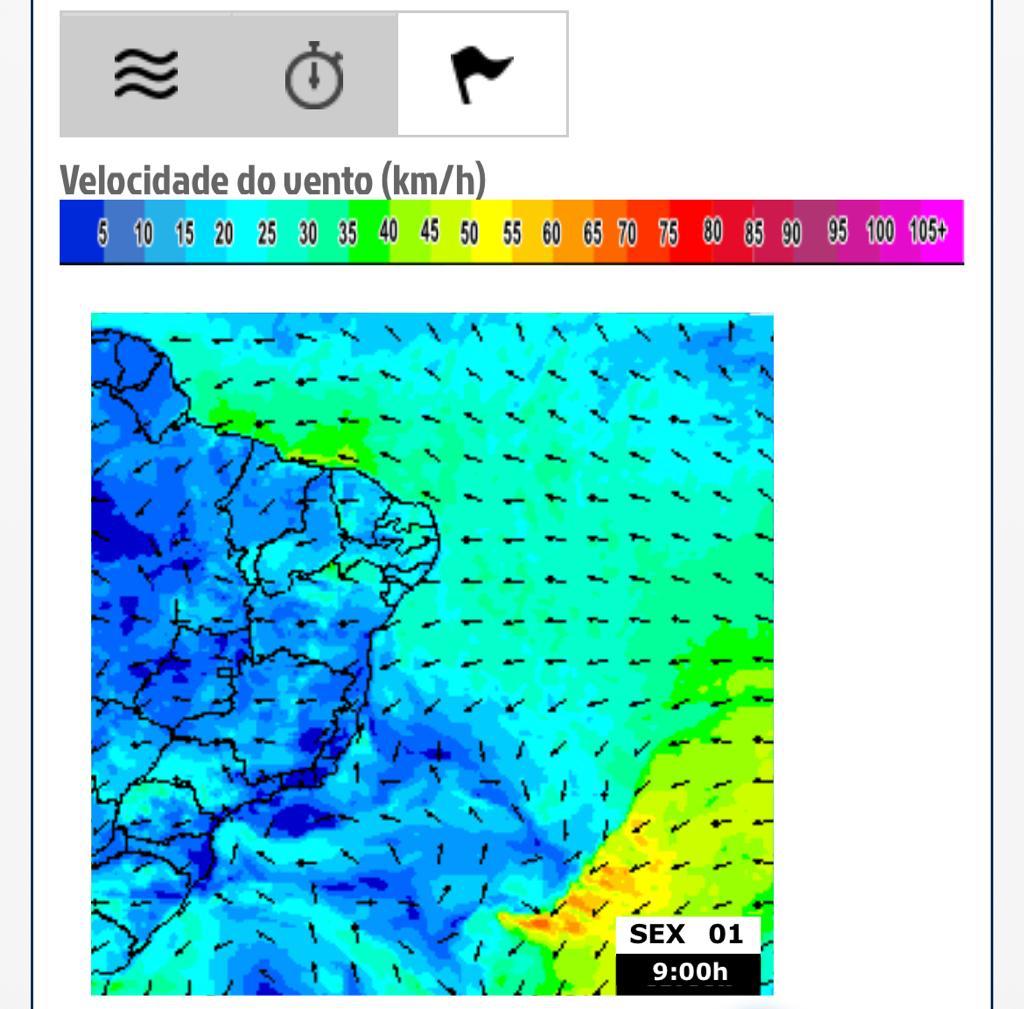
If the fetch area is far from the shore, the chance is high that the waves will arrive on the coast lined up as a swell. As I have said in this post, waves are formed by fetches (large areas where the wind blows constantly) in the open ocean. When these wind lanes are located far from the coast, the waves need to move, and in this process, they align and organize themselves into a series of waves with similar speeds. The fastest ones at the front and the slower ones at the back form that gradient on the period map representing the swells (or groundswells). The waves that are forming inside the fetch can be called choppy waves.
So if the fetch is happening close to the coast, we will have vacancies on our coast, that is, a mess! It's possible to have groundswells and wind swells coming in simultaneously, so it's essential to understand all forecasted swells.
🌊 Analysing the forecast at your surf spot
Ok! Now that you know if a swell is coming, it's time to see the forecast where you'll be surfing.
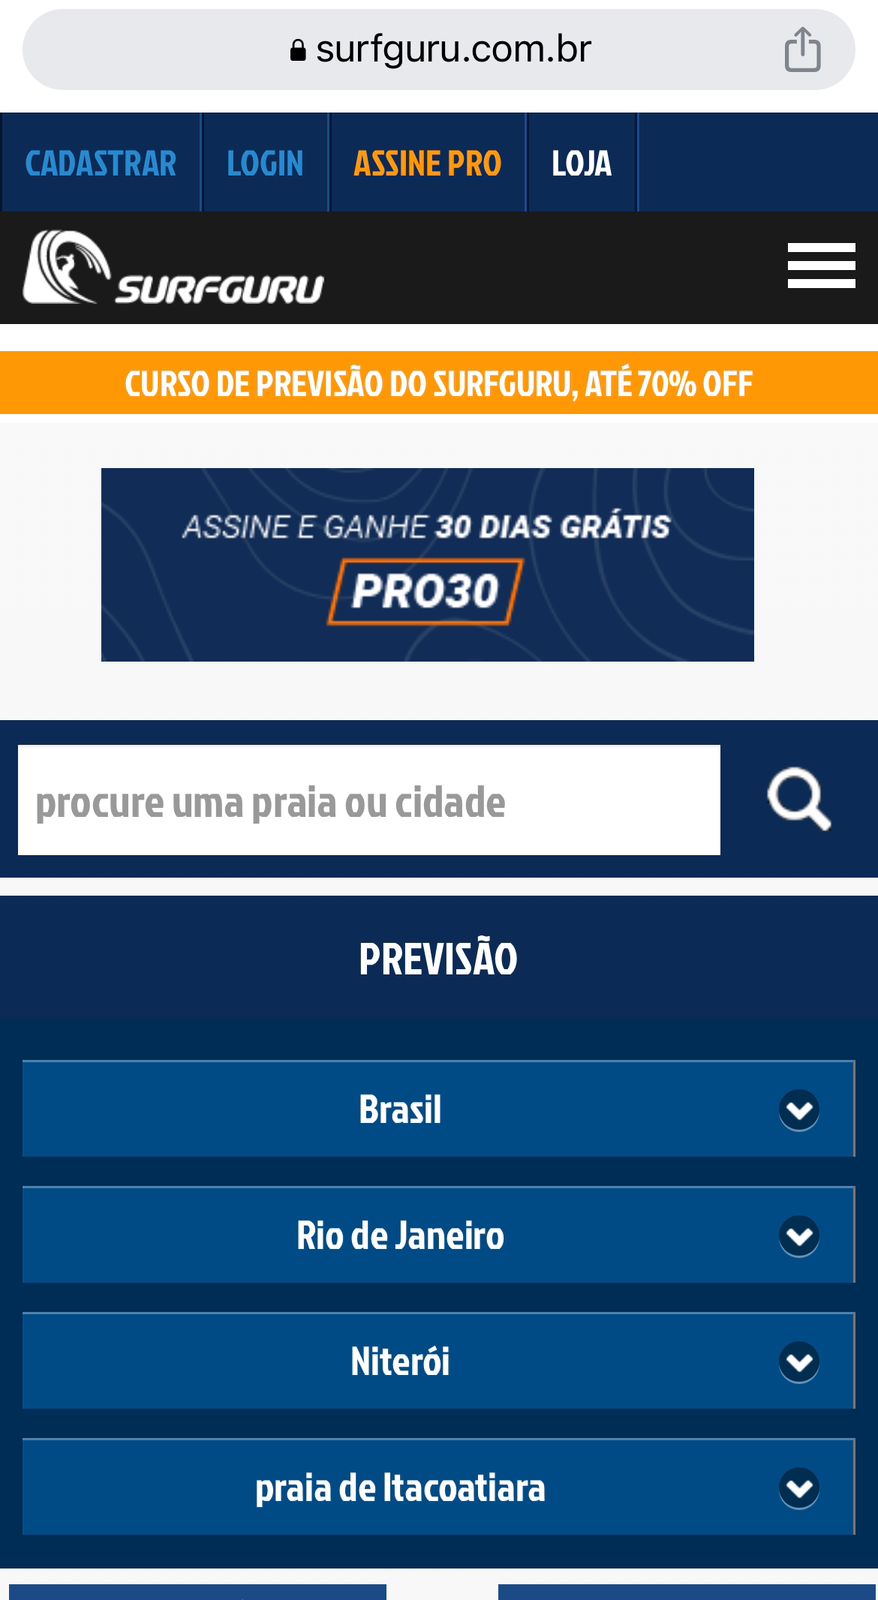
To do this, click again on the three dashes in the upper right corner of the screen and then on "Início" (Start). On this screen, you already choose the location: Country, State, and City and click "Veja a previsão completa" (See the complete forecast).
🔹 Oceanic forecast
The first forecast (if you don't choose the beach) is the ocean forecast; that is, it will show how the waves behave in the ocean (before reaching the coast, where the depth is smaller) in the region/state that you selected. This forecast gives you an overview of how the swells are coming in and does not represent the actual condition you will encounter on the beach (as waves behave differently in shallow water).
Here you will find the height, period, wind, weather, water temperature, spectrum maps for the selected region/state, and graphs containing this information.
🔹 Beach forecast
Moving on to the beach forecast, I will choose Itacoatiara Beach in Niterói (RJ) as an example. Just select your beach from the list below the city on this page.
The beach forecast will already bring information about waves and winds for that specific point, taking into account the effect of the characteristics of the place. For example, if a rocky shore on your beach blocks waves from a particular direction, this will already be considered in this beach forecast.
For example, if the beach faces south, it will receive swell from the southwest, south, and southeast, and consequently, it will not receive a swell from the north quadrant (and vice versa). Study the compass rose (which explains the cardinal directions: north, south, east, and west) to better know where you will surf. Each spot/beach will have a specific condition that will be good for it, and that same condition can be bad for another beach.
From here, all the same options (maps and graphs) you would see in an ocean forecast appear locally in the selected region.
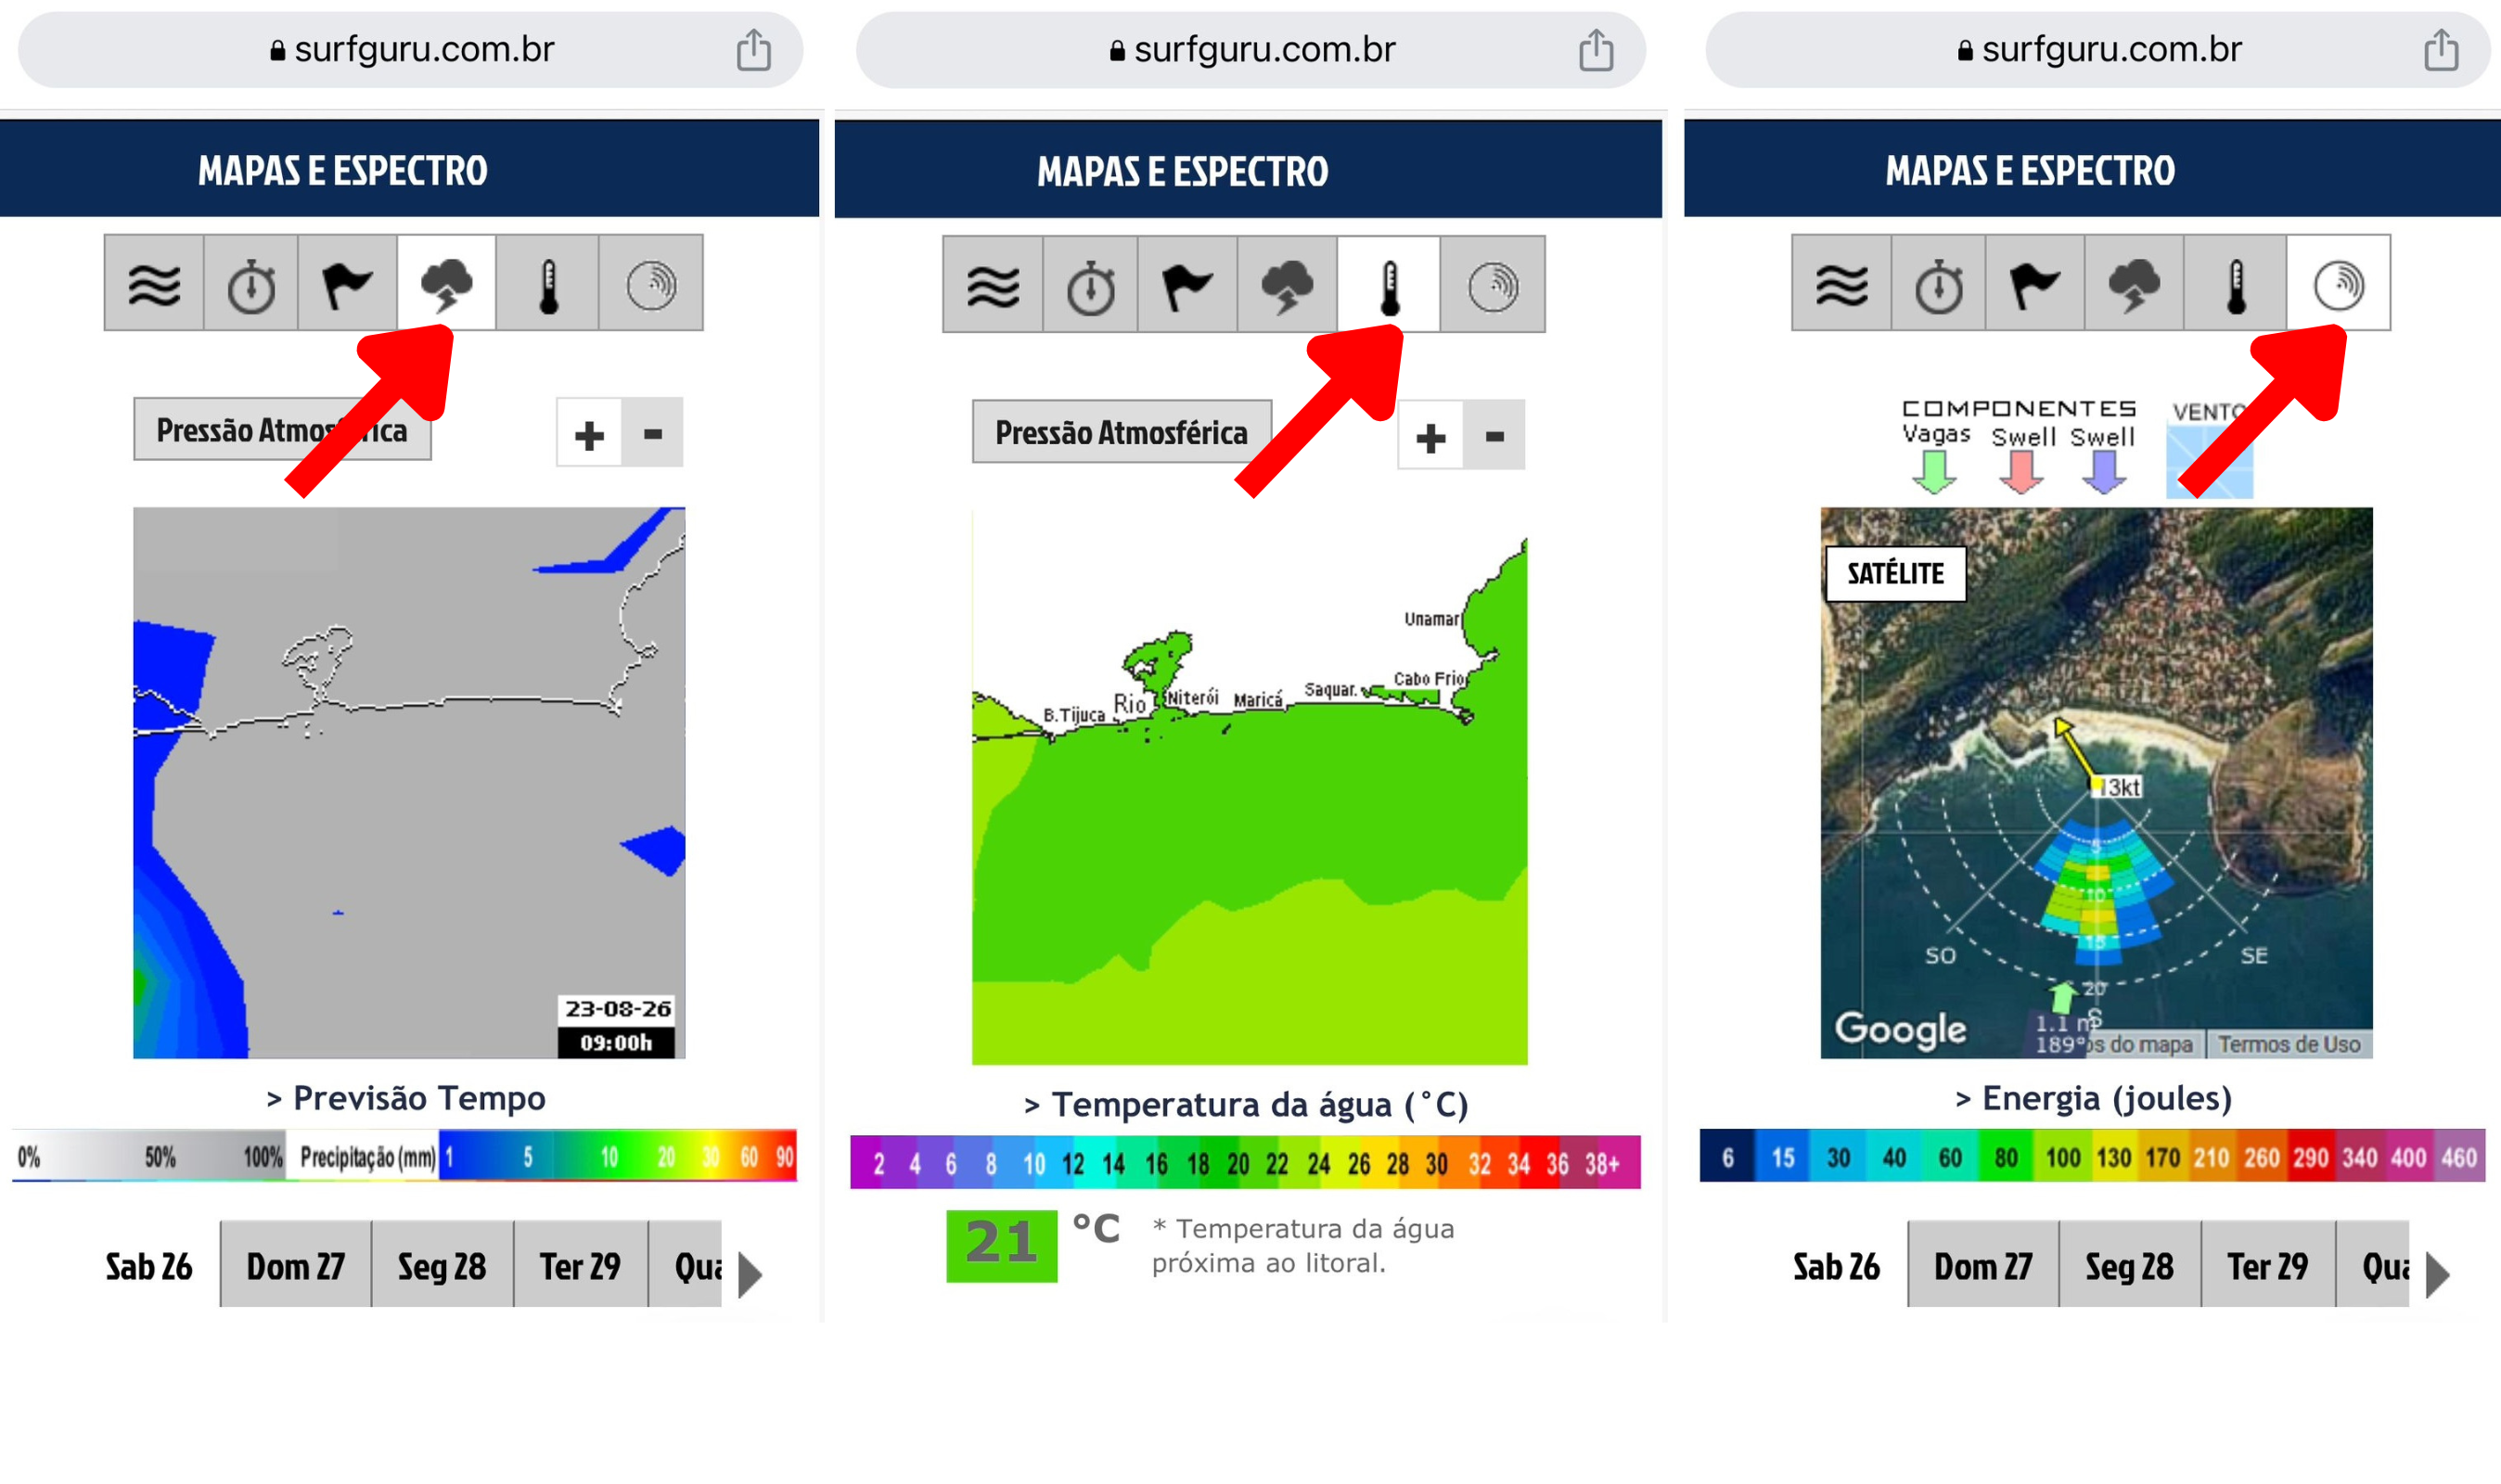
Scrolling down the page, the first map appears, now local. On the icons above the map, you can see: - the height of waves: three-wave icon - the period: clock - the average wind: linesman - weather forecast: cloud - the surface temperature of the water: thermometer - the spectral map: probably the best tool to help you understand the forecast
And just below the map, the days of the week appear, which you have to click to see the forecast for the next few days.
Before going through the maps, I want to explain that the spectral map is one of the most important because it shows us which directions the waves with more period and energy are coming from.
Before seeing it in detail, to understand this, know that the sea is a "salad of waves," and these waves can be coming from several directions simultaneously. Most of the time, there will be swell waves that come from a specific direction that stand out over the others, and those are the waves we're interested in and call predominant.
🔹 Spectral map
Let's go to the spectral map. It's simpler than it looks. I'll explain item by item for you to understand!
You are seeing your beach and spectrum. Step by step:
- the yellow ball where the arrow comes out is the point where the prediction is made.
- the map at the bottom already lets you identify the best swell and wind directions for each beach.
- the little yellow arrow indicates the direction and speed of the wind: the longer it is, the stronger the wind
- the dotted semi-circles in white represent the periods: each dotted line is a different period, from the smallest, next to the little yellow arrow, to the largest period, at the extreme end of the spectrum (the numbers in white in the middle of the semi-circles indicate the value of the period)
- the colored blocks represent the different swells arriving
- the positions of the blocks indicate the directions and periods of these ripples
- the colors of the blocks indicate the energy of the ripples of each direction and period
- the thicker arrows (green, red, and purple), when present, represent groundswell (red and purple) and wind swell (green), and the value represents the height of the wave arriving at the beach.
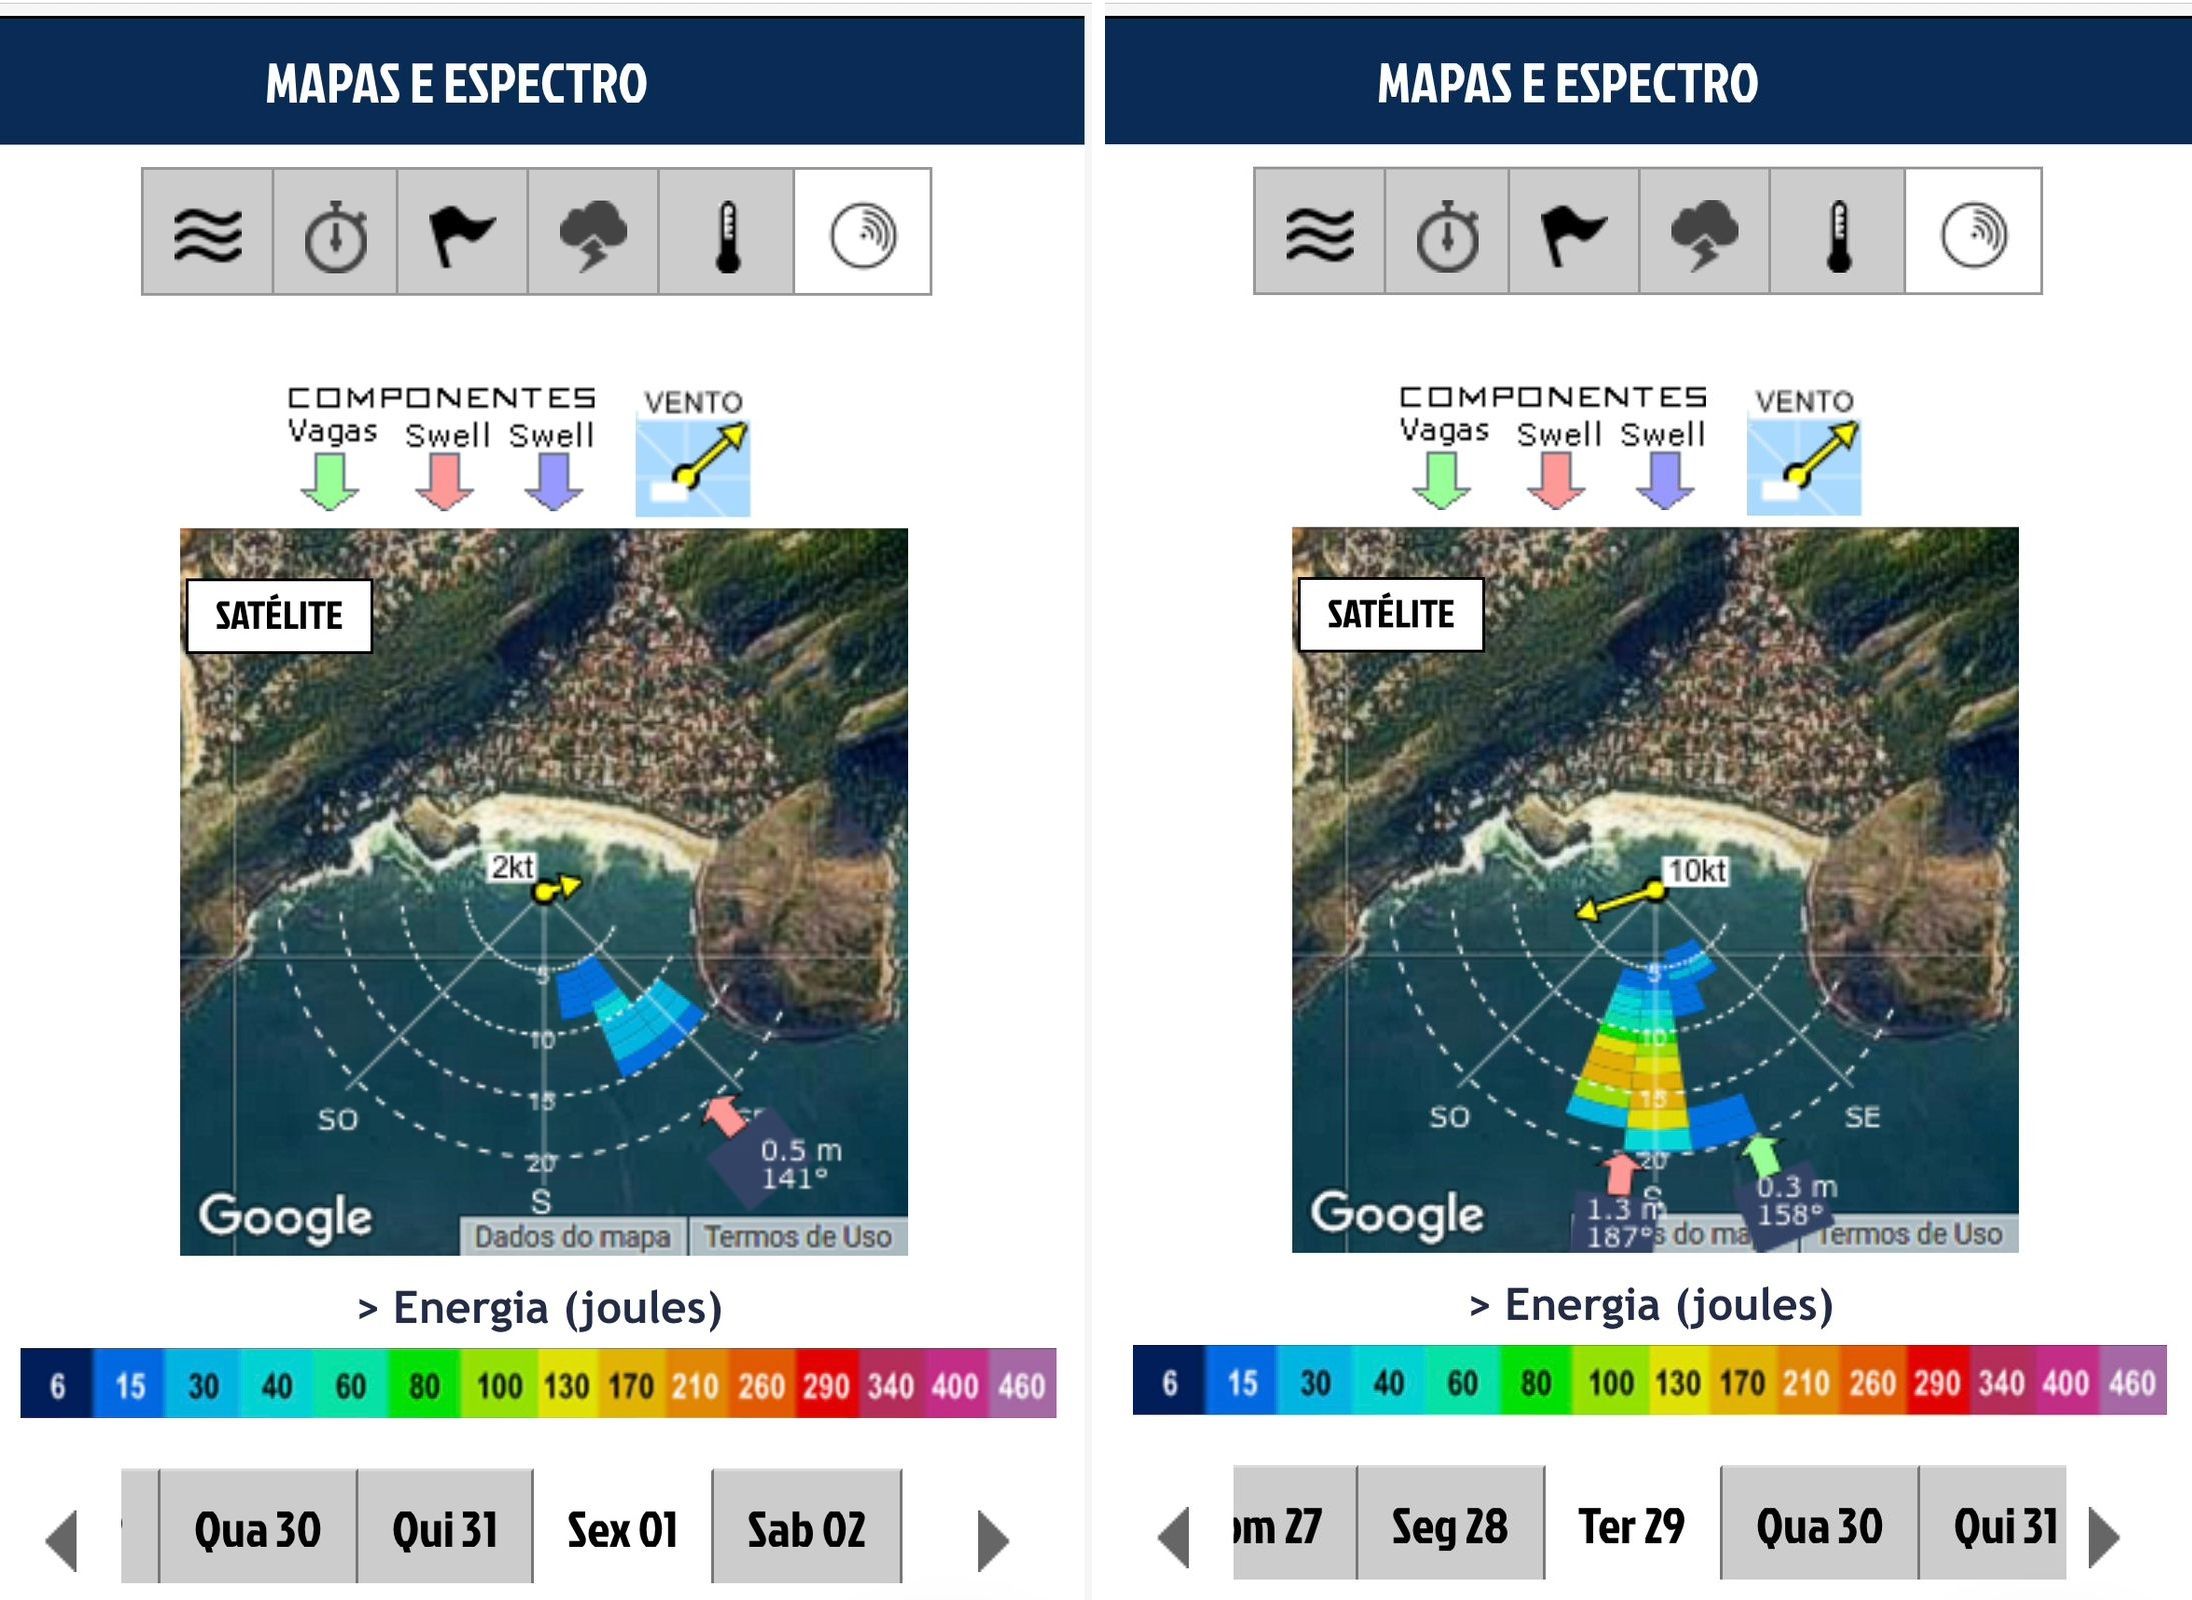
Analyzing the images above and using them as an example, in the image on the right (Ter 29), we can see two thick arrows, one red (south direction - S) and one green (southeast - SE). It is also possible to observe that in the swell coming from the south, the colors of the blocks are warmer near the dashed line of 15 seconds period, while the swell from SE only presents blue blocks, close to the lines of 5 and 20 seconds of period. This means the predominant swell is south, where most energy is concentrated.
The map on the left (Fri 01) shows that only one swell is acting on the beach that day and with very low energy, indicating a flatter sea.
I want to emphasize here that in only one place, you get to know the intensity and direction of the wind and the energy and period of the swells coming from the most varied directions.
🔹 Wave height chart
Now, let's see the graphs. Scrolling further down the site, the first graph that appears is the height and period of the waves. - the little blue arrows at the bottom of the graph indicate the direction of that ripple - the vertical bars indicate the height of the ripple (which you see on the vertical axis of the graph) - the colors represent the period
The chart automatically opens with the "Total" tab selected (which represents all the swells together). Still, if you scroll through the other tabs, you will see the swells grouped by their predominant directions (wind swell, swell A, or swell B).
You can see the forecast for the next few days by dragging the graph to the side.
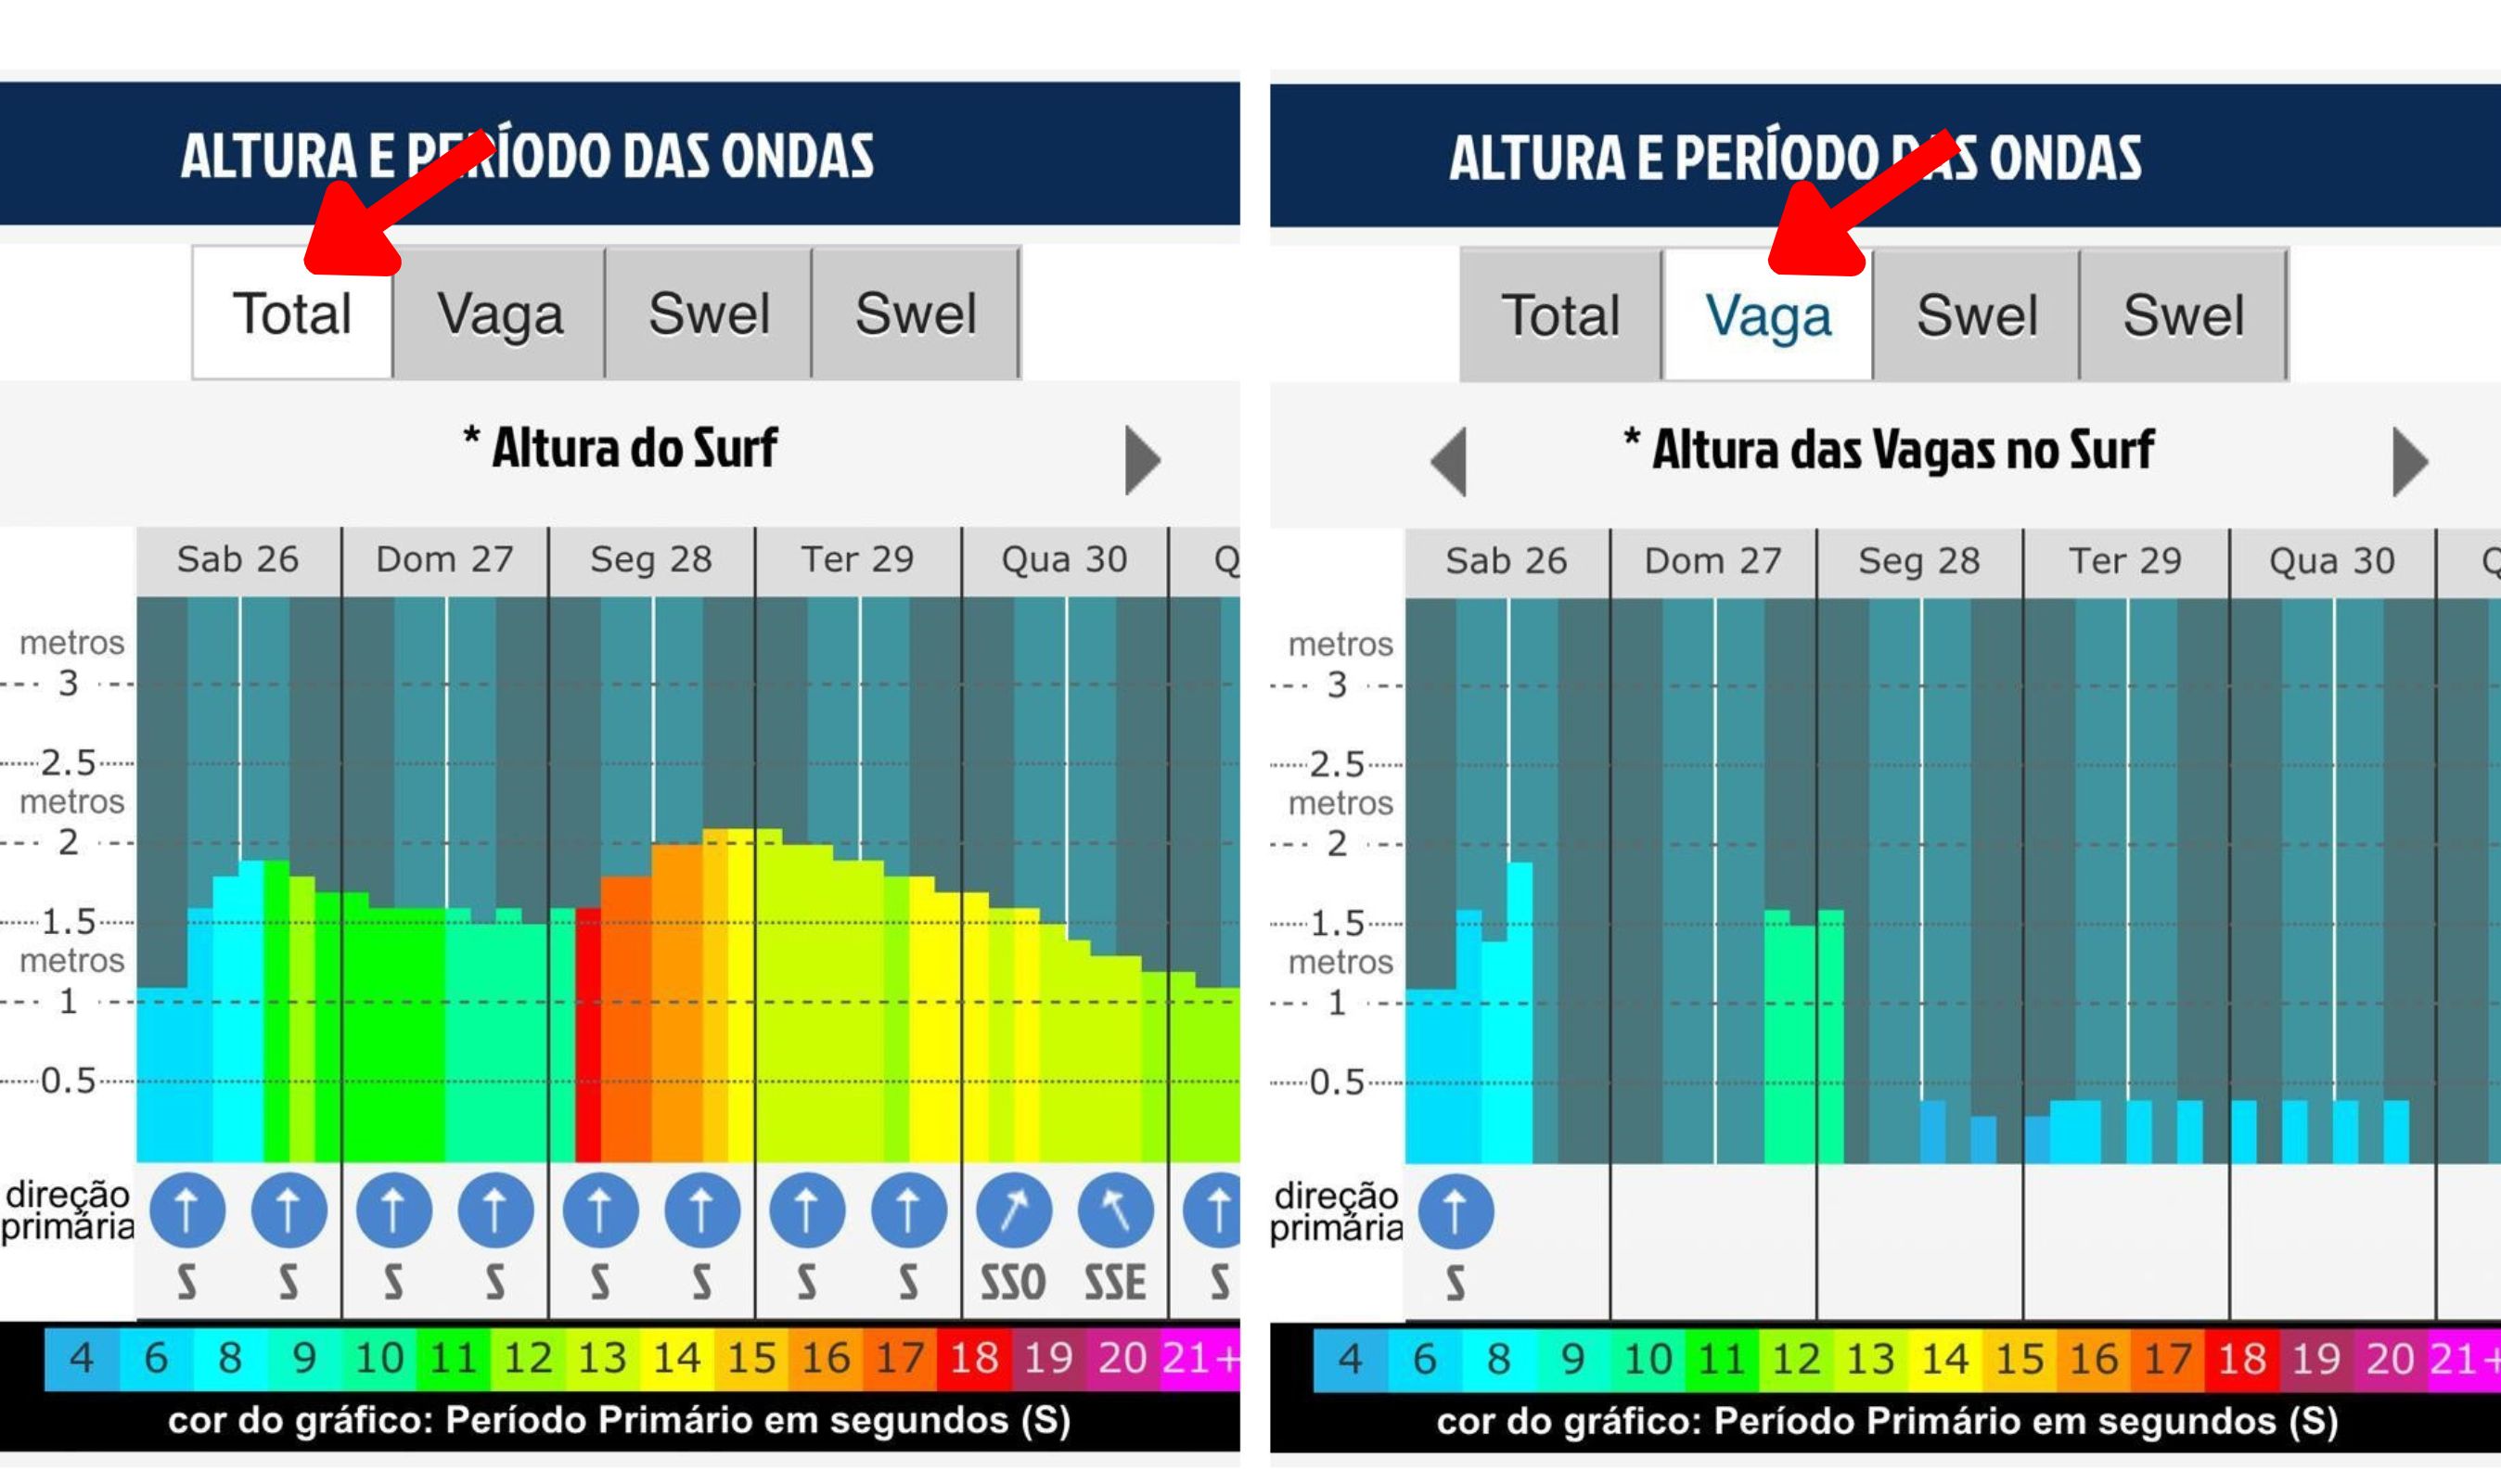
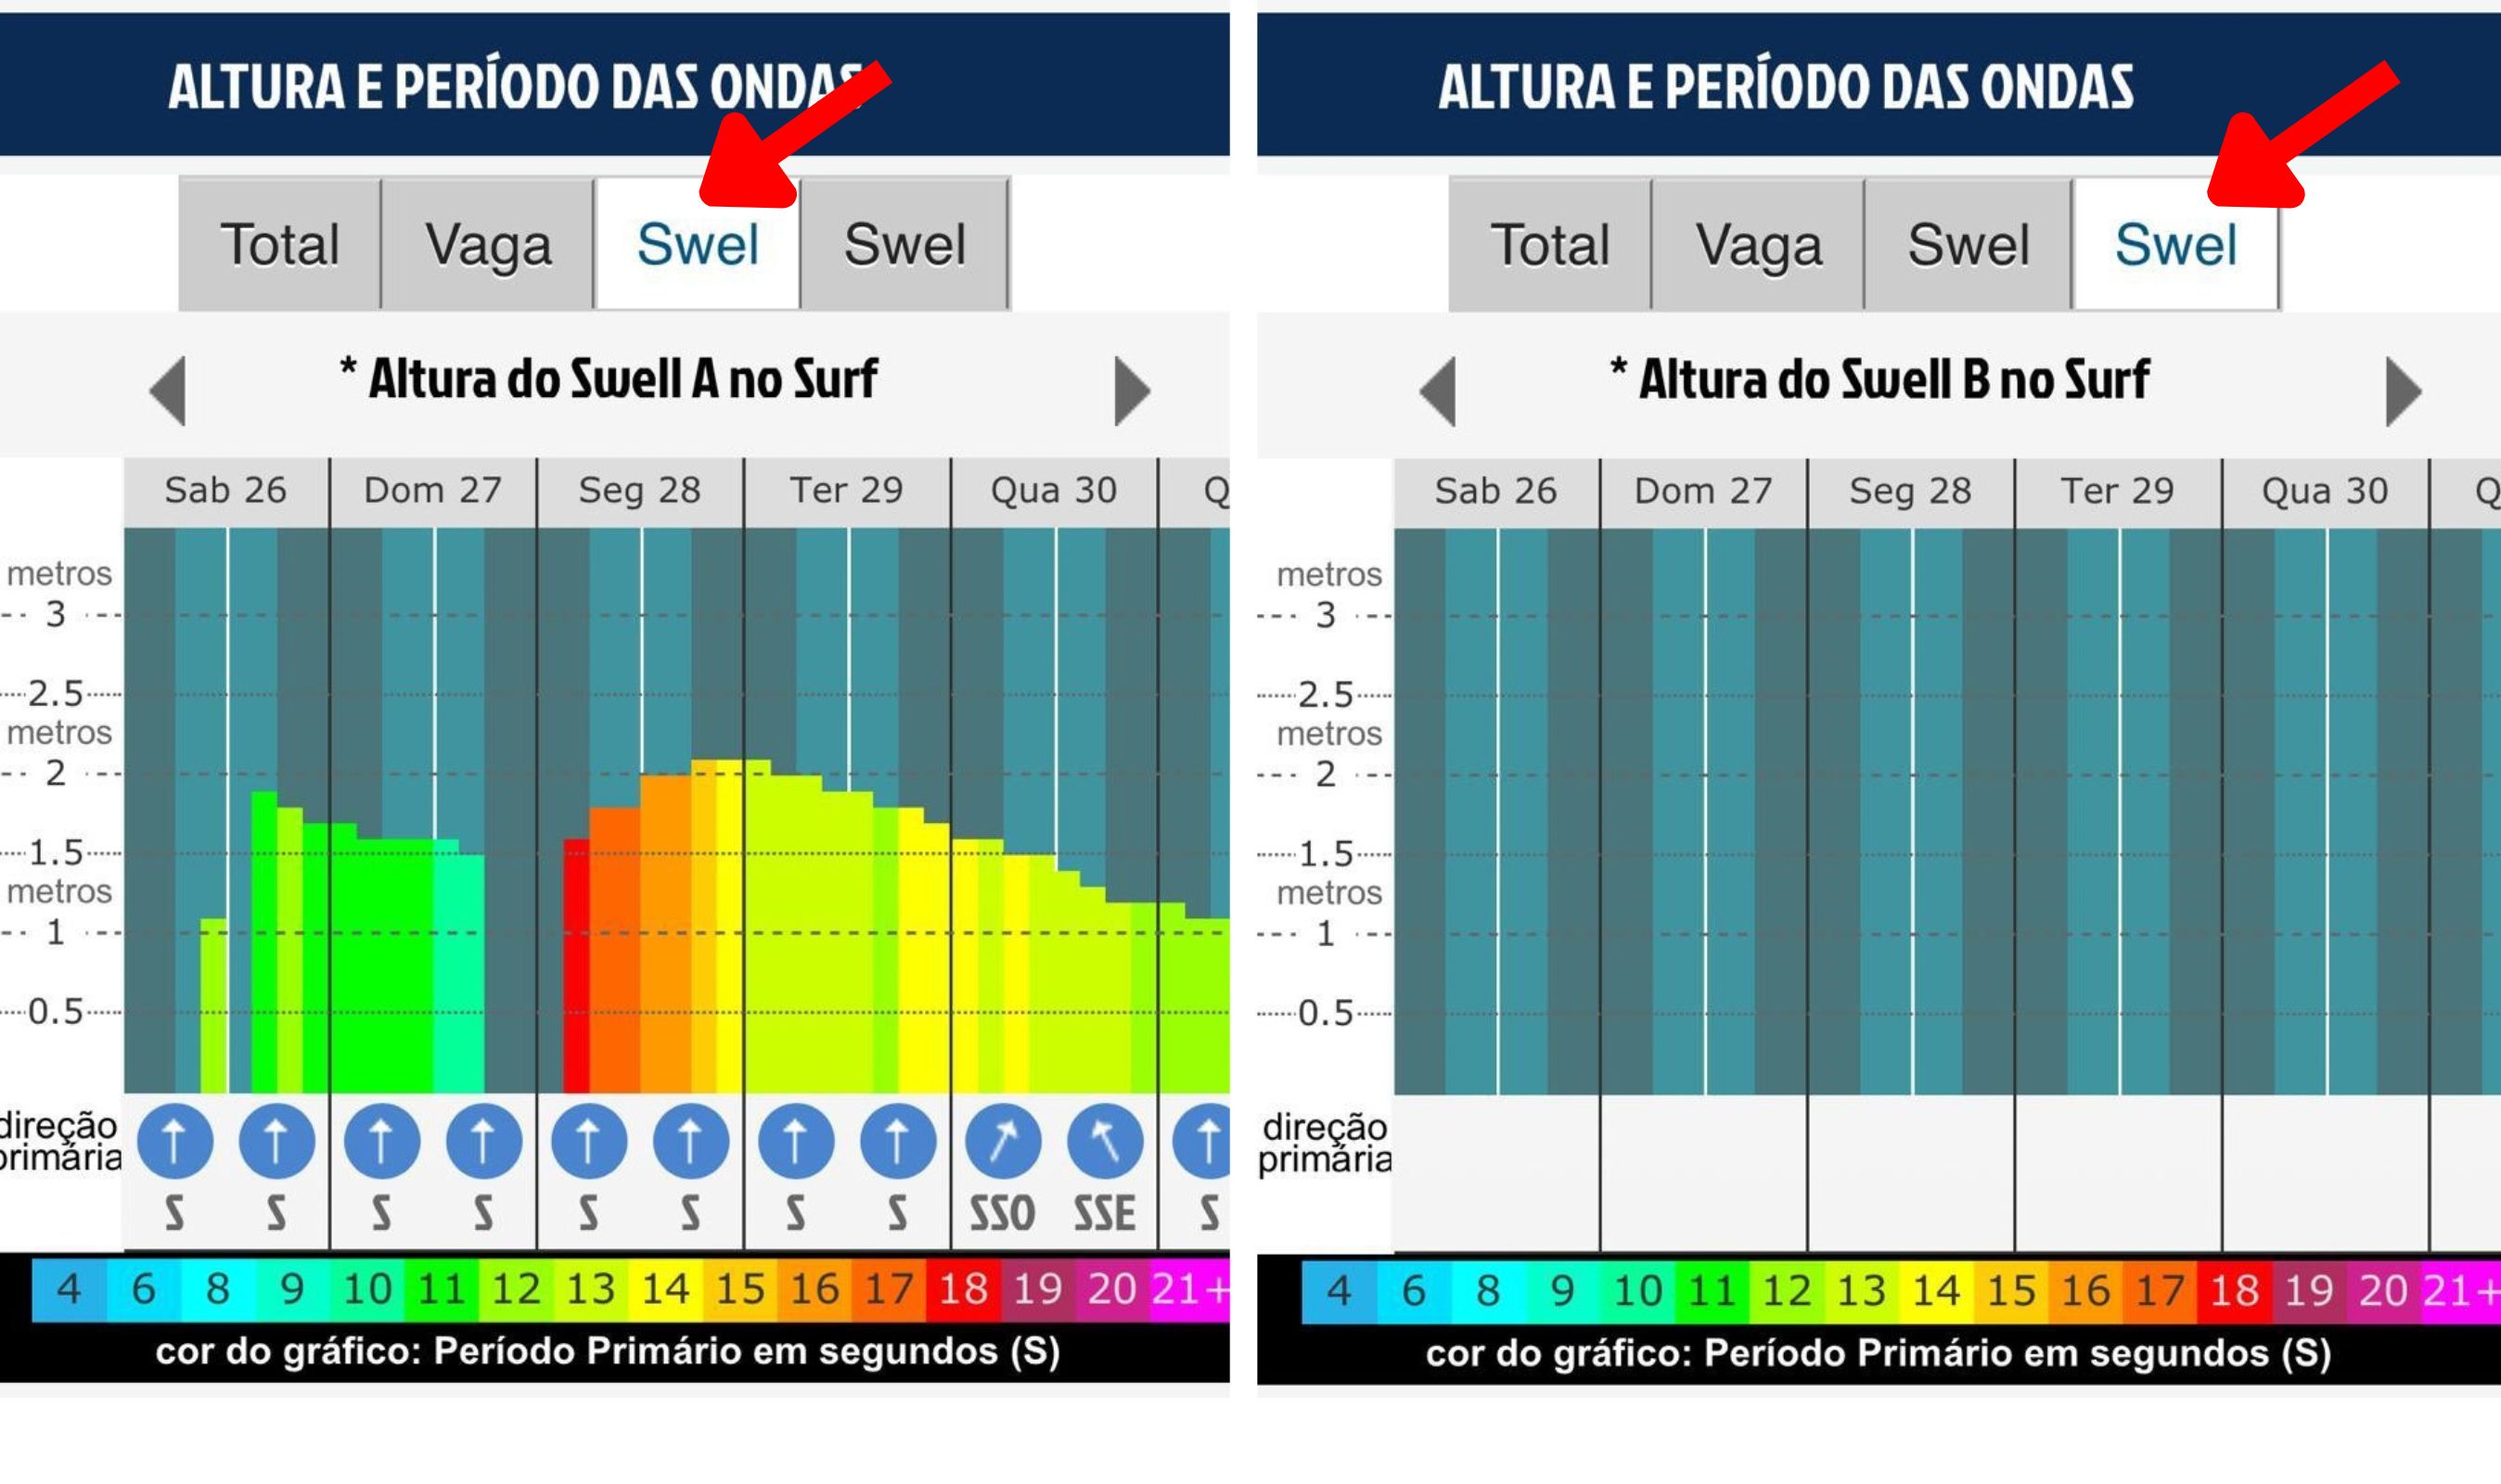
Now, if you click on the "Wind swell" (vagas) tab and bars appear from one side to the other, there is a great chance that the sea is messed up, remember? If bars do not appear in waves, but bars appear in Swell A or Swell B, the swell will likely arrive more aligned, and surfing may be guaranteed.
🔹 Wave energy and power charts
Have you ever considered how wave speed can influence your experience in the water? We, as surfers, give a lot of importance to the height of the waves, but we also have to observe other factors, such as the period, energy, and power of the waves.
The energy of a wave is directly linked to its height. Power is related to the speed with which this energy is transferred. Remember that the period of a swell indicates its speed? So, the calculation of energy uses the height of the wave, while the measure of power uses, in addition to the height, the period of the swell.
The energy and power will tell us, basically, the strength of the waves. Generally speaking, waves with longer periods are more powerful than waves with shorter periods.
This means that swells of the same height carry the same amount of energy, but the swell with a longer period will be more powerful (stronger and heavier) than the swell of the same height but with a lower period.
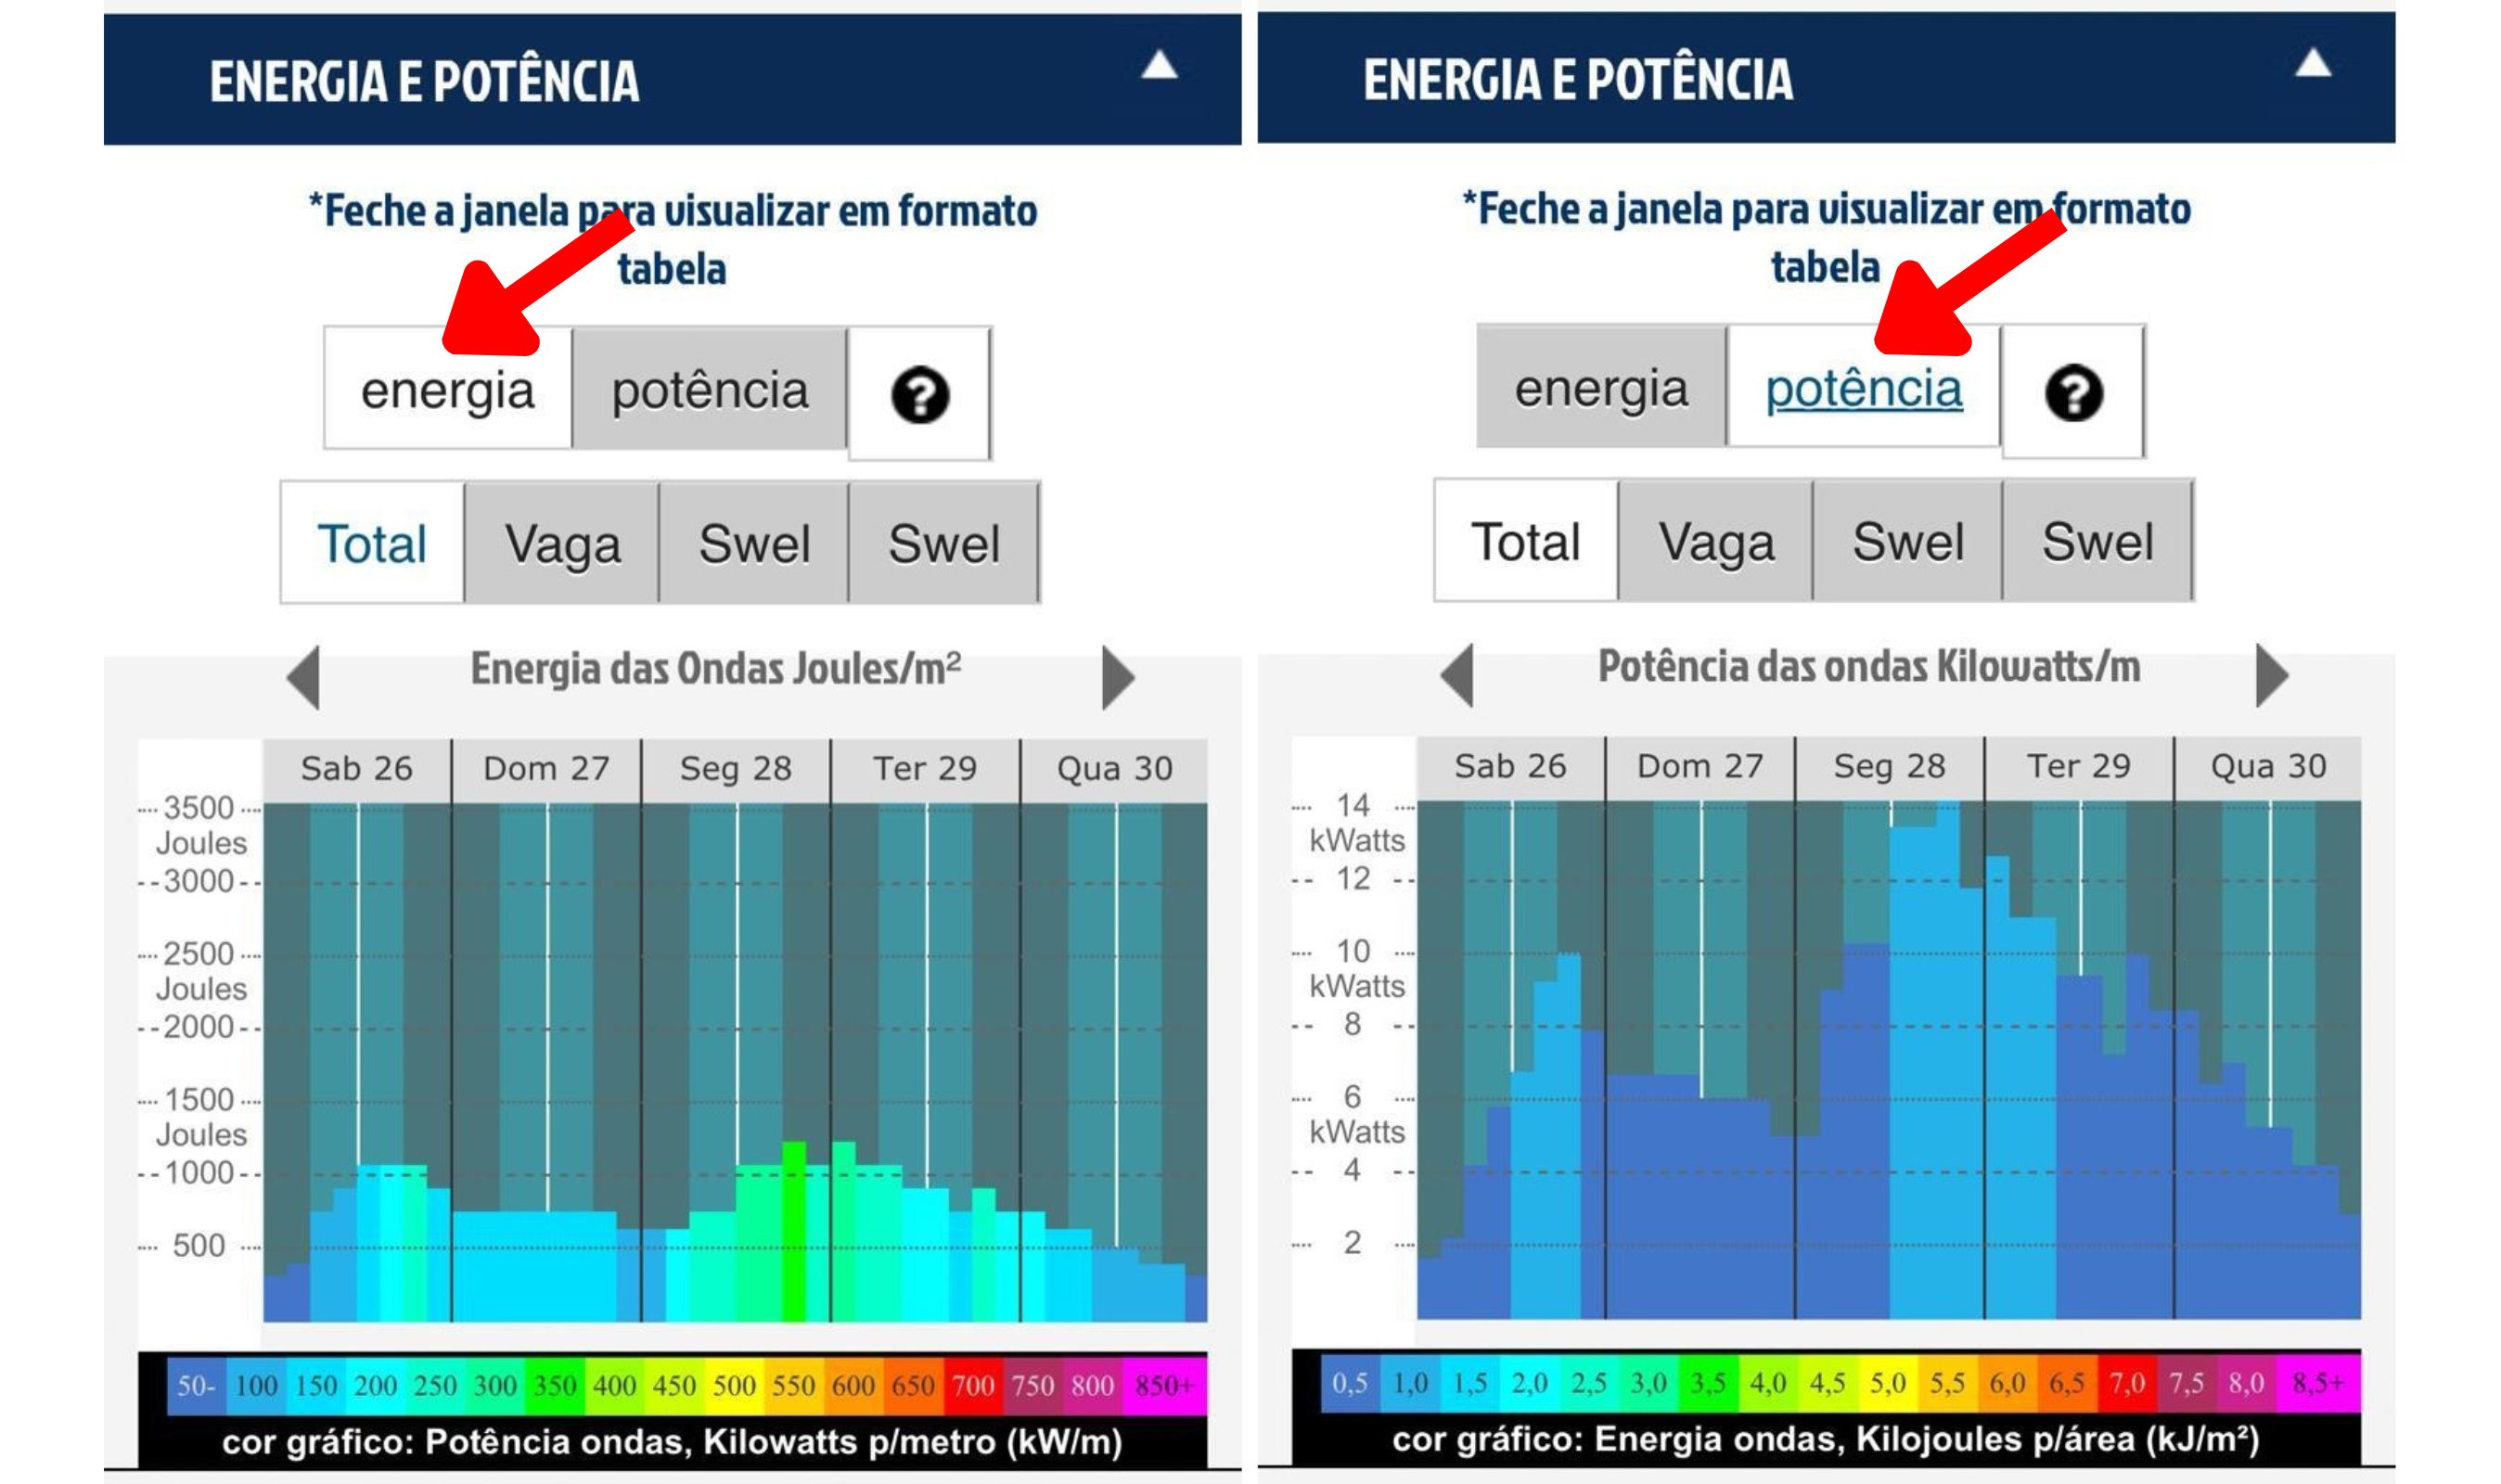
Note that here you can also see the energy and power of each incoming swell (scroll through the tabs above the graph "Total", "Wind swell" - "vaga", "Swell A," and "Swell B"). Analyzing this data, you will be able to define which of these swells will have more power and energy in relation to the others.
🔹 Wind chart
The other half of the wave forecast will depend on the winds, which is the following graph on the website. The coastal wind will influence your surf or activity the most.
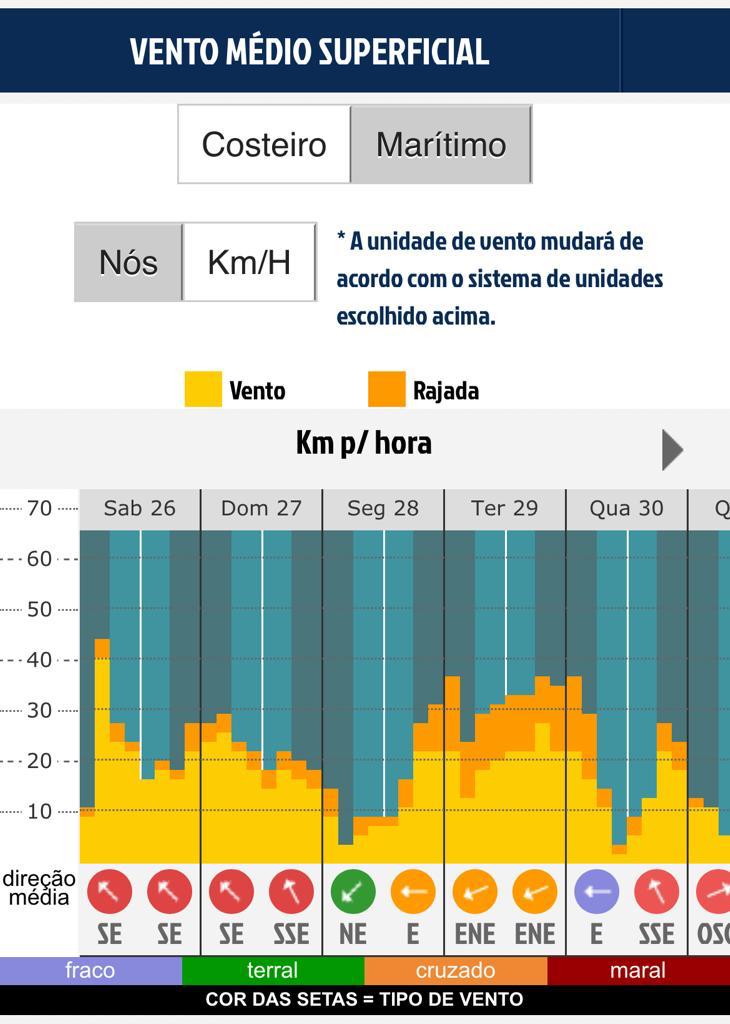
In this graph, the bars represent the wind speed (values on the vertical axis), with yellow representing the predominant average wind speed and the gusts orange. Dragging to the side, you see the forecast for the next few days.
Still below the graph, the little arrows represent the wind direction, and the color classifies each one as "weak", "onshore", "crossed," or "onshore", according to the location/beach you chose. To understand and understand the prediction: - the onshore wind is the one that comes from the sea and leaves the waves messy; - the offshore wind is the one that comes from the land and that, when meeting the waves arriving at the beach, makes them smooth and makes them more aligned.
The wind tends to follow different patterns in each region. If you understand well how it behaves in yours, you can organize yourself to make the most of the good winds and fill the agenda at the time of the bad winds.
😵😵😵😵😵
So, did you understand the basics of reading wave forecasts?
It's a lot of information, I know! But each of these parameters is important when making a more accurate reading.
It must be made clear that the forecast is not always correct. It is advisable to check the forecast daily to reduce the chances of disappointment when arriving at the beach and not finding the conditions you expected. Constant observation of the forecast and the sea makes you a good sea guru!
What I show here is just a little bit of what Surfguru offers. But the site has so much more! The PRO subscription provides several advantages that the free version does not, such as:
- See the forecast for the next 15 days: With PRO, you can monitor swells, plan your trips, and organize your schedule to be in the water at the best times. Only those who subscribe to Surfguru PRO have access to the extended forecast.
- Create personalized alerts: You will be notified when the sea is how you like it by configuring customized alerts on the website. You choose the wind and the swell, and it will inform you by email when this condition matches the forecast. Either a mellw waves alert or a bomb alert; you're in charge!
- Access forecast history: With Surfguru PRO, it is possible to consult the forecast history of the last 10 years of forecasting. The usefulness here is that you can consult the forecast for that day that was great for you, compare it with the following forecasts, and find out if the conditions suit your activity.
- Helping to take care of the oceans: The same sea that we use daily to surf and enjoy is devastated by the impacts caused by humanity. Surfguru allocates 10% of PRO revenues to actions to care for the oceans. That way, you become part of the solution.
And, of course, I was hoping you could use and abuse these advantages. That's why I have a gift for you: using the CRISCIA30 coupon, the first 30 days of subscription are free! There are 30 days to take advantage of all these advantages and become adept at reading wave forecasts. Let's sign?
Count on me if you have any questions about reading the forecast, and I'll help you! If you want to go even deeper, Surfguru has launched its own Wave Prediction Course, which is complete.
Here, I brought the basics of the basics, and in the course, you can learn everything, so you always have that sea that you consider classic!
See ya next time!
About me
Biologist, Photographer, Content Producer, and Community Builder. Please take a look at my introduction post to get to know me better.
My social networks:
- Personal Instagram – me, my husband, my cats, sustainability, biology curiosities, and adventures: @crisciacm
- Professional Instagram – surf, nature, and people photos: @crisciacesconettophoto
- Youtube Channel - surf videos: @crisciacesconetto
- My profile at Thatsgnar.ly - crisciacesconetto
- Twitter – Não sei o que fazer por lá, mas existe: @crisciacm
Português - BR [🇧🇷]
Você já chegou na praia, super animado pra surfar, chegou lá e o mar tava horrível? Pois é, quem nunca