How is the overall Bitcoin network doing these days? We have a new ATH these days. What about the activity on chain? Let’s take a look!
With this said let’s take a look at the Bitcoin network data, and how have these Bitcoin NFTs impacted the network.
We will be looking at: - Supply - Active wallets - Number of transactions - Hash rate - Fees - Miners revenue
The data presented here is mostly gathered from the blockchains charts.
Supply
The one thing Bitcoin is well known for. Its limited supply. There will ever be only 21M coins. Here is the chart with the current supply.
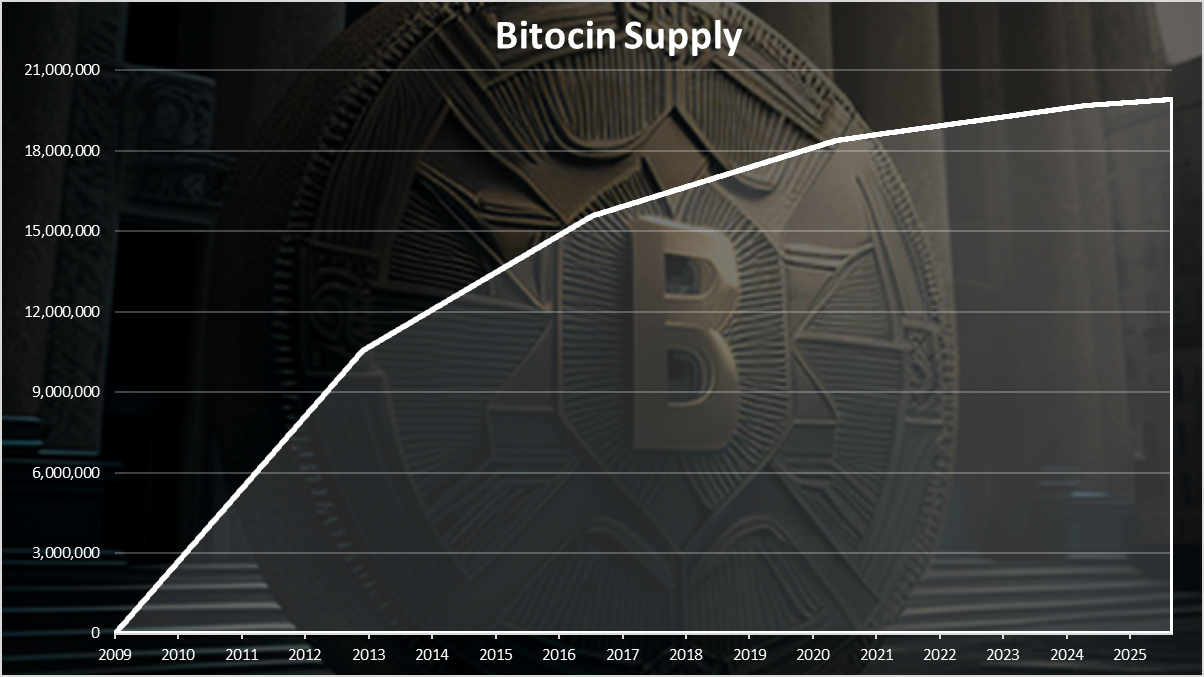
We can notice the breaking points on the chart. This is usually when the halving happens and the emission rate on Bitcoin is reduced. The past halving events and the block reward reduction goes like this: - November 21, 2012 from 50 to 25 BTC per block, - July 9, 2016 from 25 to 12.5 BTC per block, - May 11, 2020 from 12.5 to 6.25 BTC per block, - April 19, 2024 from 6.25 to 3.125 BTC per block, Four past halving’s with the latest one recently in April 2024.
At the moment the Bitcoin supply is at 19.9M or 95% of the supply is mined.
Active wallets
How many wallets are active per day on the Bitcoin network? Here is the chart.
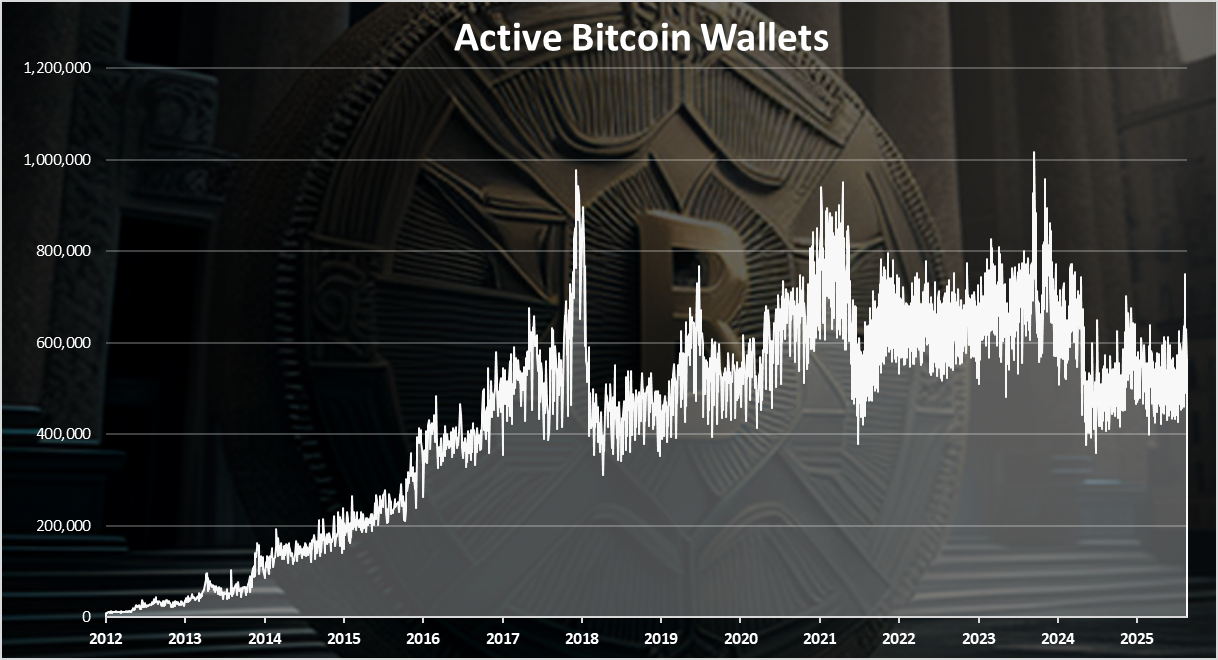
The record high numbers for active Bitcoin wallets per day was reached in September 2023 when the hype around inscriptions happened. There was just above 1M wallets for one day. Previously a long standing record was achieved back from December 2017.
In the last period there was a drop in the number of the active wallets around 600k per day. But in the very last days there was a spike close to 800k.
When we zoom in 2023 - 2025 we get this:
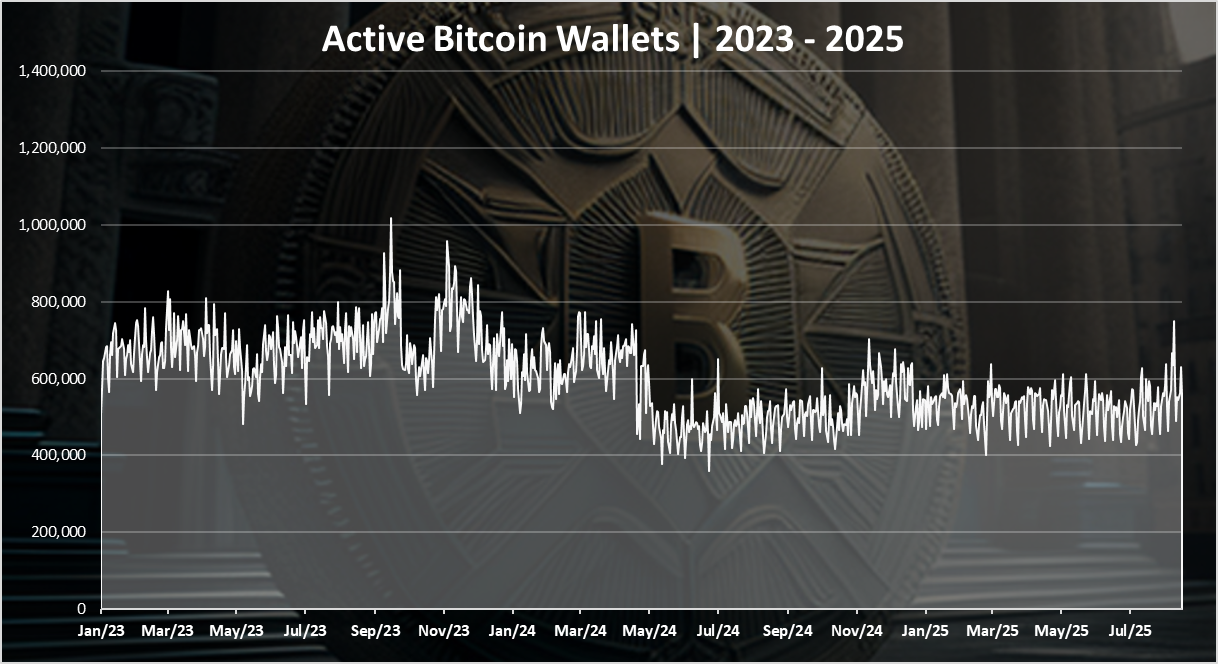
At first there was a steady number with around 700k active wallets, and then a drop in the summer of 2024. Since the summer of 2024 there was a small increase in the number of active wallets close to 600k per day. A spike in the very last days close to 800k.
Transactions
The activity on the network is mostly represented by the number of daily transactions.
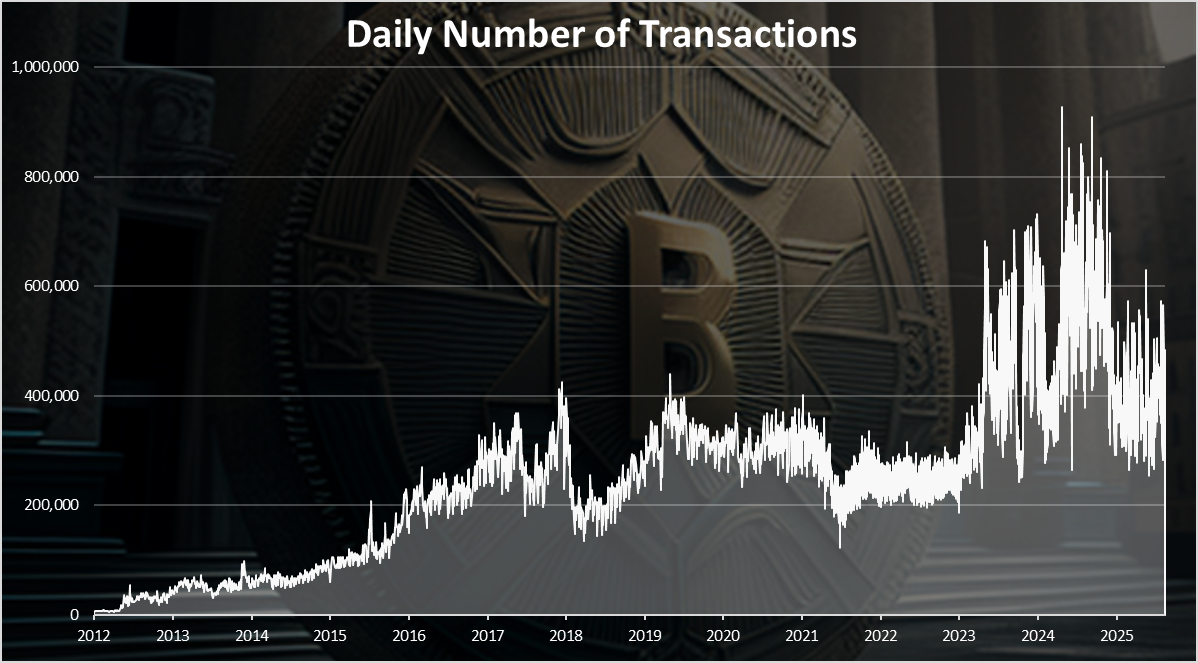
This is where most of the change in activity is visible on the bitcoin network. A spike in the number of transactions from under 300k per day to 800k per day in 2024. A new ATH for the number of transactions.
This chart is the most telling about the impact that the Bitcoin NFTs have on the network. There is a lot of volatility in 2023 and 2024 in terms of transactions depending on the inscription hype. In the second half of 2024 the trend died out and there is less transactions now. On average around 400k transactions daily. In 2025 the number of daily Bitcoin transactions has been in the range of 400k to 600k. Not very impressive having in mind we hit a new ATH in 2025.
Hash Rate
The ultimate Bitcoin value is the network stability and security. The network security in a proof of work chains is measured in hash rate, or how difficult is to mine. The bigger the completion, the higher the hash rate.
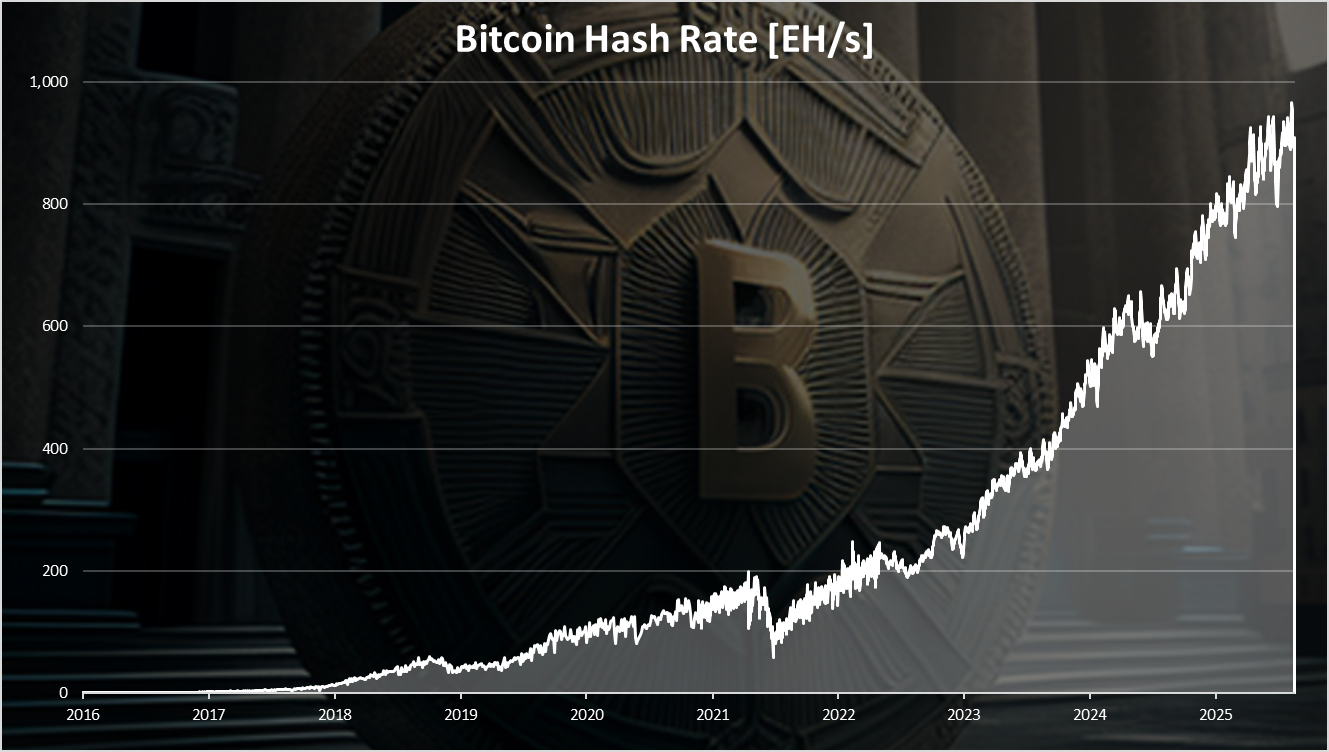
Almost constantly going up with few dips here and there. The most significant dip happened in the summer of 2021 when China banned mining. We can see yet another one just happened recently at the end of 2022, but recovered since then and continue to grow massive to another ATH for the hash rate. A small dip again and after the halving in 2024, but a very fast recovery since then.
We are now at 900 EH/s and growing. Very close to 1000 EH/s now, on occasions reaching that level on an hourly basis. That is EXA Hash, a number with 18 zeros.
Fees
A bit unpopular topic the fees.
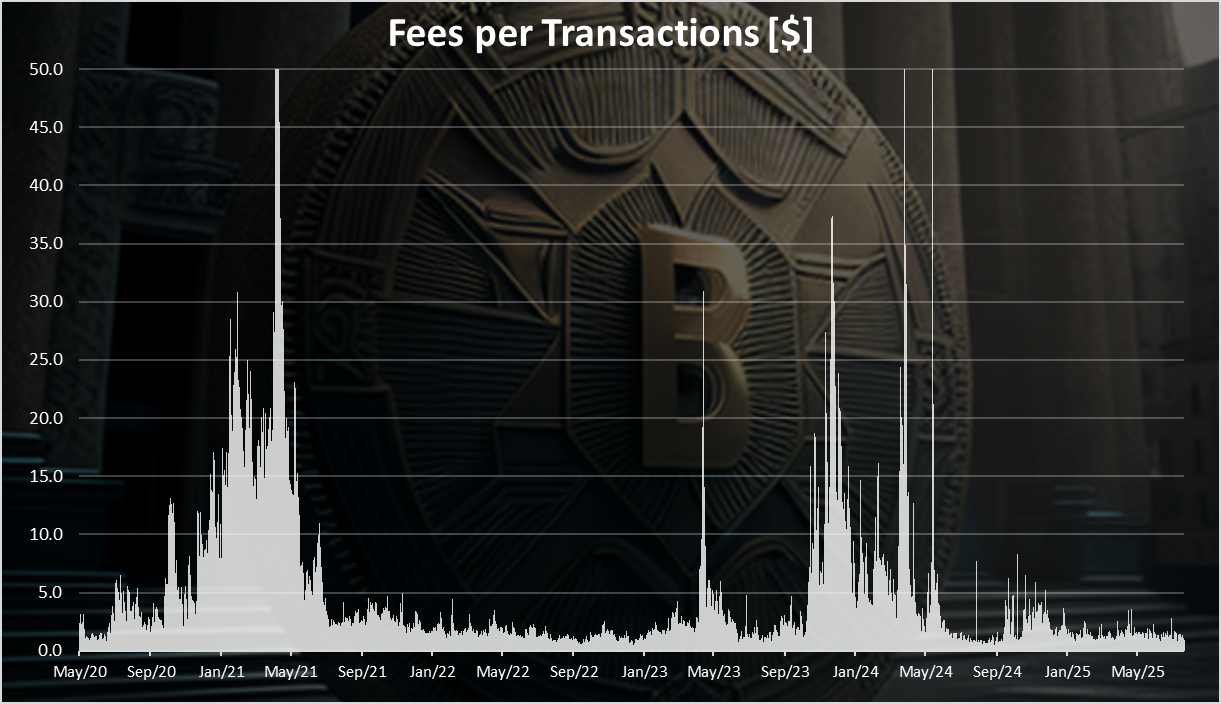
A two visible spikes in the chart starting from 2020 till today. First back in 2021 during the bull market the fees spiked to 50 USD per transaction in April 2021. Then they dropped to a few dollars per transaction during the bear market in 2022. A recent spike again in 2023 caused by the second layer development on BTC. A peak towards the end of 2023 to a $35 per transaction, still lower than the previous bull market. In the last period the fees have dropped again to around a dollar per transaction. With the latest fees the miners are getting somewhere between 40M to 50M per day, more than 1B per month.
Note that unlike the smart contract chains like Ethereum and all the others, that have different type of transactions, like transferring ETH, transferring other tokens like USDT, executing smart contract action like Uniswap trade, etc. Bitcoin has only one type of transaction, transferring coins, and from time to time some inscriptions (notes).
Hash Rate VS Price
When we plot these two together, we get this.
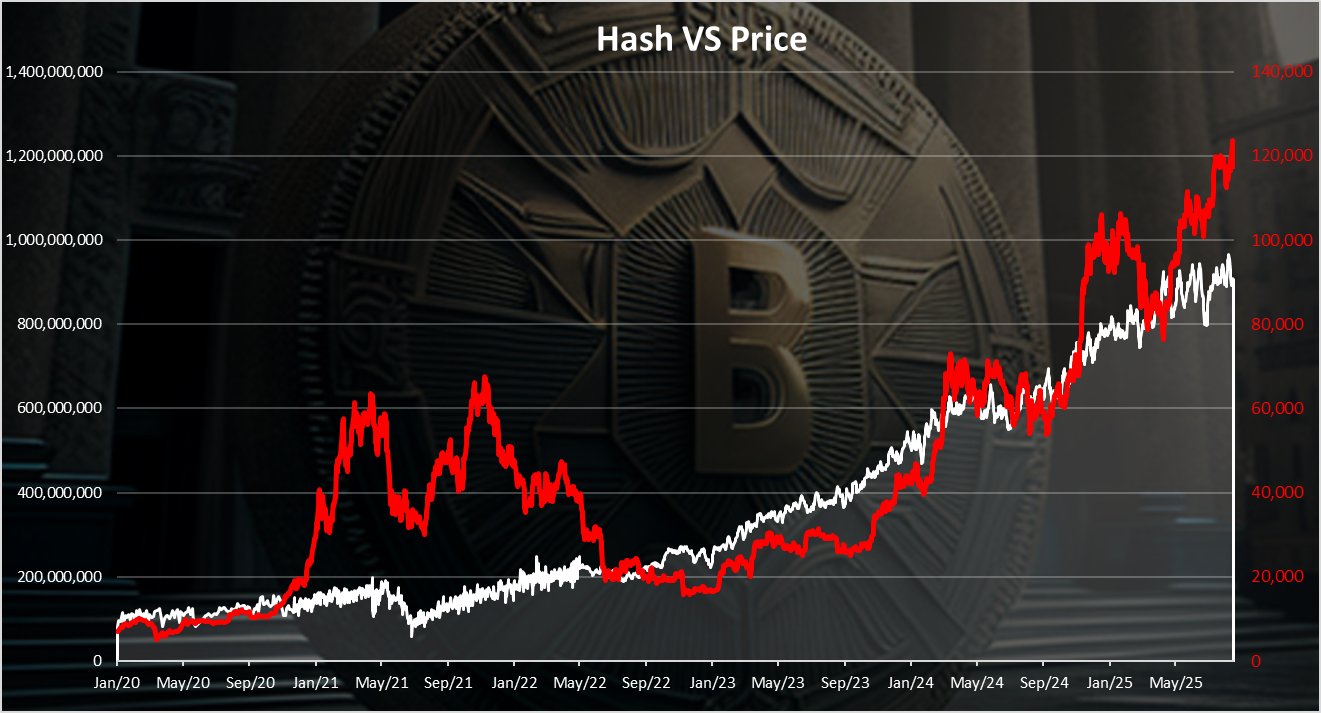
Unlike the price the hash rate has been constantly growing. Although we can notice an obvious correlation, especially back in 2021, when the price increased, shortly after so did the hash rate, but at a lower rate.
At the end the chart for the Bitcoin yearly candles on logarithmic scale:
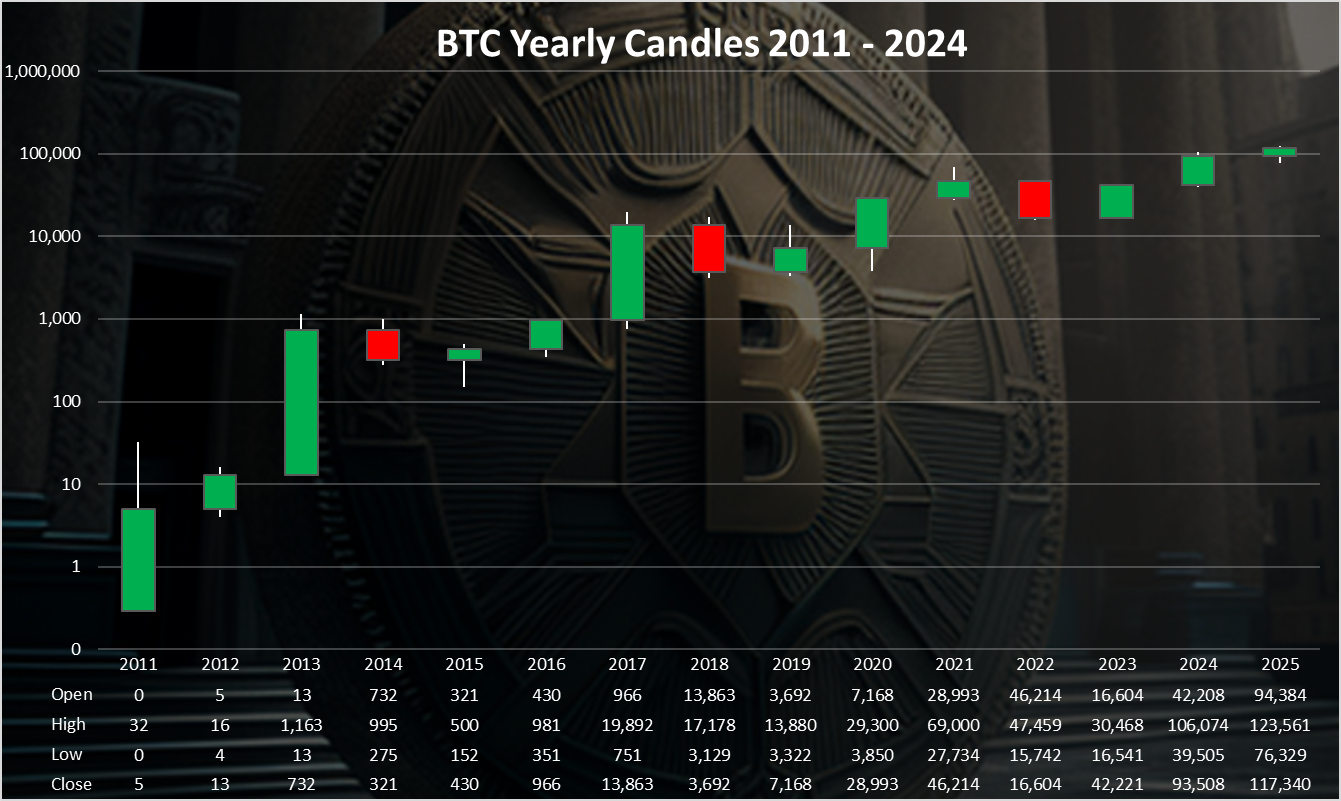
Three green ones, one red 😊. In the last cycle the red one was in 2022, with two green one for 2023 and 2024. If history repeats 2025 should have the biggest green candle.
Overall not much increase in activity despite the new ATH. This tells us that the price is not driven by retail, bu from institutions. Few big players, not the many. The hash keeps going up, and the price is setting its 3rd year in a row a green candle. How big will it be, remains to wait and see.
All the best @dalz