In the last decade, Bitcoin has evolved from a speculative asset to a totally new asset class that is now recognized by institutional investors. The price volatility still remains but it has been going down significantly in the last period and increasingly the Bitcoin price started to behave like some of the traditional markets, especially the tech companies. How does Bitcoin’s price behave in relation to traditional financial markets? Does Bitcoin act as a hedge like gold, or is it more closely linked to equity markets like NASDAQ? Another important metric that has emerged in correlation with Bitcoin is the global liquidity supply (money), aka money printing. Bitcoin has been especially sensitive to the money supply.

Here we will explore the correlation between Bitcoin’s price and three key indicators of traditional markets: - the NASDAQ index, - gold, and - global liquidity supply (M2 money supply).
Bitcoin vs NASDAQ: A Tech-Companies Correlation?
NASDAQ is one of the most important stock market indices, representing a large portion of the tech-heavy sector in the United States. Given Bitcoin's rise among retail investors and its popularity as a "tech" asset, it has started to behave a lot like NASDAQ. After all, both are volatile and often affected by similar factors such as macroeconomic trends, interest rates, and investor sentiment.
In the following chart we will take a look at Bitcoin vs NASDAQ price movements over time for the period of 2014 to 2025.
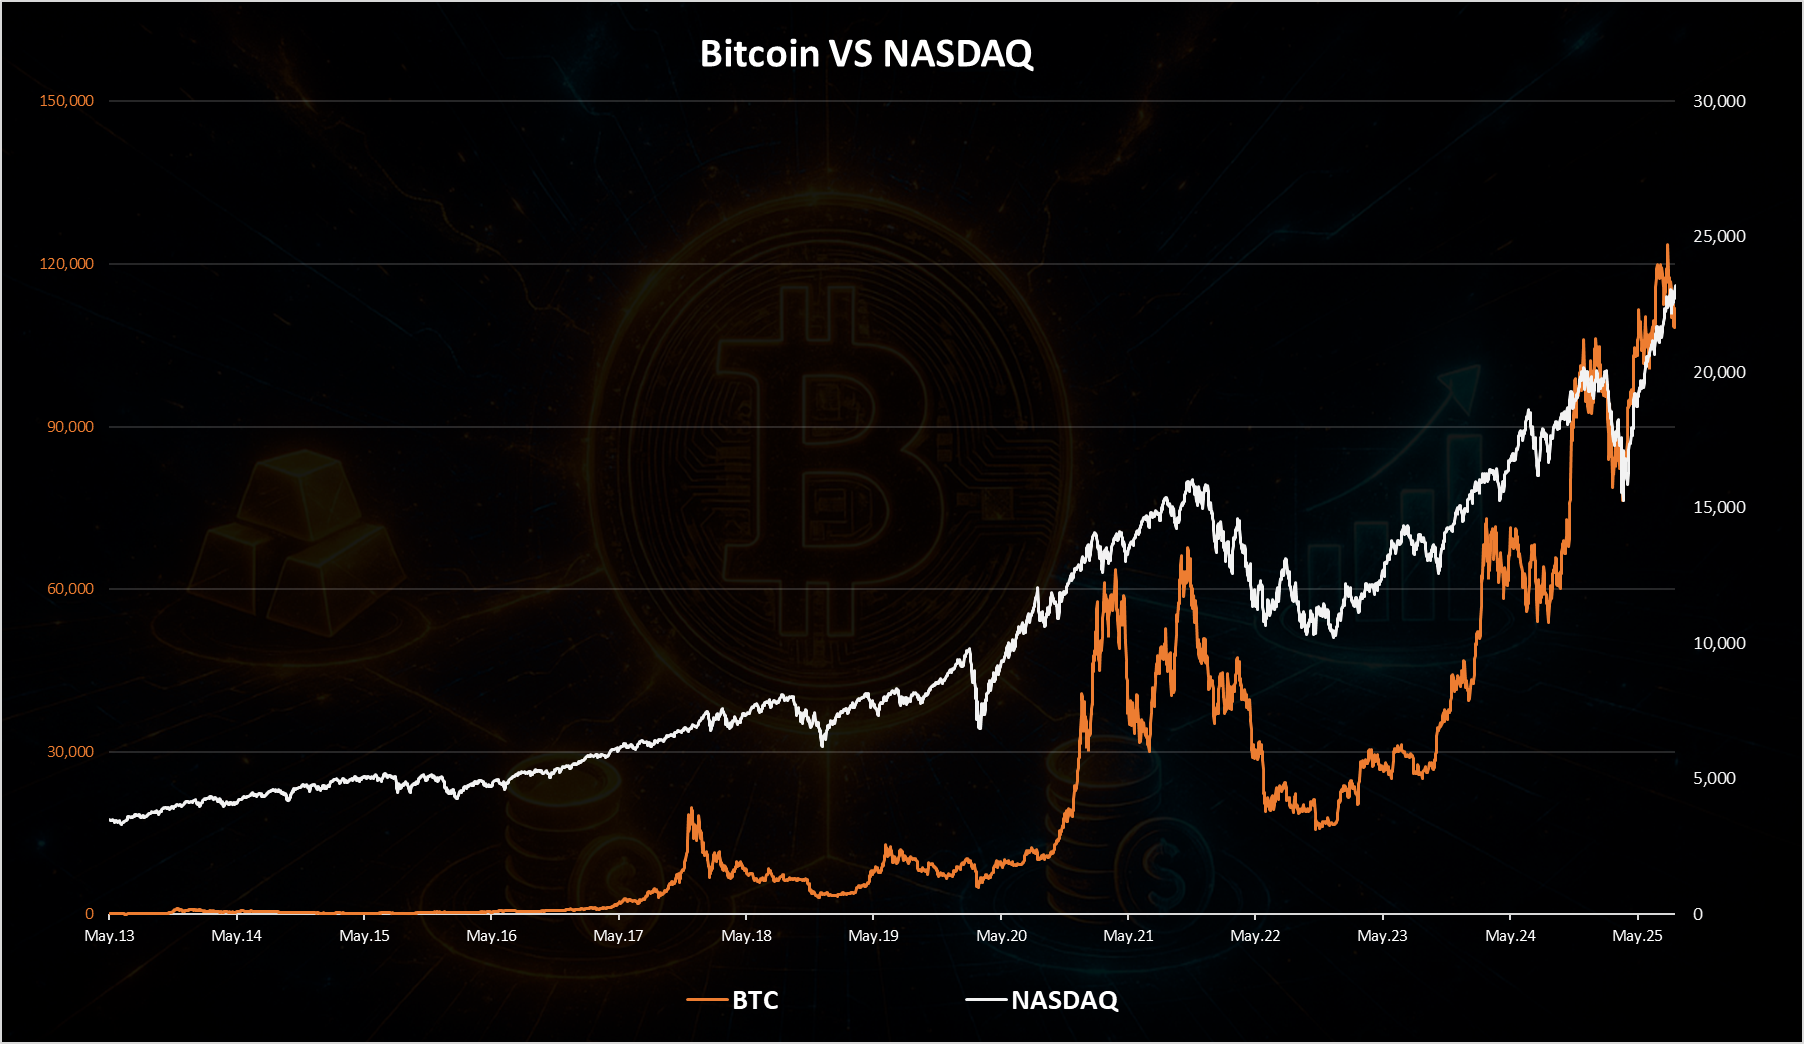
The above is the chart for the prices of the both assets. It is a chart with double axes values with BTC price on the left and the NASDAQ value on the right.
From observing the price of the two we can see that there is some correlation, especially in the second half of the chart starting from 2020 up to 2025. Both assets seem to peak in 2021 and then dropped in 2022 with Bitcoin with stronger moves on both sides. Since then, we can notice the recovery in 2023 and 2024, both assets increased in value. We can also notice at the very end of the chart, in April 2025, the sharp drop and a pull back for both with Bitcoin recovering even faster than NADAQ. This was when the tariff war happened.
Pearson correlation coefficient!
This coefficient is used to measure a correlation between two values. It is in the range of -1 to 1. A positive correlation indicates that Bitcoin and NASDAQ tend to move in the same direction, while a negative correlation suggests the opposite. The coefficient value can range from -1 to 1, where 1 is a perfect positive correlation, 0 is no correlation, and -1 is a perfect negative correlation. Here is the chart for this coefficient for BTC and NASDAQ.
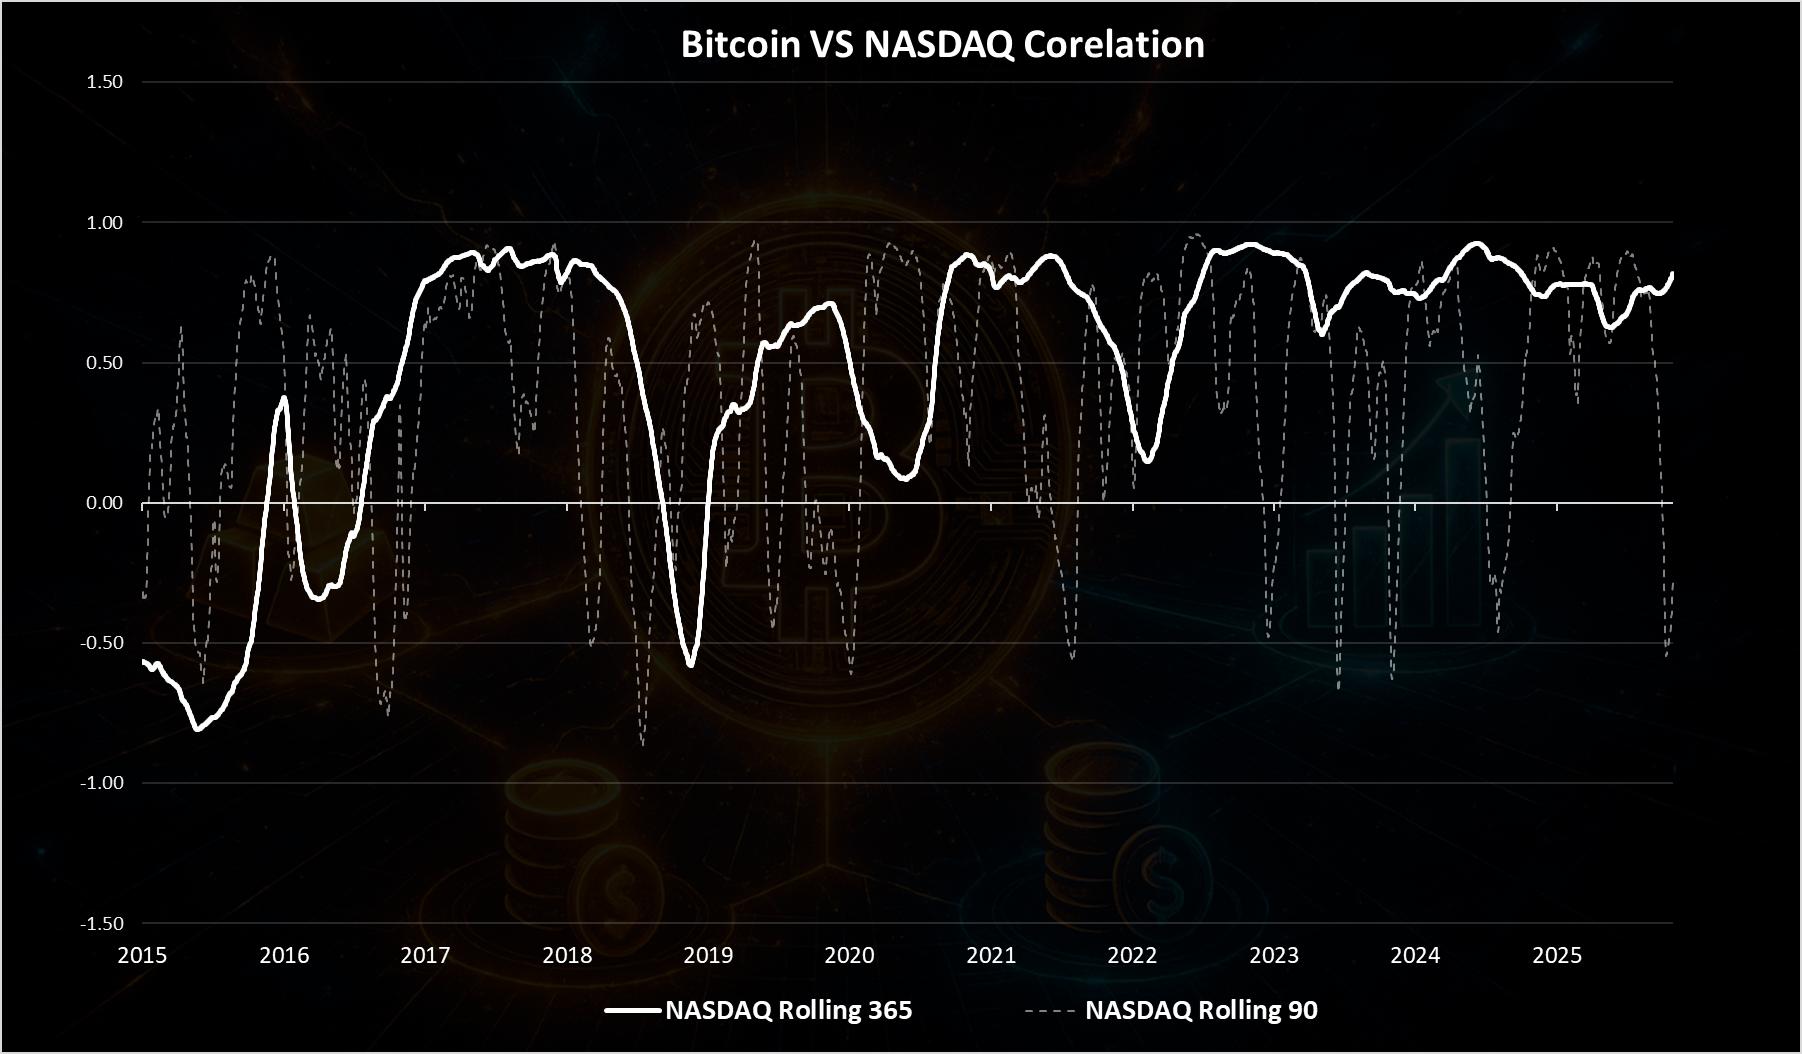
The strong white is a one year rolling coefficient, meaning it is based on the past year’s performance of the two assets, while the doted pale is the 90 days coefficient. We can notice that the short term is much more volatile. For the purpose of this analysis, we will focus on the yearly one.
We can notice that the last time these two moved in opposite direction was back in 2019. Since then, the two are moving in the same direction, but with different intensity. There was a drop in the coefficient in 2022 from 0.8 to 0.15. Since then, it recovered and the two have been highly corelated in the range of 0.7 to 0.9. In the very last period, we can see a small drop again in the correlation.
Bitcoin vs Gold: Analog VS Digital Money
Gold has long been regarded as a safe haven asset, especially in times of economic instability. As inflation fears rise, gold traditionally becomes more attractive. Bitcoin has been called the digital gold but with significant differences in its volatility. In the following chart we will take a look at Bitcoin vs Gold price movements over time for the period of 2014 to 2025.
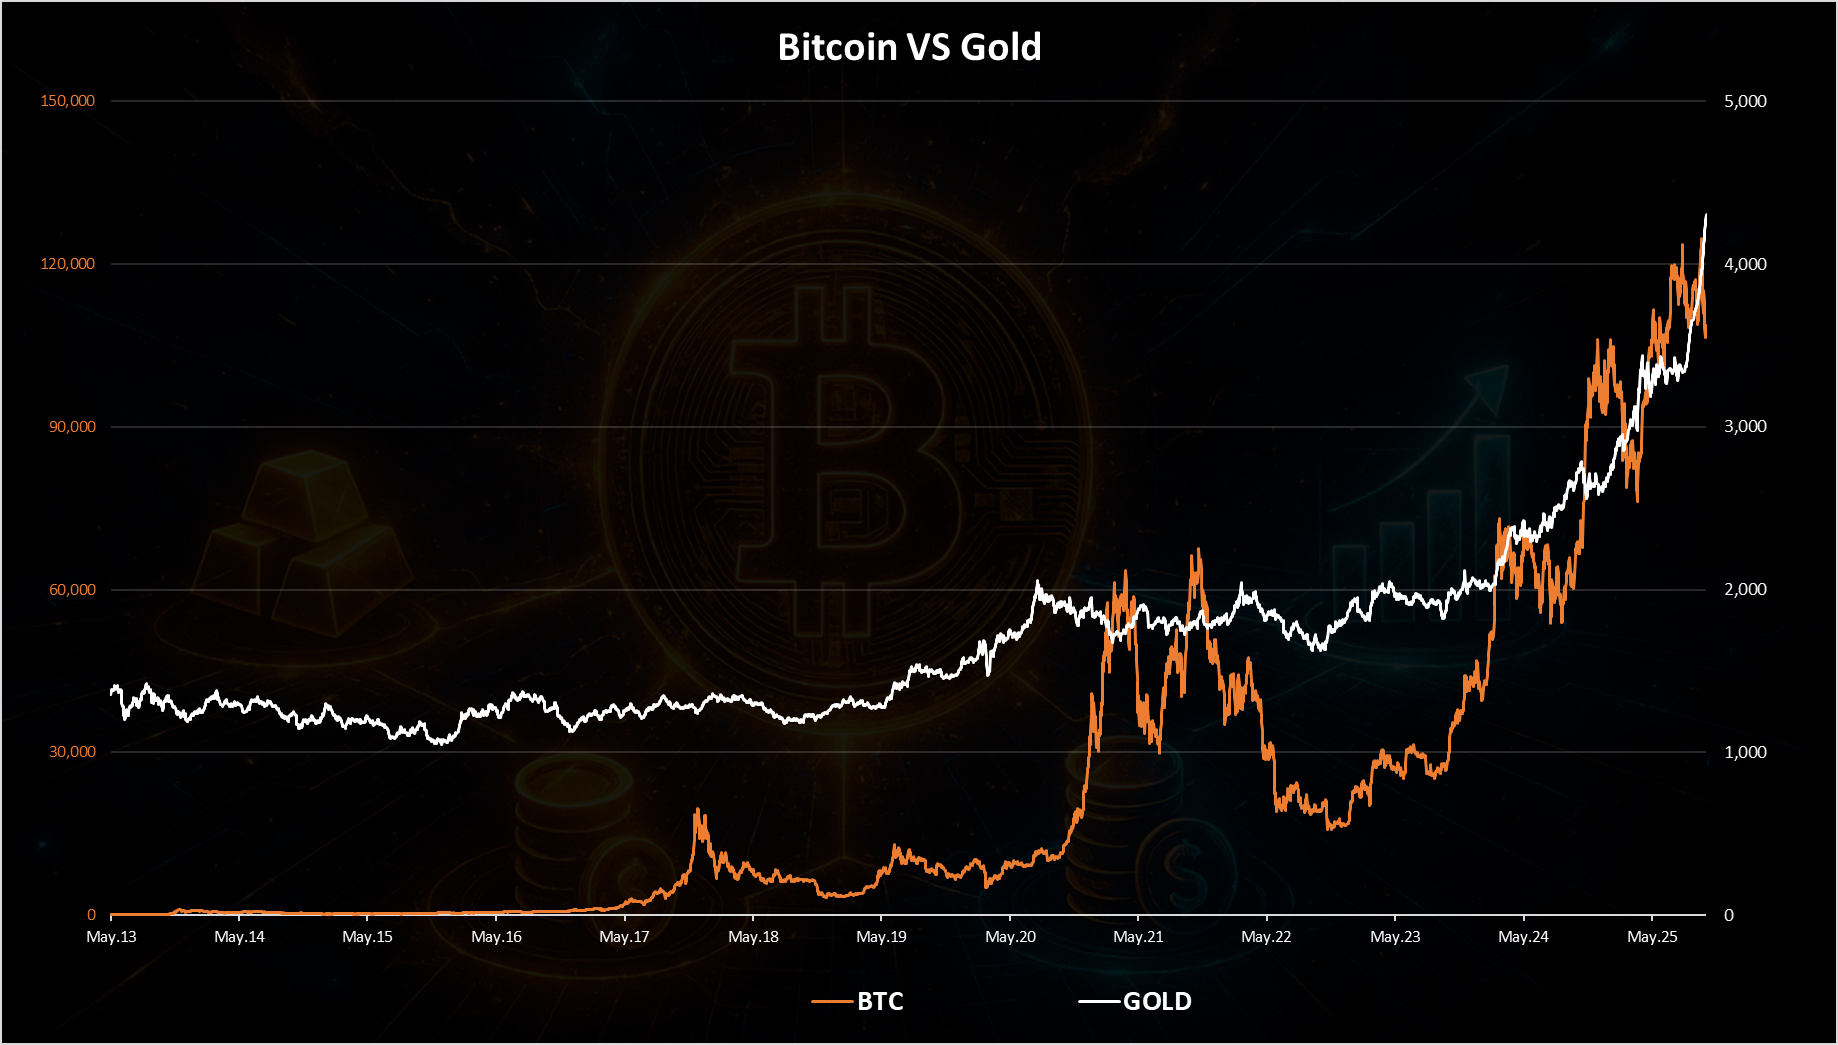
A much smoother ride for Gold in this period. Although it has stayed relatively stable for a long period around 1300 USD, then it has increased in 2020, closing on 2k and it went parabolic in the last months and reached new ATH with more than 4k. For Bitcoin we can see the peaks in 2017, then in 2021 and again recently 2024-2025. From the chart above we cannot see a clear correlation between the two, except maybe for the last year when both increased a lot in price.
Pearson coefficient for BTC VS GOLD Here is the chart for the coefficient for these two.
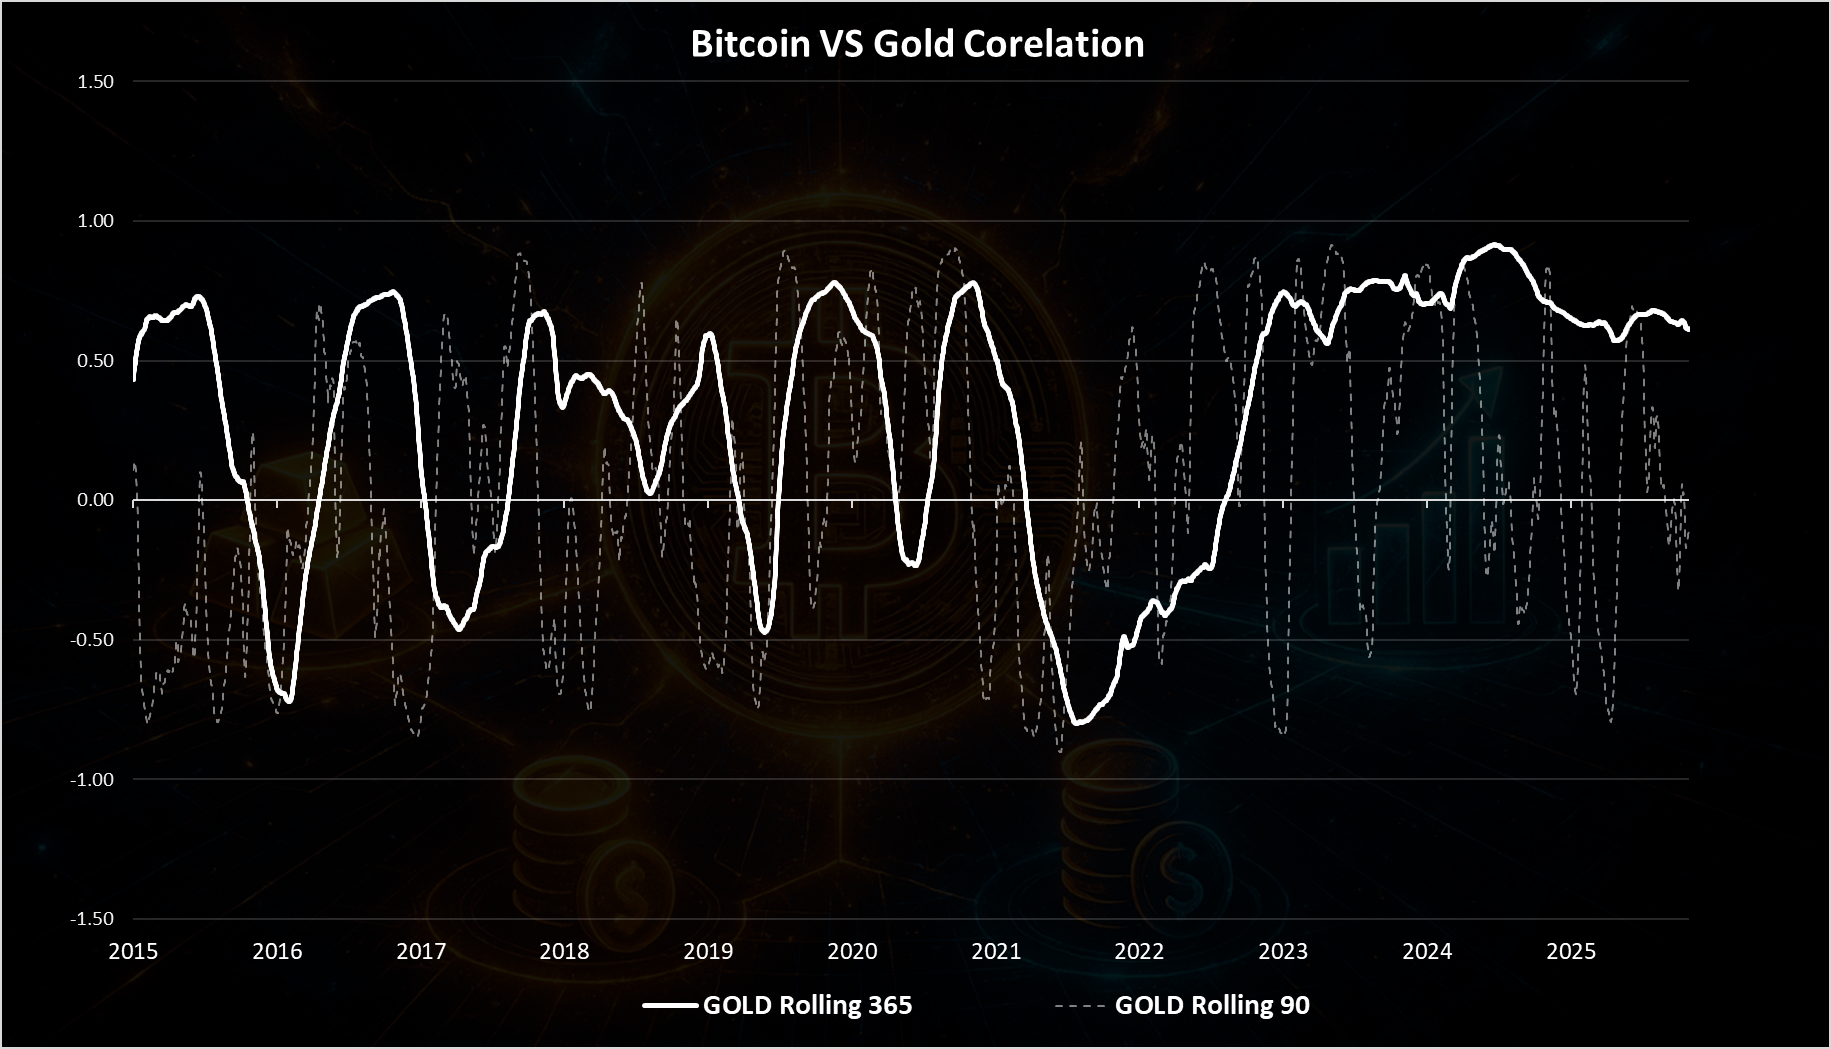
A very volatile first half of the chart, with no clear patterns up to 2020. This is understandable since Bitcoin is still new in the period.
Since 2020 we can see a drop at first and even negative correlation in 2022, when BTC was falling and GOLD rising. But interesting since 2022 both of the assets have started moving in the same direction and with higher correlation. In the very last period, there is a somewhat slow drop in the correlation between the two from 0.9 to 0.6 at the moment. Somewhat similar pattern for BTC in terms of the correlation as for the NASDAQ. More established pattern after 2020, a drop in 2022 and closer correlation in 2023 to 2025, with a slight decline in the last months of 2025.
Bitcoin vs Global Liquidity Supply: How Money Printing Affects Bitcoin
This is something that most of the Bitcoiners are calling for. Whenever the money printer is turned on, Bitcoin increases in price. Some have even said that Bitcoin is now an index for global liquidity.
Let’s take a look at the chart. First the data for the Bitcoin price and the global liquidity, or M2 as it called for short.
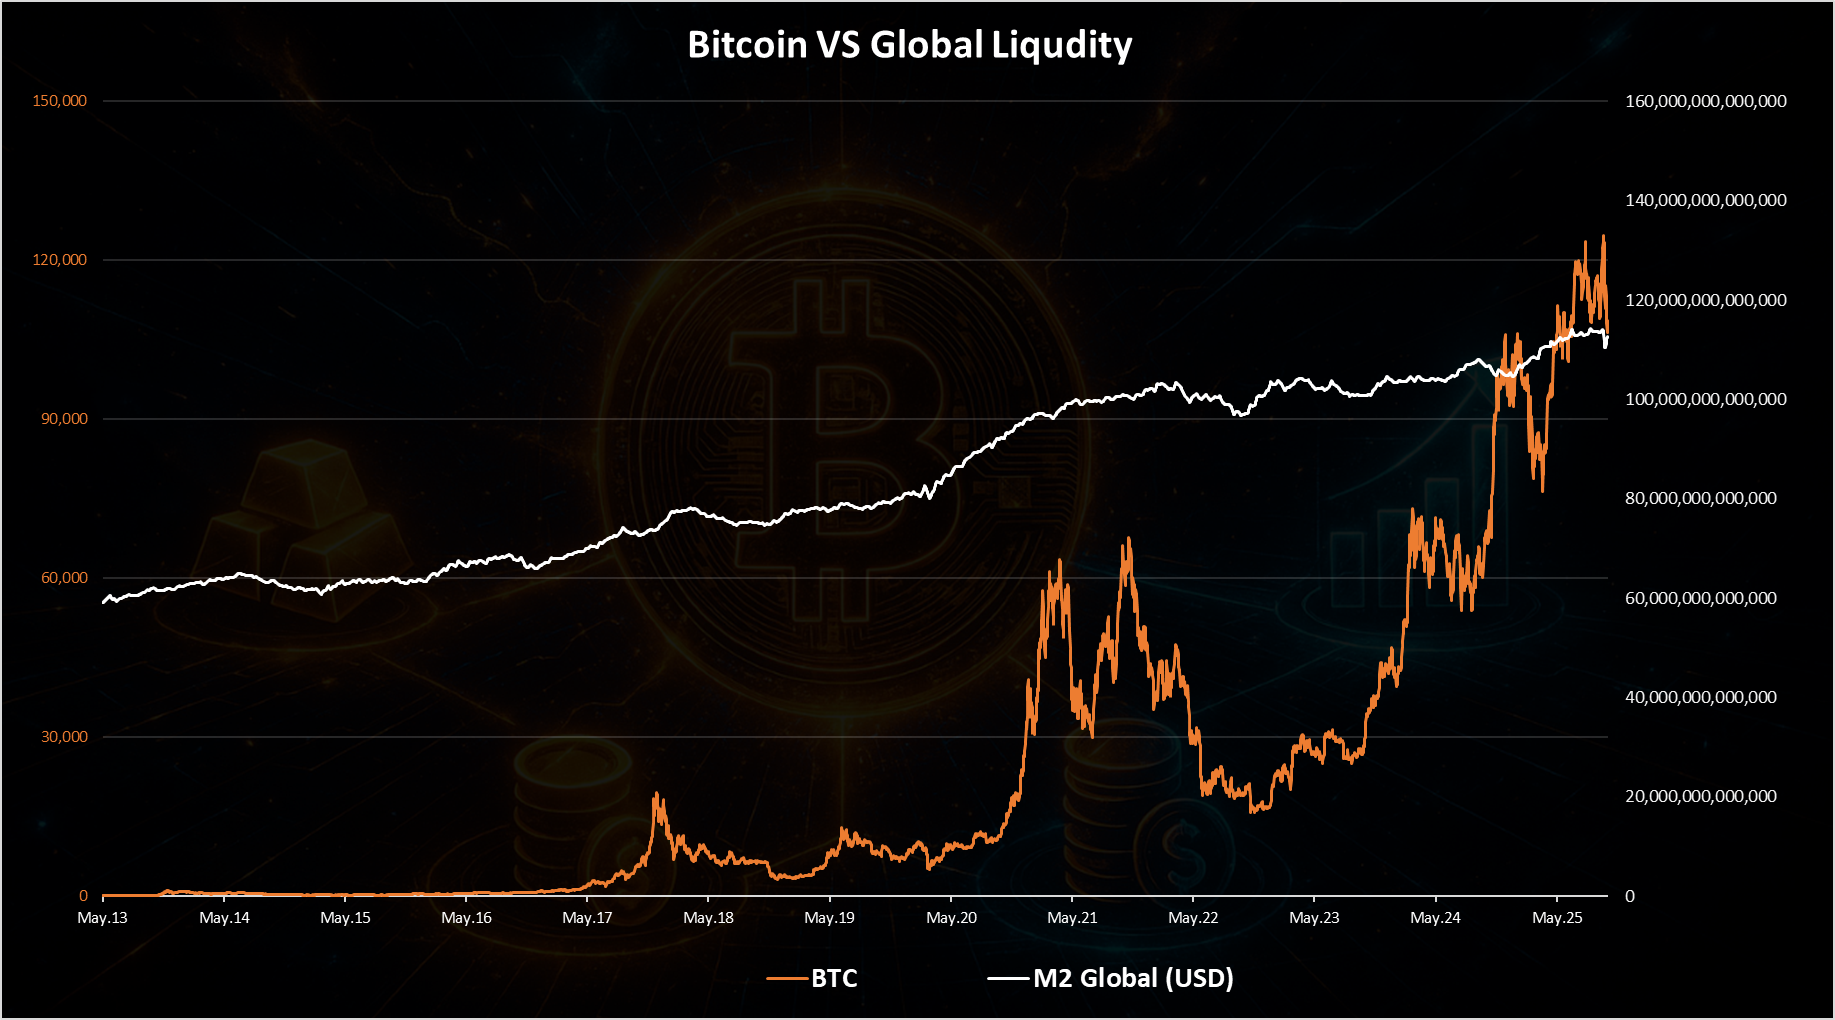
From the first glance at this chart, we can notice that there might be some correlation in the previous bull market when the global liquidity started growing in 2020 and increased from 80T to 100T in less then a year, and Bitcoin went up in price. In the next period, especially in 2022 there was a drop in the liquidity and Bitcoin dropped a lot. A slight recovery since then in the liquidity, but not by much and we are now at 112T, while Bitcoin has increased in price much more, even with a slight increase in liquidity.
Pearson coefficient for BTC VS M2 Here is the chart for the coefficient for these two.
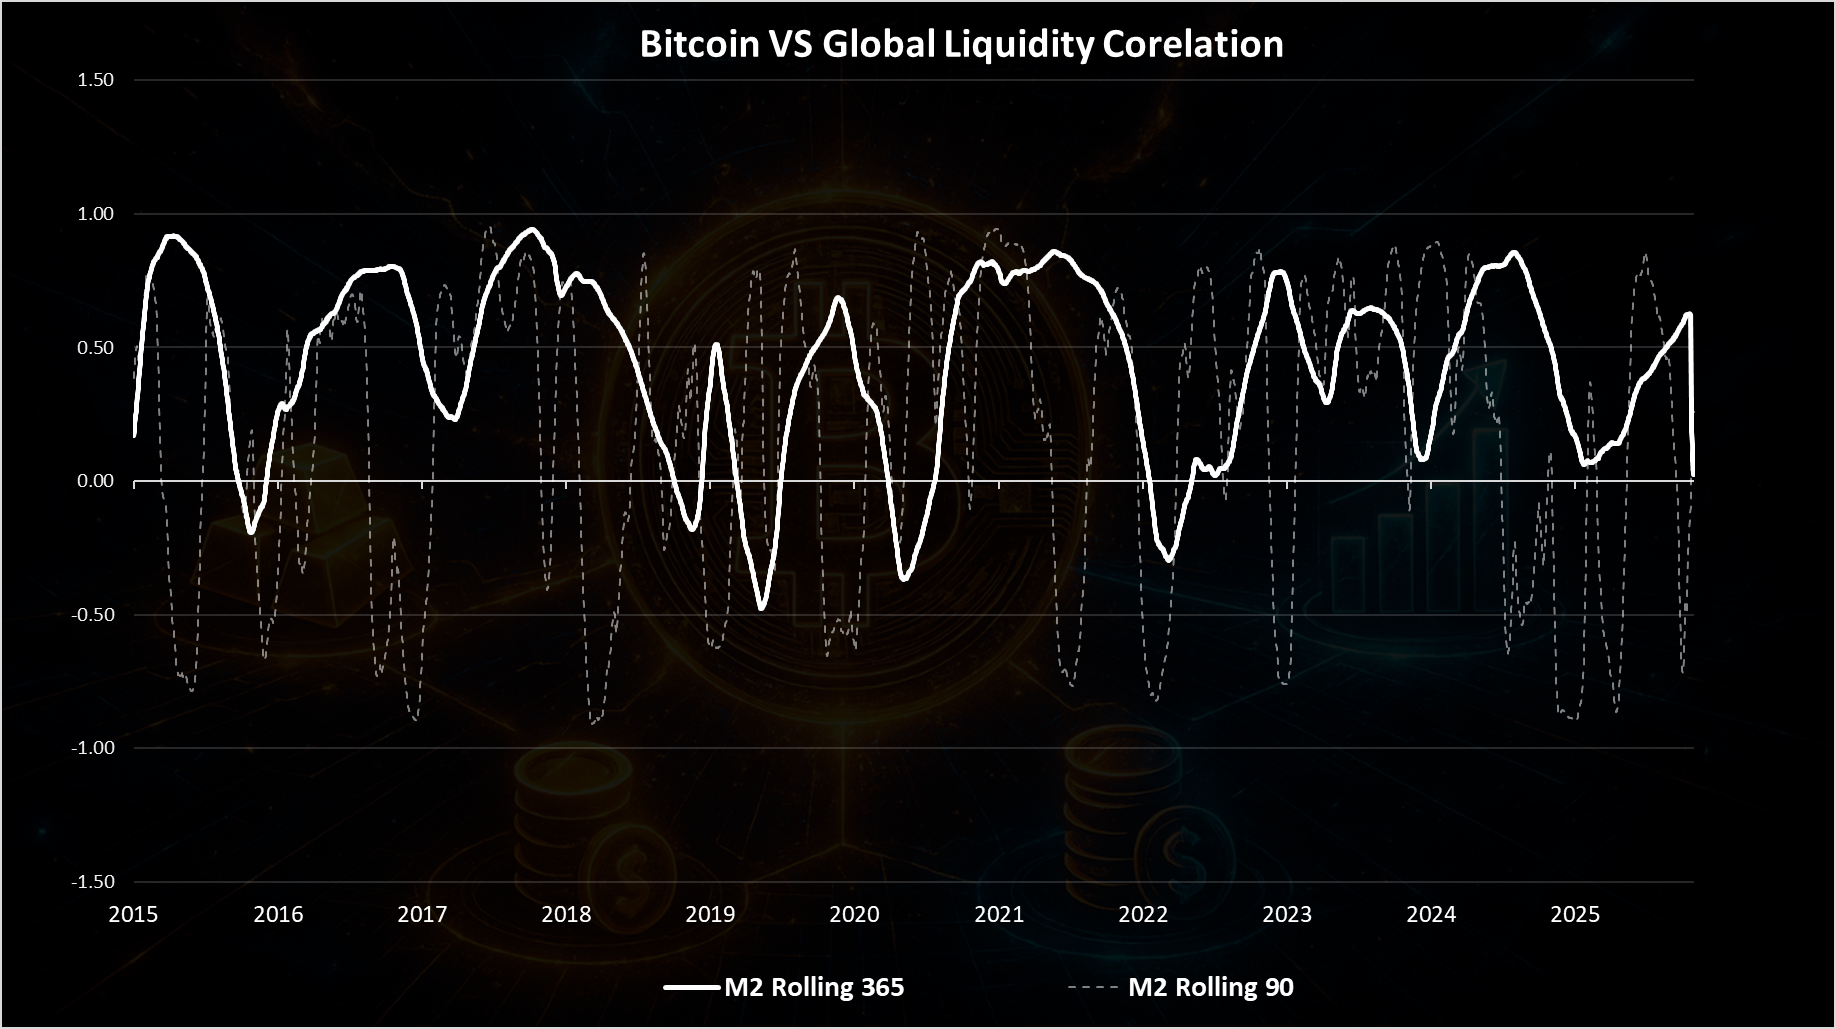
There is a lot of volatility here. Back in 2020 and 2021 there was a period when the correlation was high for a longer time, almost two years, but since then it has been on a roller coaster again with no clear signs in long term correlation. Back in 2024 the correlation increased for a while when the liquidity was growing and so was the Bitcoin price, but it dropped afterwards. While many of the macro analysis are calling for a Bitcoin liquidity index, this obviously is not the case, at least not yet. There is no clear established pattern between the two. From time to time the two can move in the same direction and have high correlations, but it’s usually short lived. Maybe this will change going forward but for now it’s not the case.
Bitcoin Correlations
From the above charts we can notice that some patterns started emerging after 2020 and mostly for the yearly rolling window correlation. The short 90 days are still volatile. When we plot all the three major assets for the period of 2020 to 2025 and only on a yearly basis we get this.
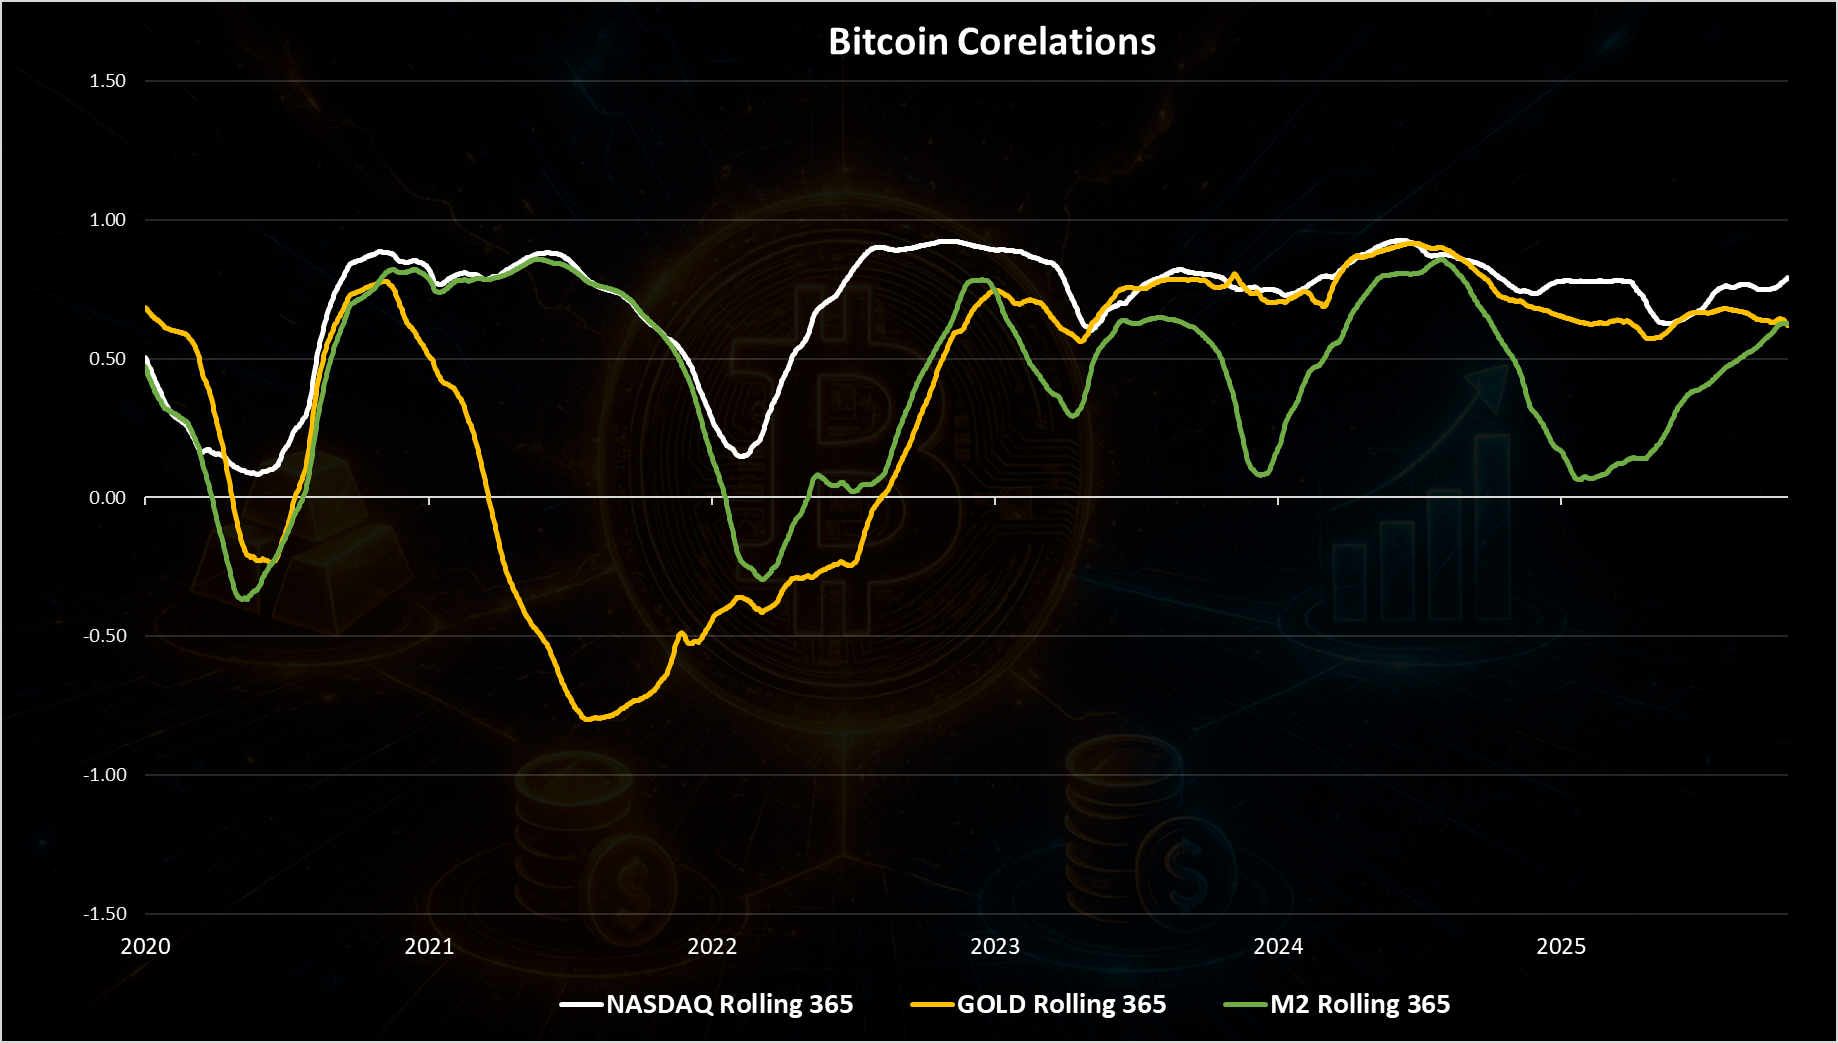
At high level overview for the last five-year period, Bitcoin is obviously mostly corelated with NASDAQ. Investors have been treating Bitcoin as another tech stock in the period. It’s probably expected.
In the very last two years the correlation with GOLD also increased and in the last two years Bitcoin has been closely corelated with both GOLD and NADAQ. This is a bit controversial because tech stocks are usually a risk bet, while GOLD a safe bet, so an asset can not be both. But in this time window the two have acted in a similar way, and Bitcoin has shown a correlation with the two of them. Long term these two will diverge and so will Bitcoin. We can also notice that in the last year the correlation between the two has started going down, from the range of 0.8 to 0.9, to 0.6 to 0.7. But this is in the very last period. Will this be a sign for a decoupling of Bitcoin against other assets, especially against NASDAQ it remains to be seen. It’s still early. In terms of correlation with the global money supply, there are no clear patterns yet, even though some macro analysts are calling for this. Maybe it is the case, but more data is needed for this to be confirmed.
All the best @dalz