How is the Ethereum network doing these days? After a long period of loss against Bitcoin, in the last few months ETH has shown some strength, and it is now close to its previous ATH. Still haven’t reached it previous ATH though. On the other hand, there is now more competition in the space like Solana, BSC, SUI etc that are taking market share. Since the PoS update the inflation for Ethereum is reduced by 90%, from 4.3% to 0.43%. Additionally, part of the ETH for transactions is burned, that pushed Ethereum into deflationary territory. Meanwhile, the share of staked ETH kept on growing drying up the liquid ETH supply.
Let’s take a look.
Here we will be looking at: - Overall Supply - Number Of Wallets - Active Wallets - Transactions - Fees - Staked ETH - Contracts
The data presented here is mostly gathered from the etherscan charts and Dune Analytics.
Supply
The overall supply now looks like this:
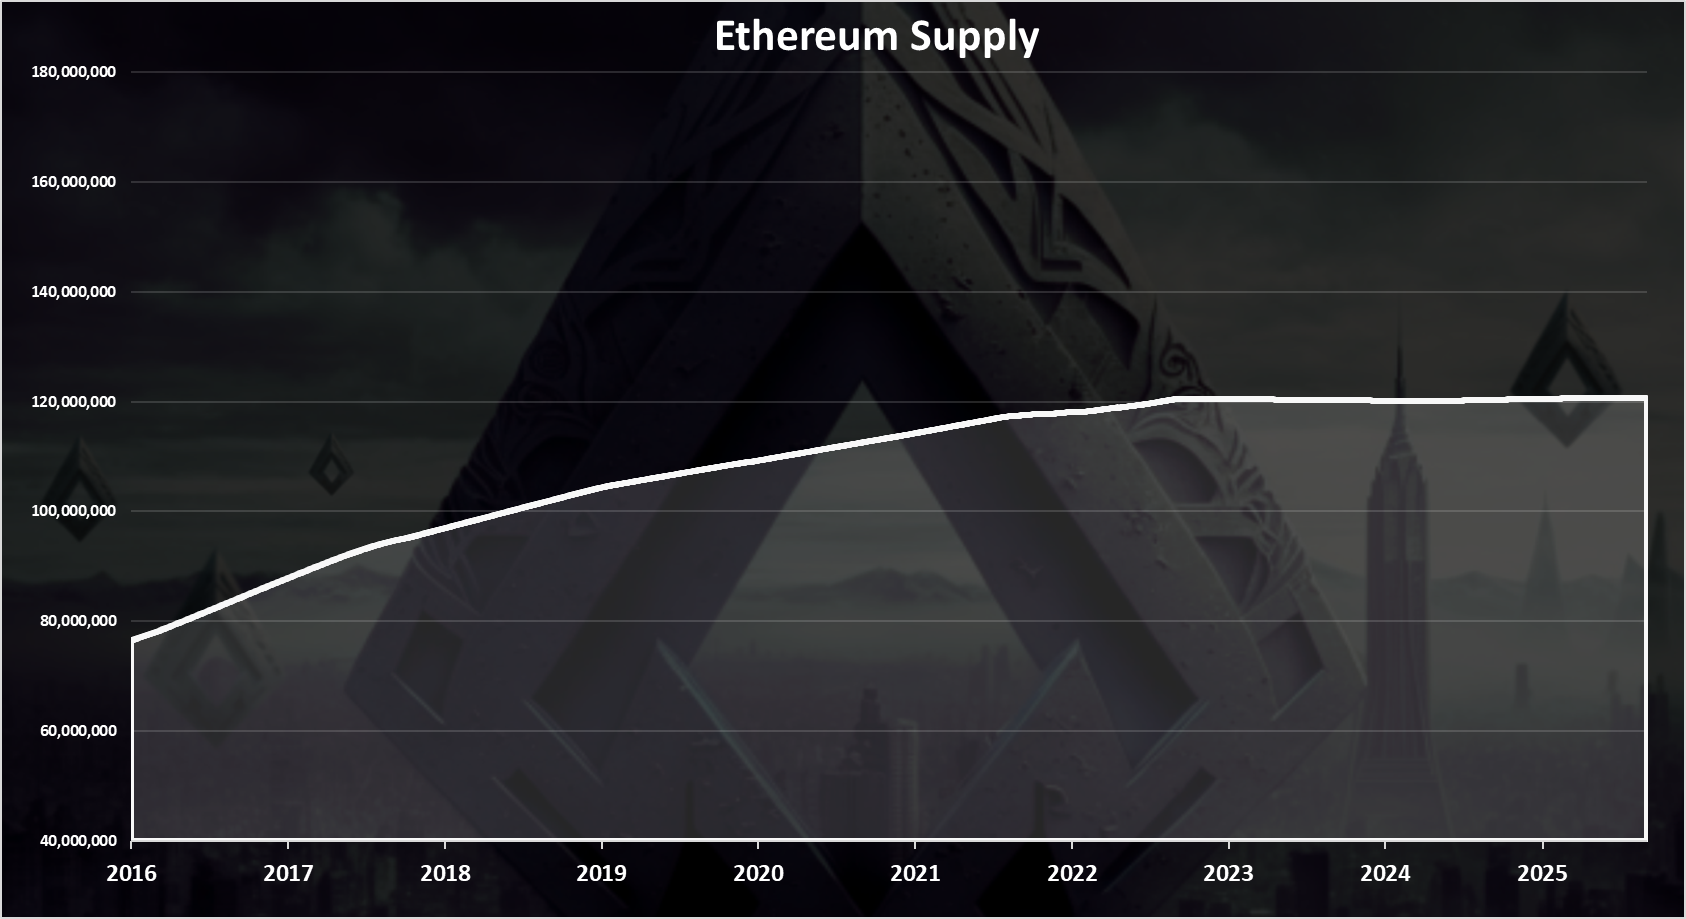
A steady increase in the supply from just above 70M in 2015 to 120M where we are now. We can see that in the last period after the merge, the supply has been almost stagnant and even dropped a little.
Ethereum Supply After the Merge
The chart for the new ETH issued after the merge and the transition to proof of stake looks like this.
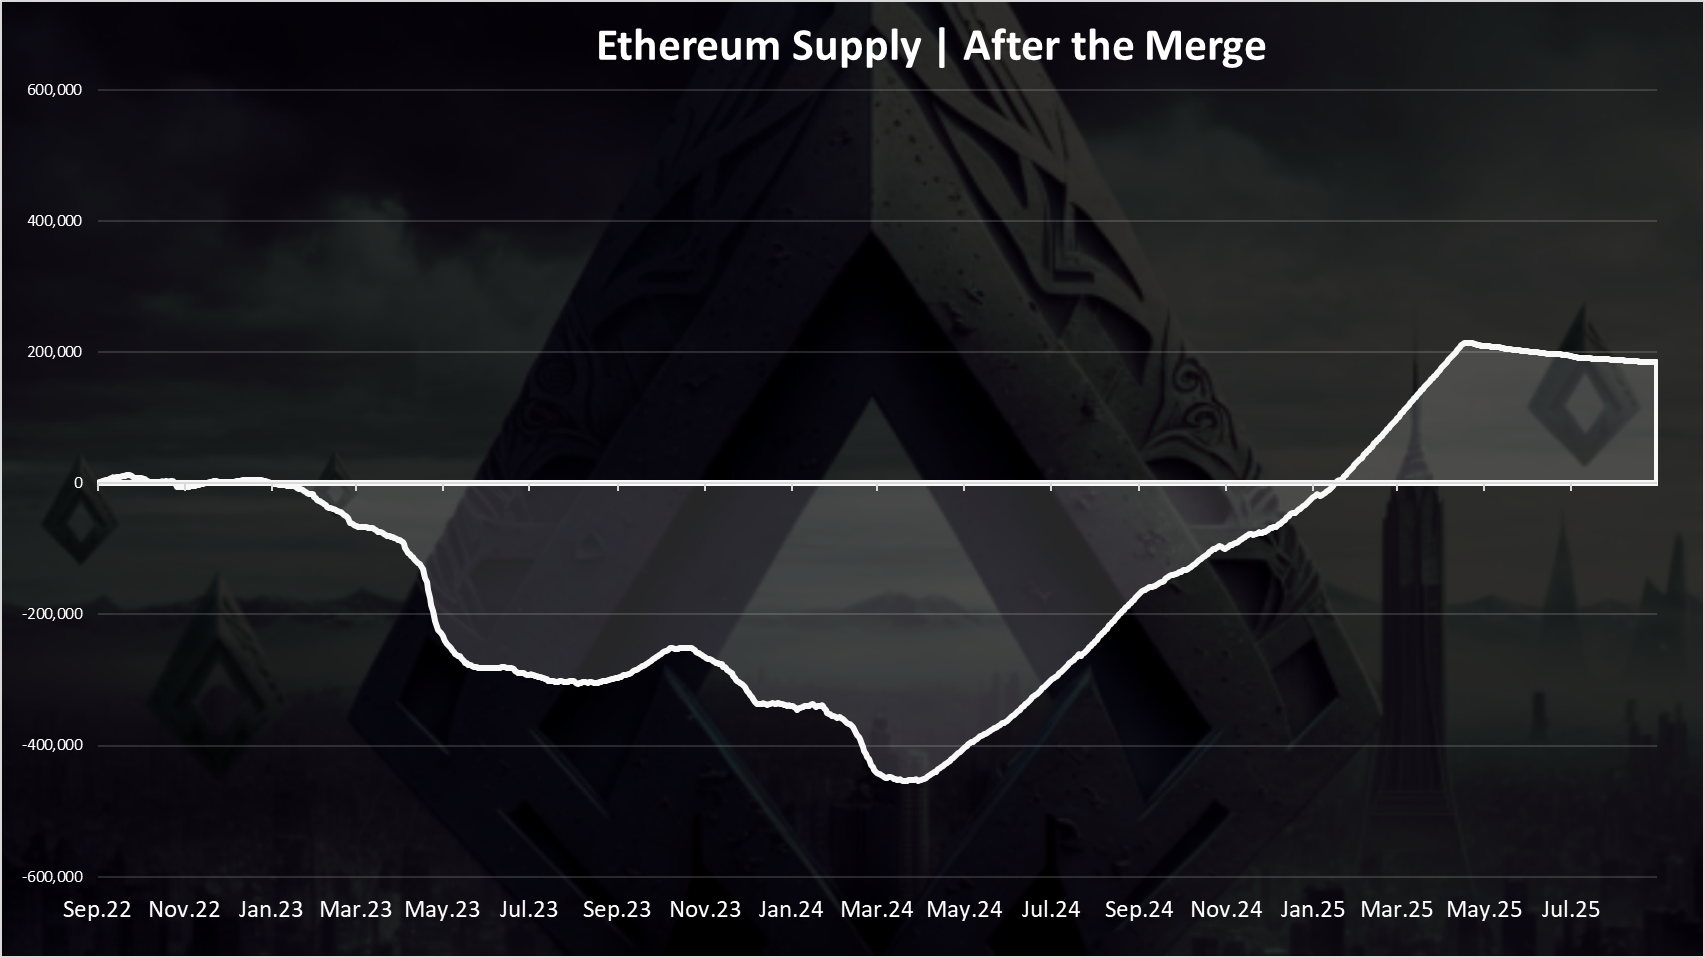
At first the inflation went down and from September 2022 to March 2024 it has reduced the ETH supply for more than 400k ETH. Then since April 2024 up to May 2025 the supply has been growing due to low activity on chain and not burning enough ETH and has increased for 600k ETH, or cumulative 200k more in the period.
Since May 2025 the ETH supply has been going down again, but in much moderate rate and as mentioned, when we look at the big picture the ETH supply is almost constant in the last period.
The table for the yearly inflation looks like this.
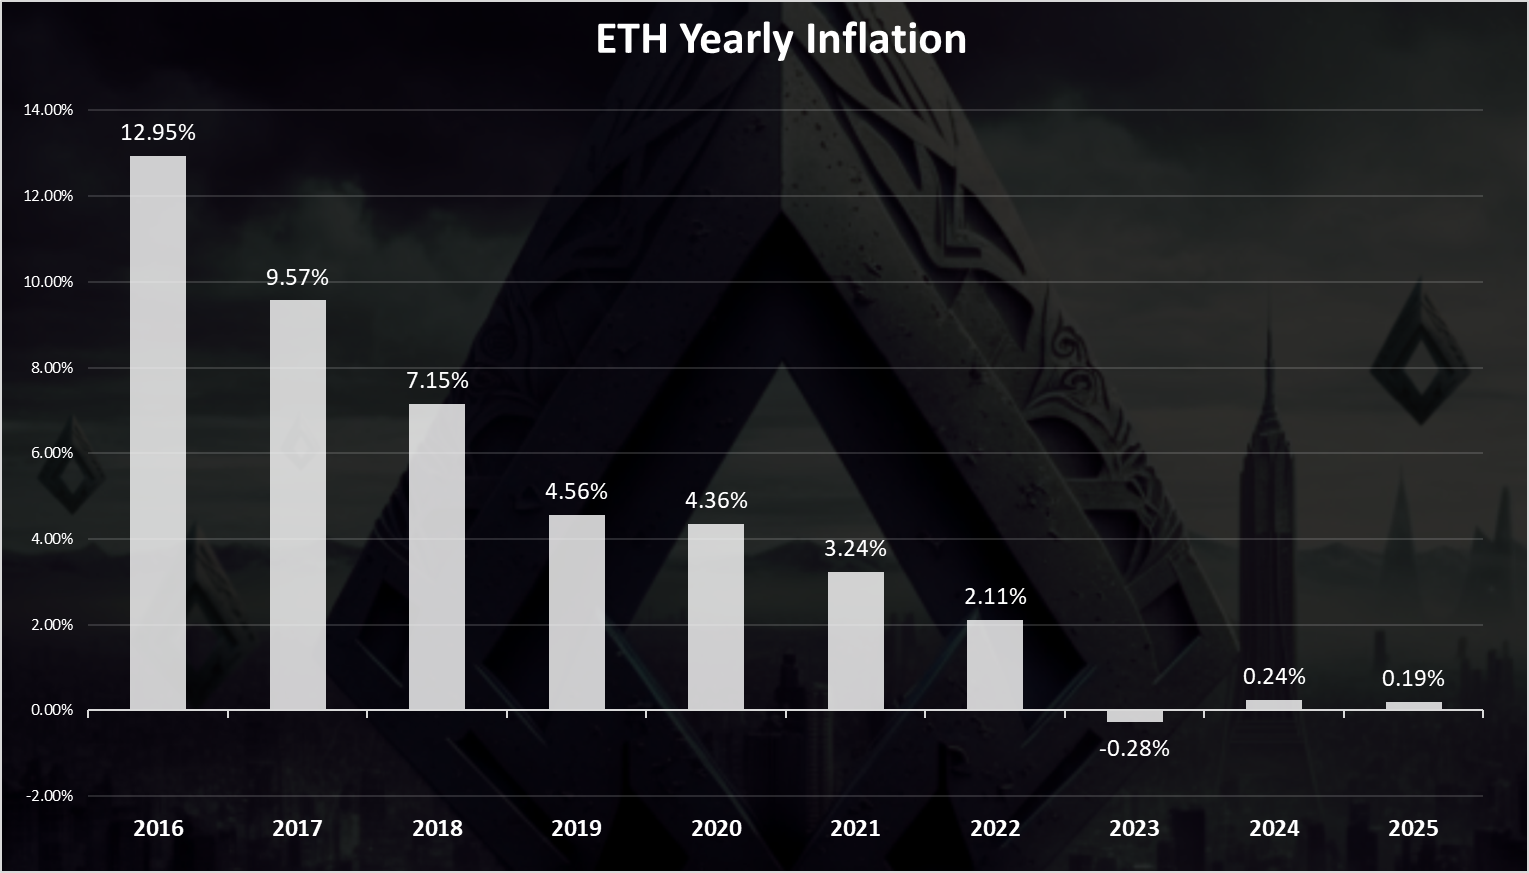
From more than 10% down to negative -0.28% in 2023. In 2024 the inflation is at 0.24%, still less than the 0.43% base inflation, while for the 2025 up until now we are at 0.19%, so it will probably end again around the 0.2%. Even with positive inflation of 0.2% ish, this is still quite a hard asset, bearing in mind that if we take the last two years it will be at zero.
Number of Wallets
Now for the general network numbers. Here is the chart for the total number of Ethereum wallets created.
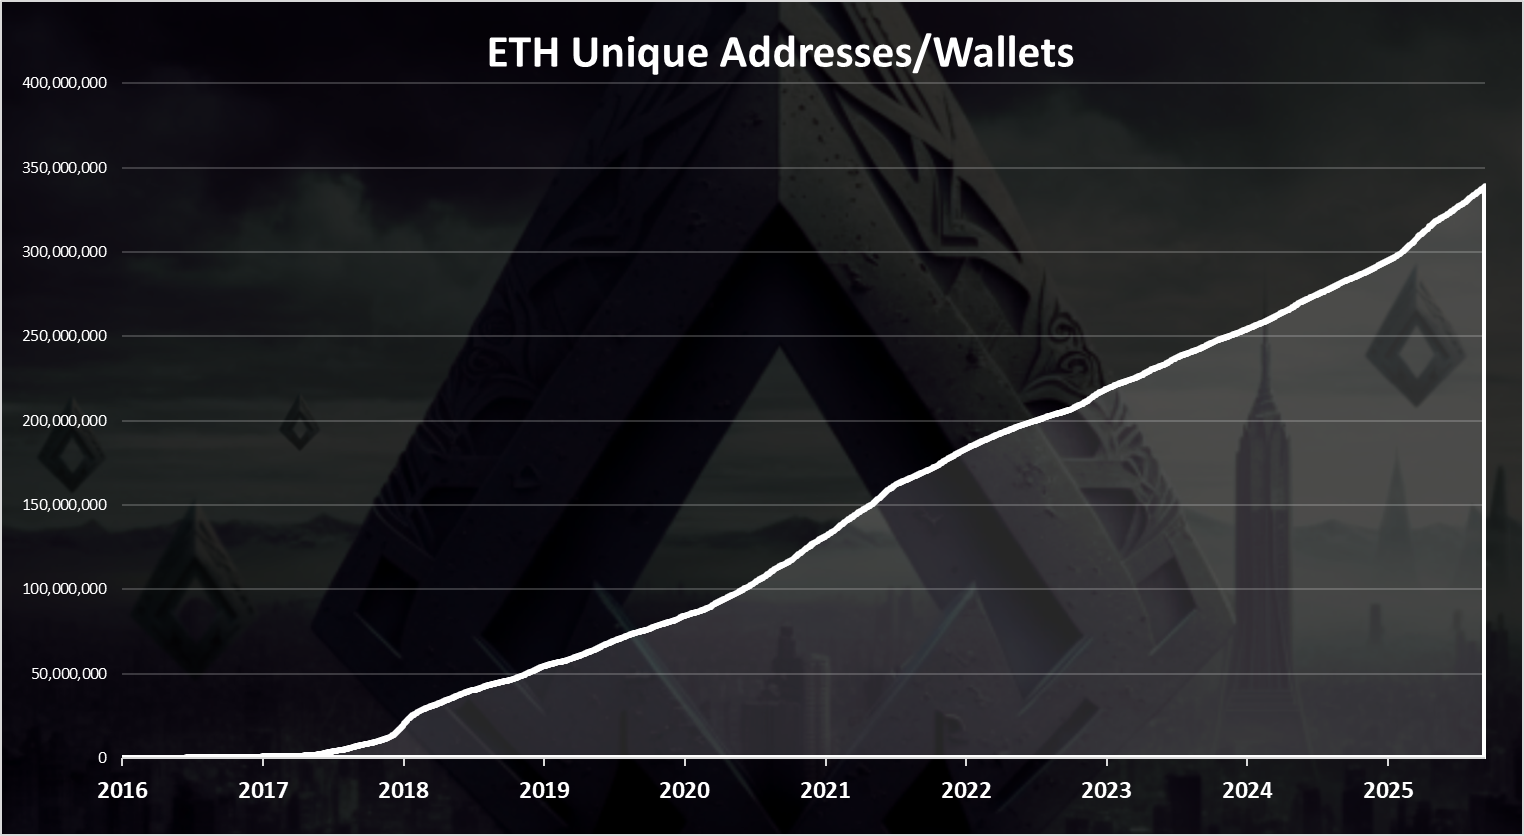
Ethereum now has close to 350M wallets! The numbers of wallets keeps growing at a steady pace.
When we look at the number of new daily wallets created we get this chart.
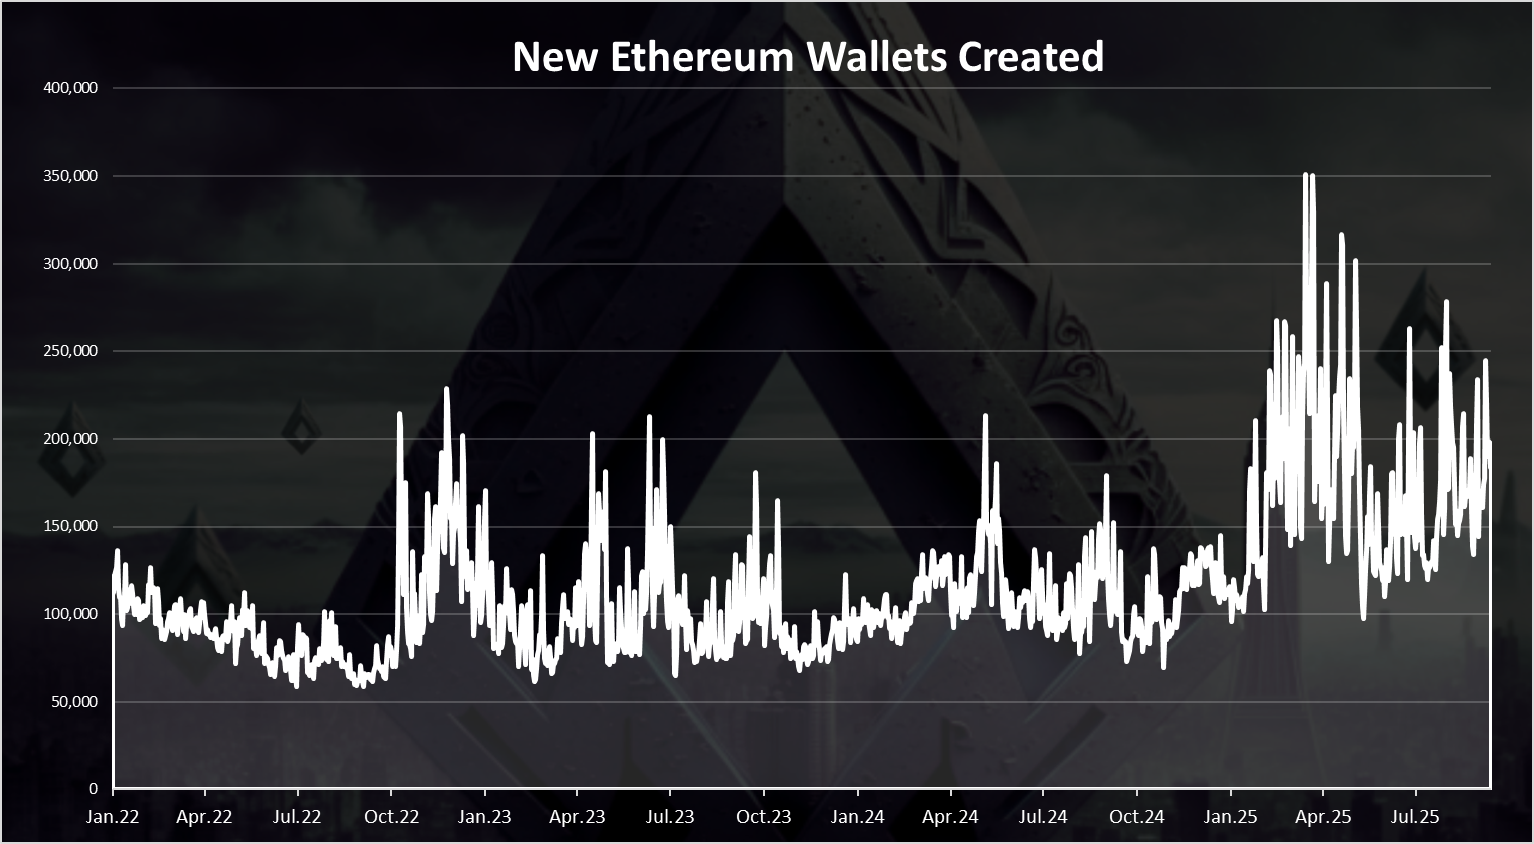
This is starting from 2022.
Some sideways action here but still a relatively steady numbers up until 2025 since when it increased from 150k up to 300k, not sure why. Note that there is no cost for Ethereum wallets so some of it can be spam.
Active Wallets
How many of them are being used? Here is the chart.
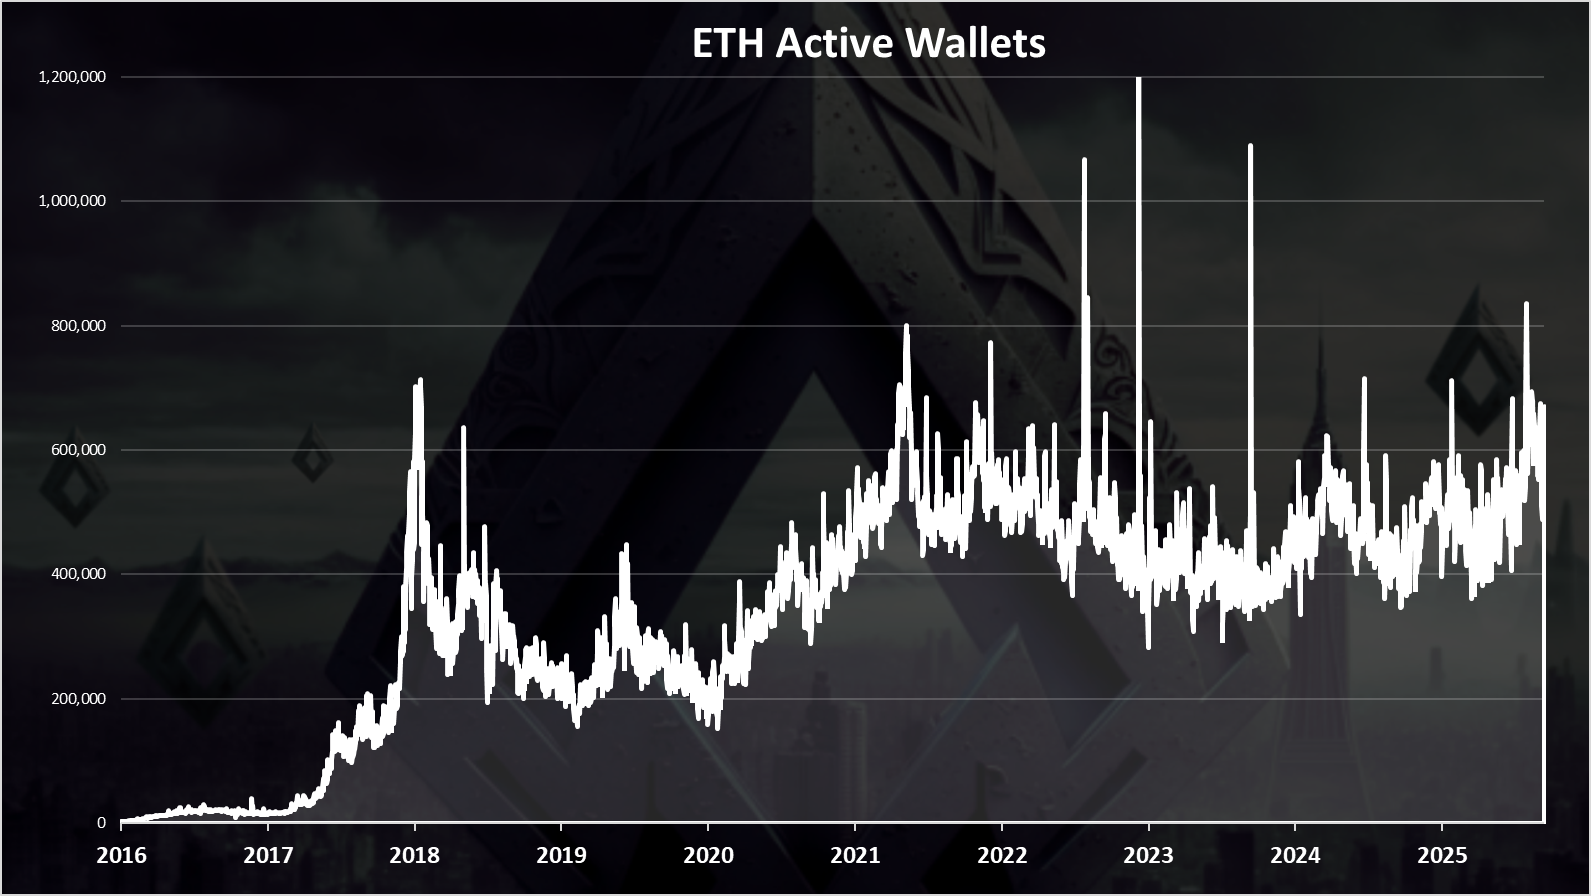
We can see that there was an overall uptrend up until 2021, reaching around 700k active wallets. Since then, there has been a downtrend up to December 2023, when it started growing again, from 400k to 600k active daily wallets. In the last period the number of active wallets has increased again and it is in the range of 600k to 700k.
Transactions
How about the number of transactions? Is the Ethereum network now more active after the merge? Here is the chart.
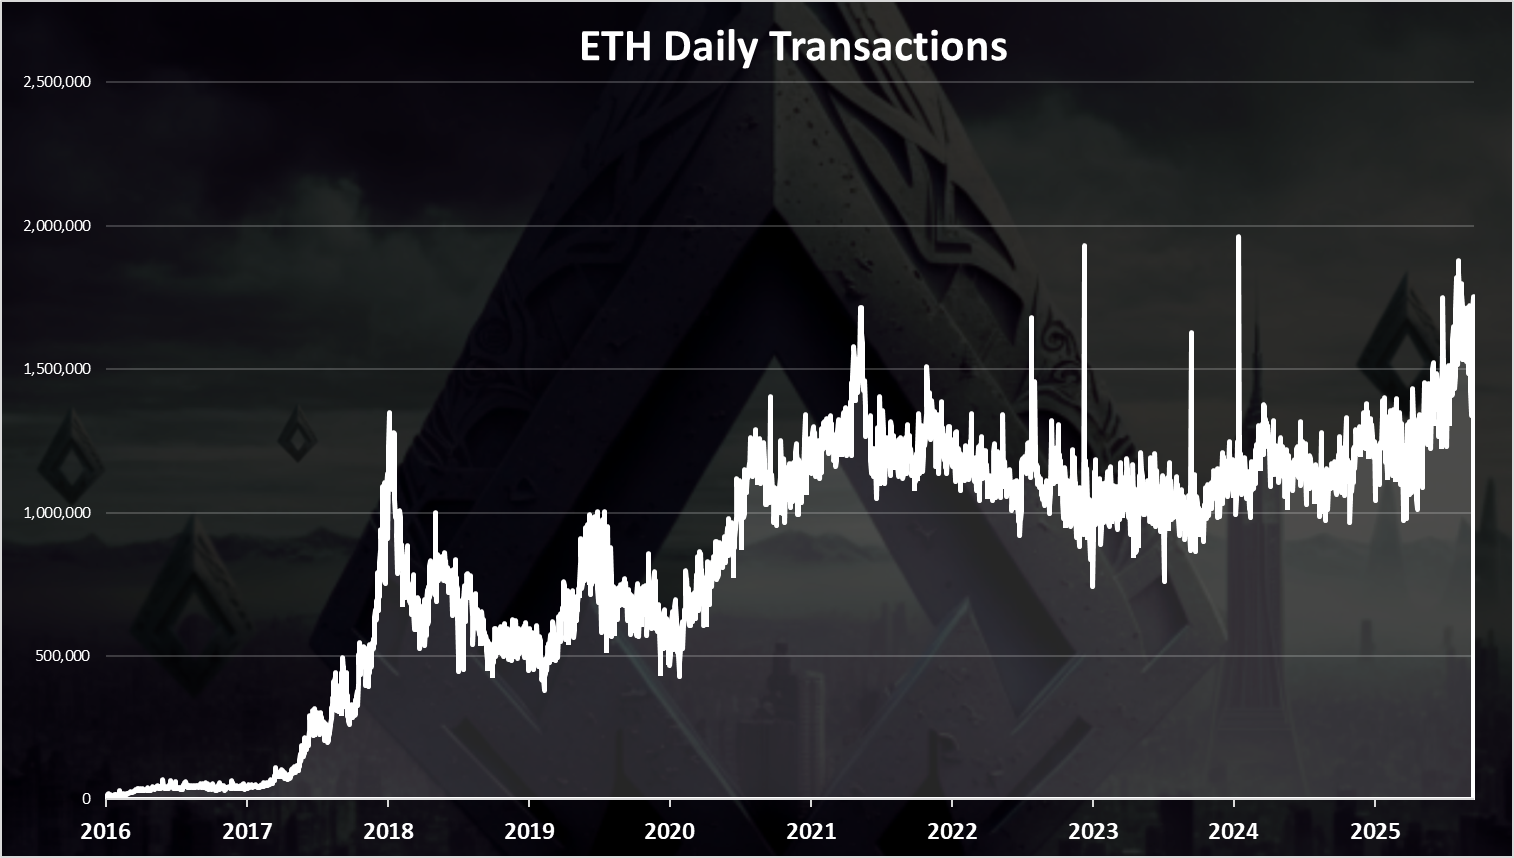
There was a spike in the transactions back in the bull market of 2017, up to 1.4M, then a drop to around 500k per day. In the previous bull market in 2021 the ATH was somewhere around 1.8M transactions per day, a steady drop since then and a growth again in the very last period, with the number of transactions close to previous ATH of around 1.8M but this time they seems to be more consistent.
Fees
Here is the chart for Ethereum fees. Quite the ride.
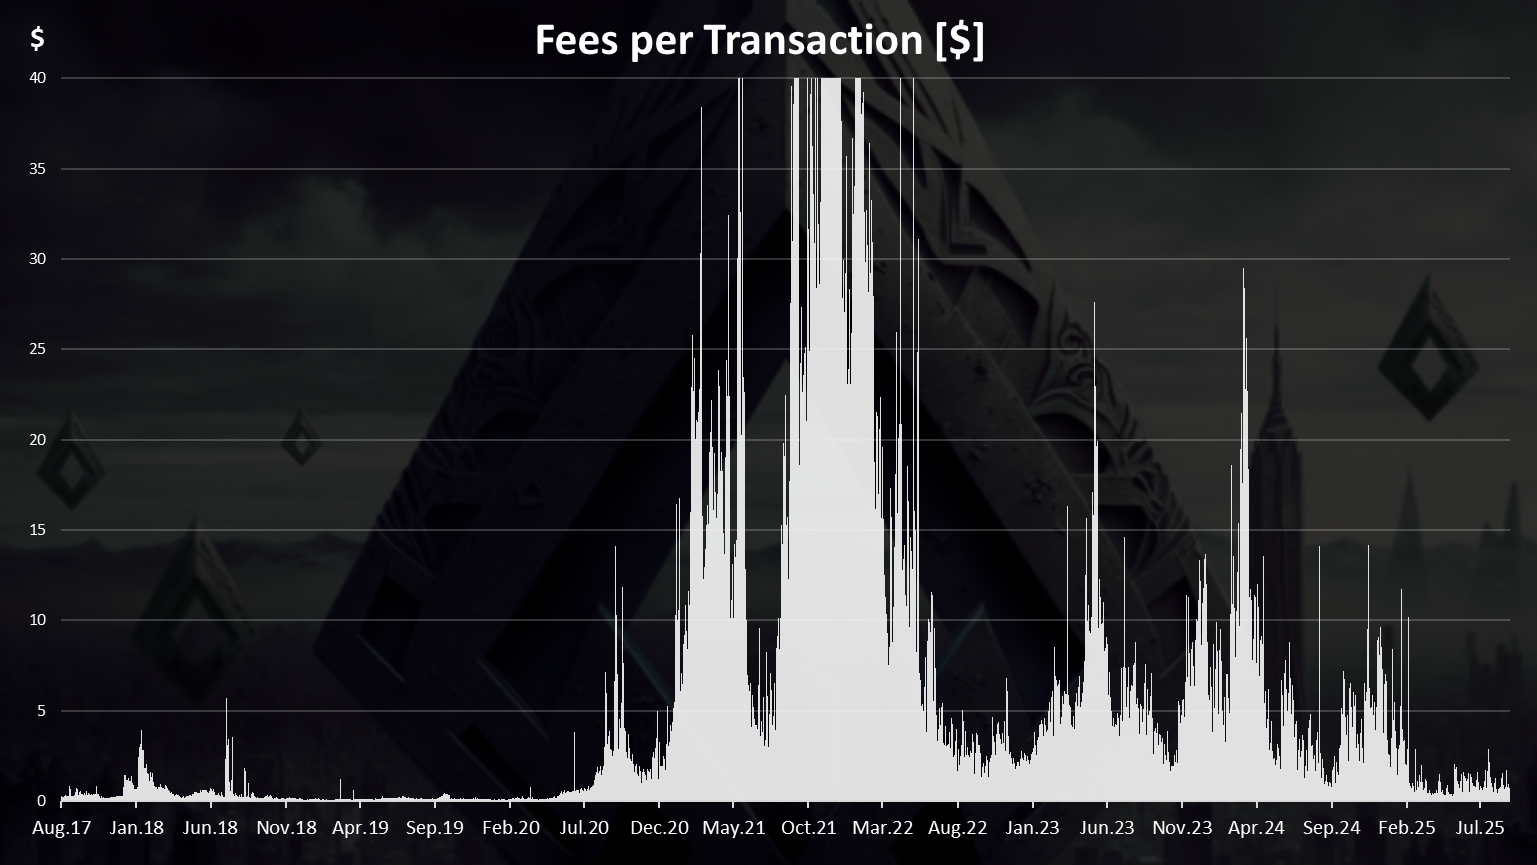
At first there was a small increase in the fees back in 2017-2018 bull run. Then in the next bull run a massive increase in the fees up to $100 at one point. A drop in 2022 in the range of 5 to 10 USD, and a further drop in the very last period to bellow one dollar. The current fees on Ethereum are the lowest since 2020.
Staking Ethereum
Staking a big topic in the Ethereum network since the PoS upgrade. Here in short will just check the share of ETH staked from the overall supply. Here is the pie.
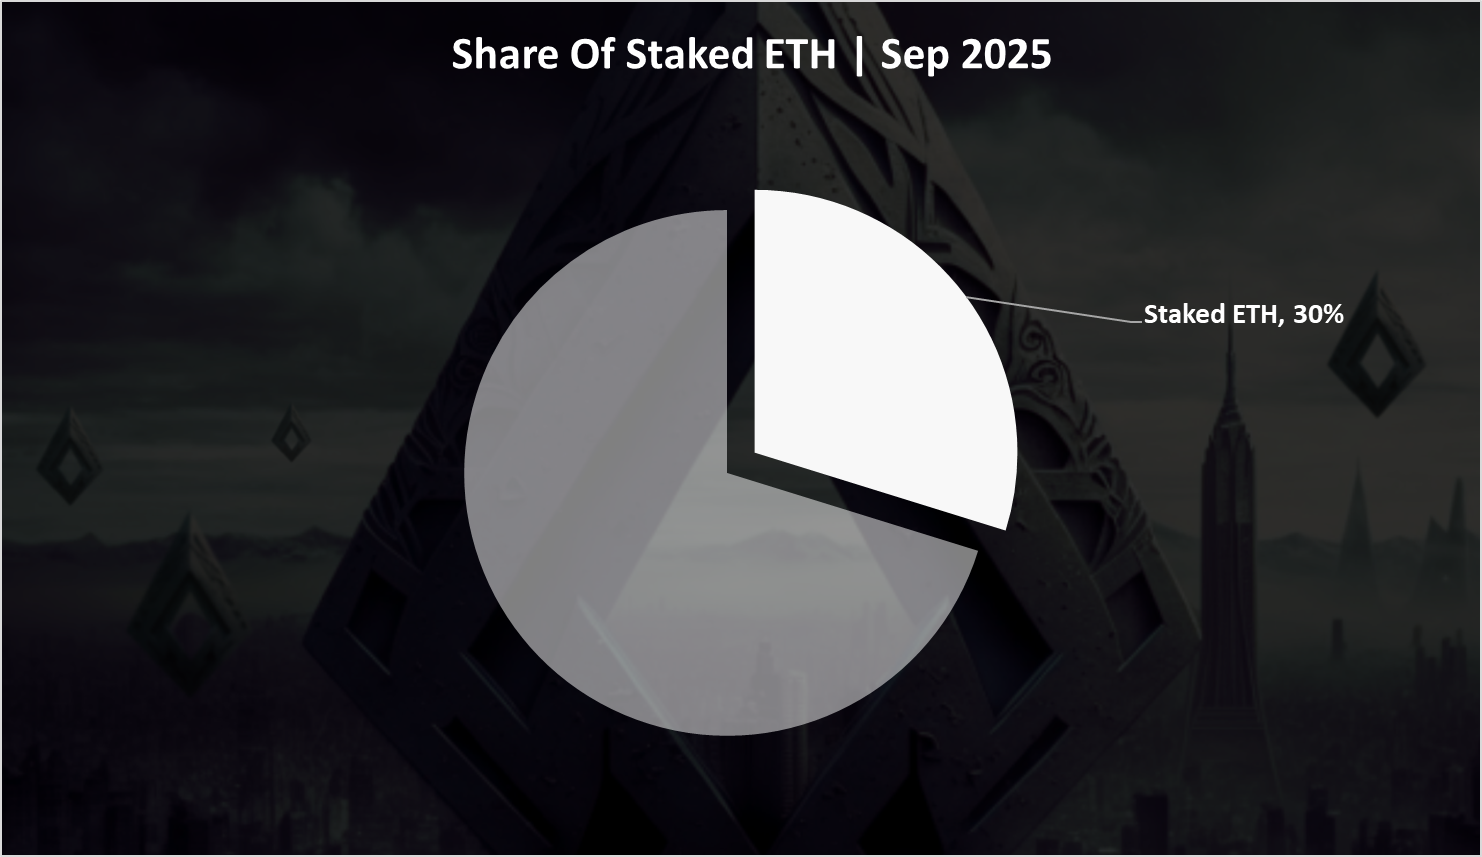
A 30% staked ETH from all the supply. The trend for the staked ETH has been constantly up in the last period. For a token of this size and market cap this is quite a big share.
Number of Contracts
Here is the chart for the number of smart contracts deployed daily.
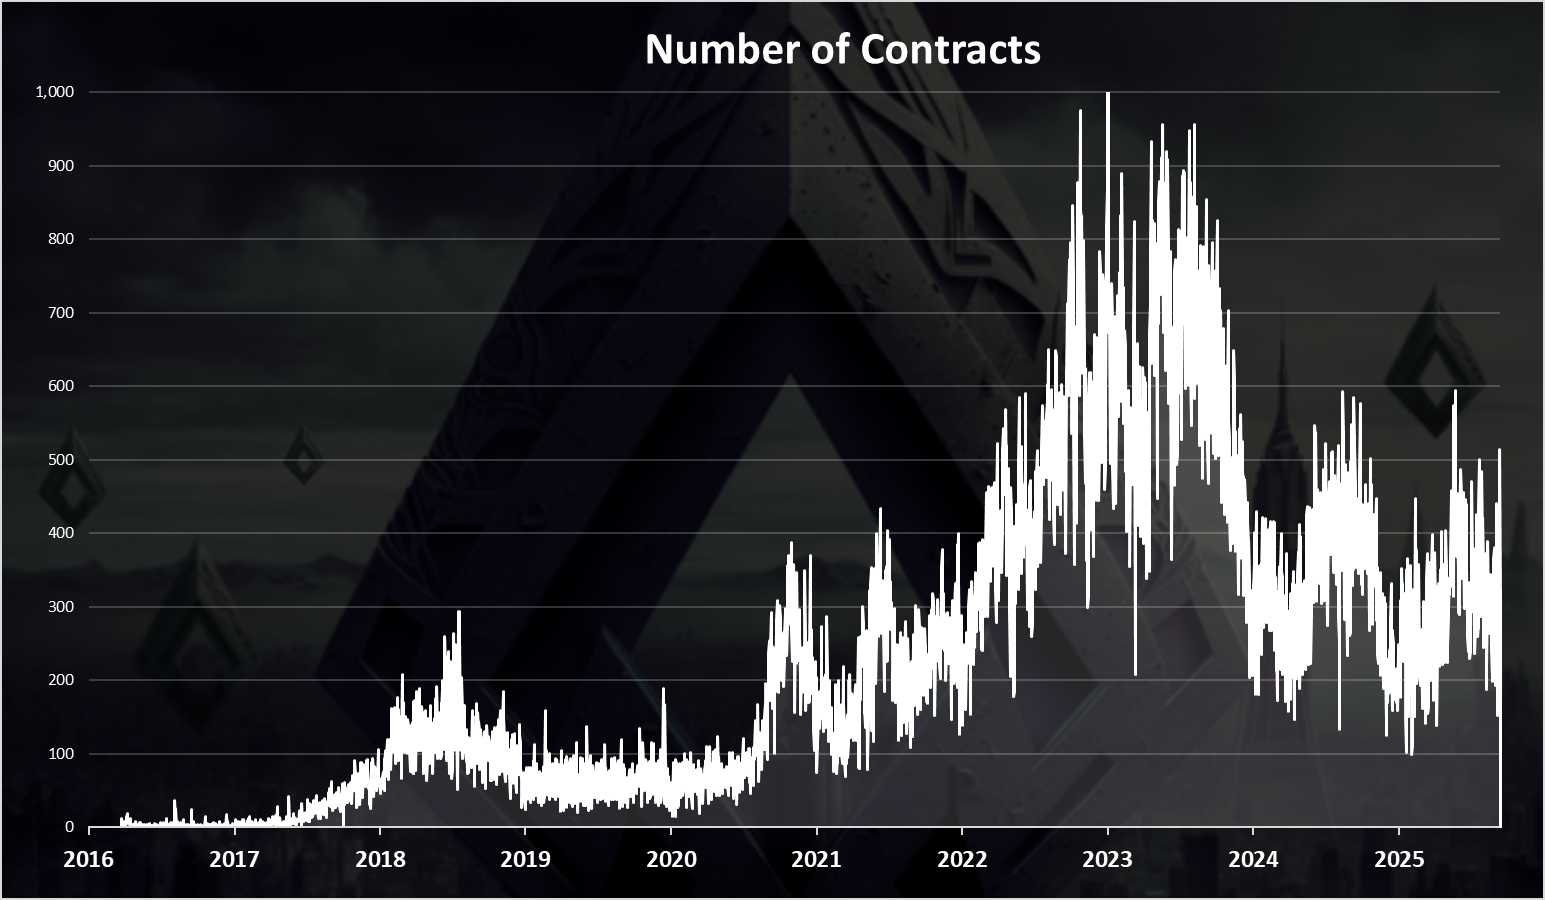
There was a peak in the number of contacts back in 2023, and then a drop in 2024, from 1k to around 400 where it has been in the last one year or two. The numbers have been volatile, going from 100 up to 500.
Overall Ethereum has been showing some strength recently with the number of active wallets and transactions up, while the supply has remained almost constant. Staking is hovering around 30% with 35M out of the 120M supply staked.
All the best @dalz