How did Hive do in October 2025 from an inflation standpoint? Let’s take a look!
The projected inflation for Hive for 2025 is 5.5% on a yearly basis, or around 0.45% on a monthly basis.
Hive has a double currency system, HIVE and HBD, with conversions between them that add or remove HIVE from circulation on top of the regular inflation. Furthermore, the decentralized hive fund DHF, that serves as a DAO converts the HIVE that is in the DHF into HBD. The @hbdstabilizer has also grown and it plays an important role in the overall tokenomics, making conversions and trading on the internal market. Because of this additional mechanics the HIVE inflation and supply can be drastically different in real time than the regular/projected one.
To be able to follow the HIVE supply we need to take a look at all the different ways HIVE is created, author, curation, witness rewards, conversions etc, then net that out with the HIVE burned from conversions, accounts fees, null transfers etc. To get the virtual supply we need to do the same for the HBD supply as well.
HIVE Created
Here is the chart.
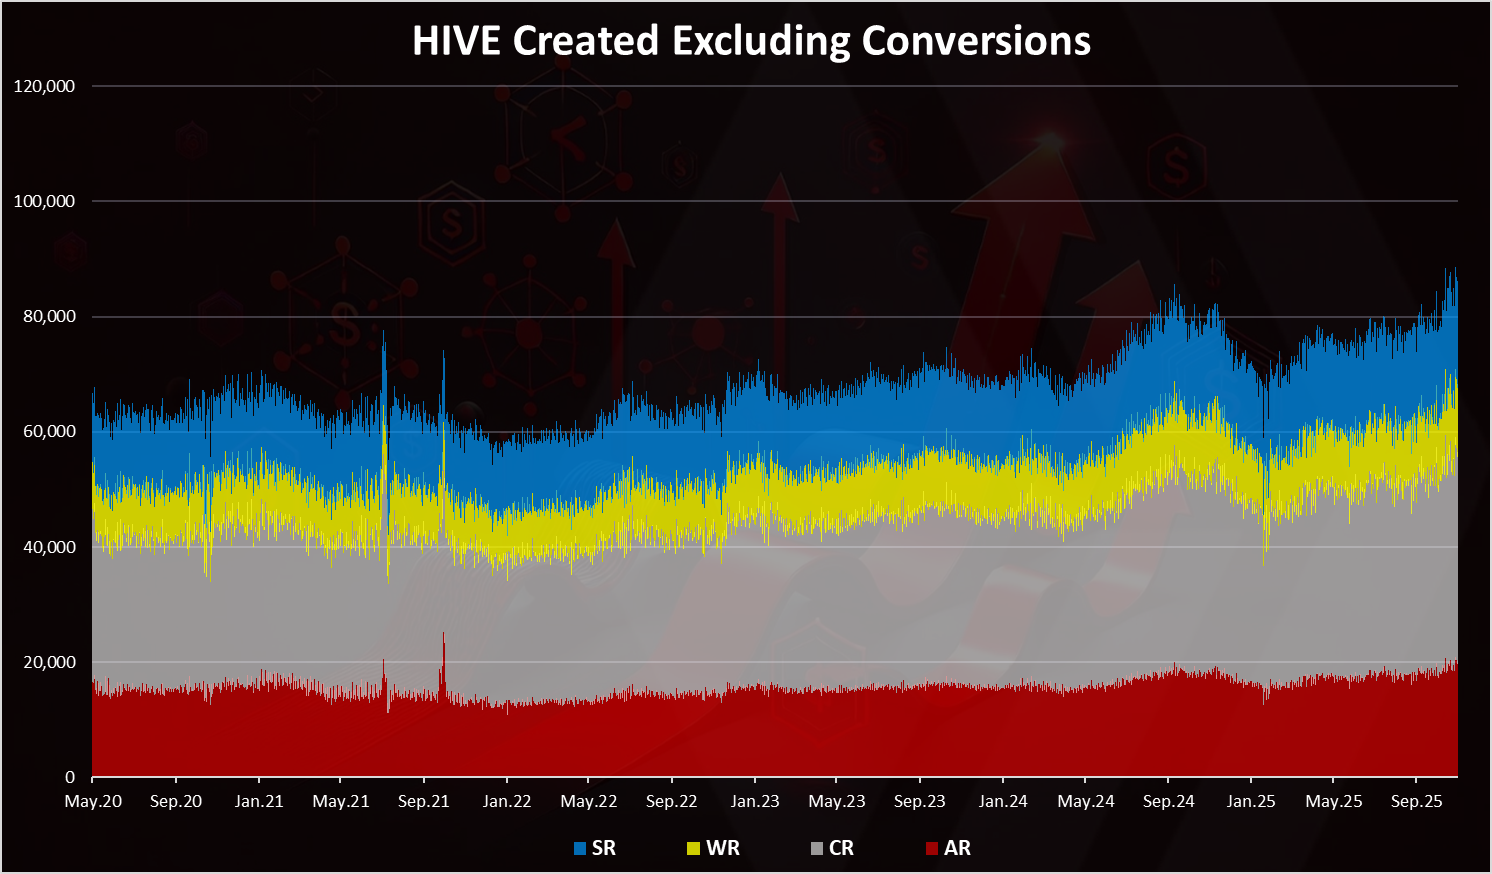
The chart above includes: - Author rewards - Curation rewards - Witness rewards - Staking rewards
These are the regular ways new Hive enters circulation, and all of them are through vested HIVE, aka powered up. The regular inflation is around 85k HIVE per day.
Due to record low HIVE prices in the last month the inflation is the highest in the period. This is because the base of HIVE inflation has increased even though the inflation rate remains the same. At the moment the base for calculating the HIVE inflation is the virtual hive supply that included the HBD in the DHF as well. This pushes the virtual hive supply at record levels, above 700M, even though the regular is close to 500M. Ater the next HF, the HBD in the DHF should be removed from the base for inflation rate, lowering the HIVE inflation. As a reminder the current HBD supply is 11M, while in the DHF there is additional 23M HBD, for cumulative 34M.
The thing is the conversions are playing a major role in the ecosystem. Here is the chart again, including conversions.
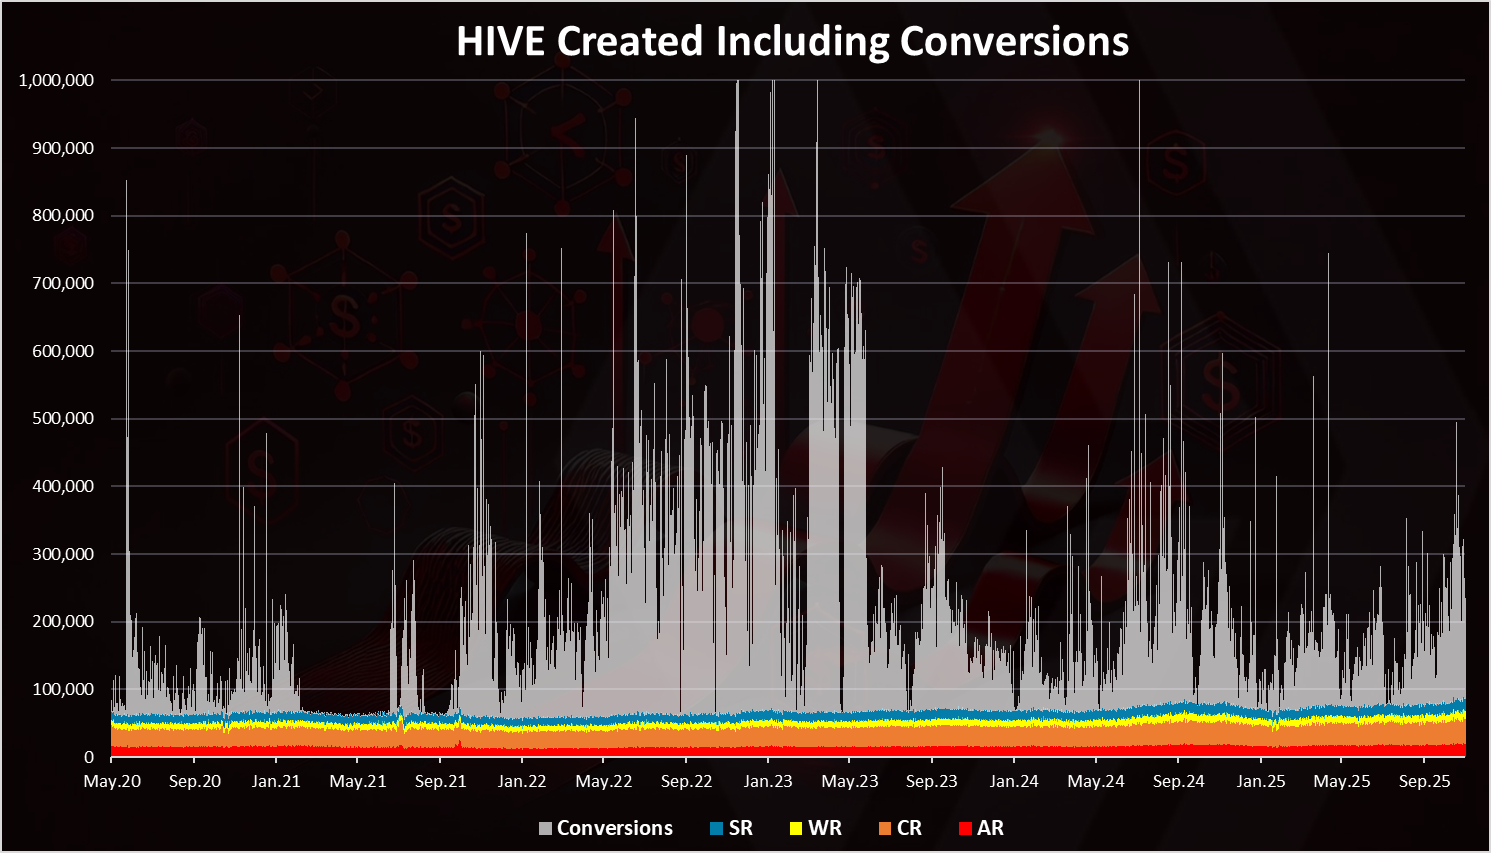
We can notice that the HBD to HIVE conversions are the dominant in the chart. This works in both ways and a big part of them is converted back to HIVE, especially through the work of the stabilizer.
In general, there are less conversions since the summer of 2023 that is mostly because of the stabilizer that has reduced its funding since then and the size of the conversions in both ways. Also, market dynamics influence the conversions a lot, as users usually convert when the HIVE price is low.
HIVE Removed from Circulation
Here is the chart.
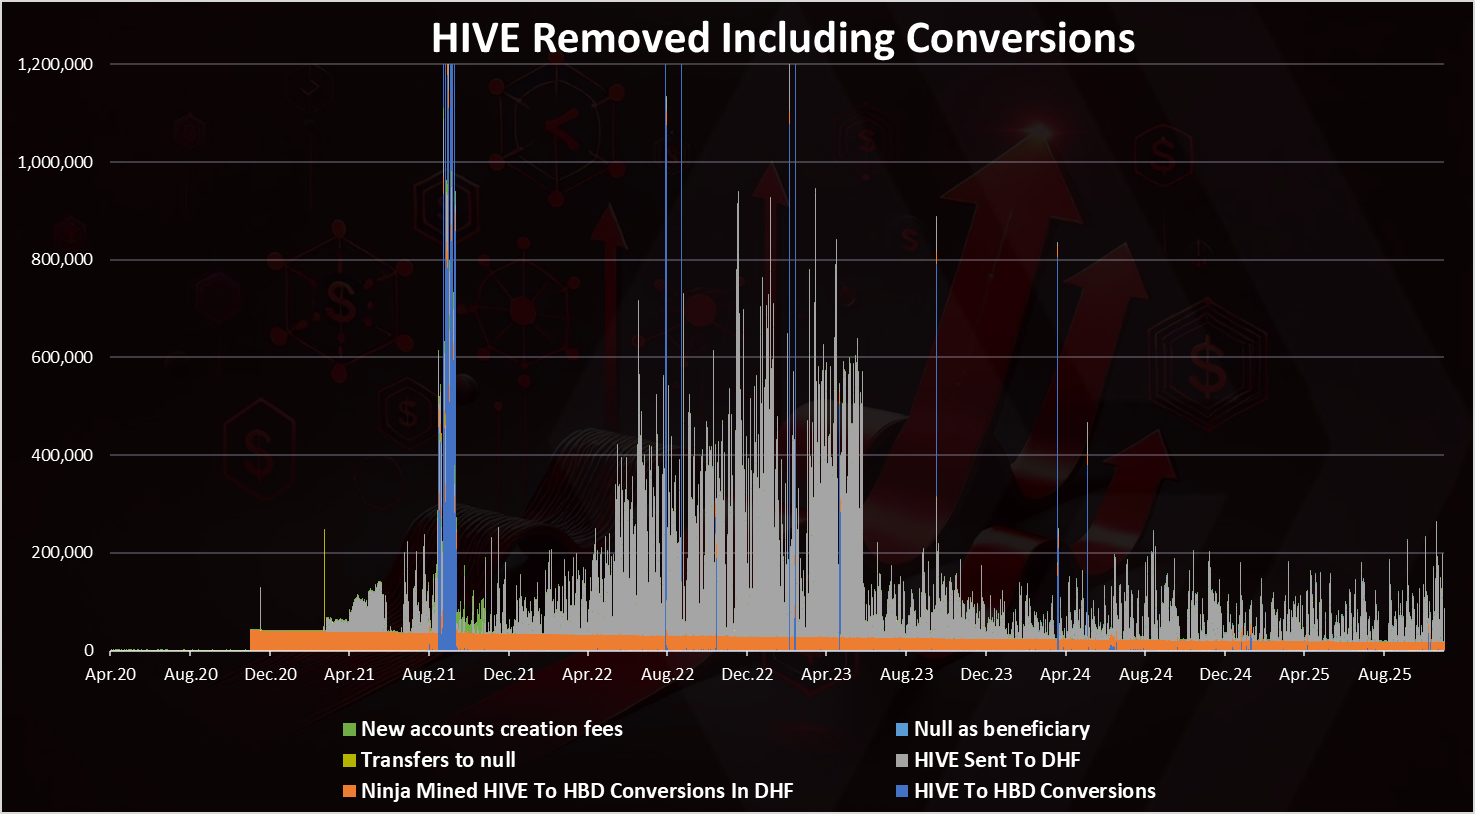
The above takes into consideration six different ways of HIVE removed: - Ninja Mined HIVE To HBD Conversions In DHF - HIVE transfers to DHF and converted to HBD - Transfers to null - Null as post beneficiary - New accounts creation fee - HIVE to HBD conversions
The HIVE transfers to the DHF are dominant. These are transfers made by the stabilizer. We can see a few spikes in the HIVE to HBD conversions (blue), with one occurring just recently. These were due to the increase in the HBD price. We can also notice the drop since the summer of 2023, same as the opposite conversions due to the lower funds and low volumes that the stabilizer is doing.
Historical HIVE Supply
When all the above is added and removed, we get this chart for the all-time HIVE supply.
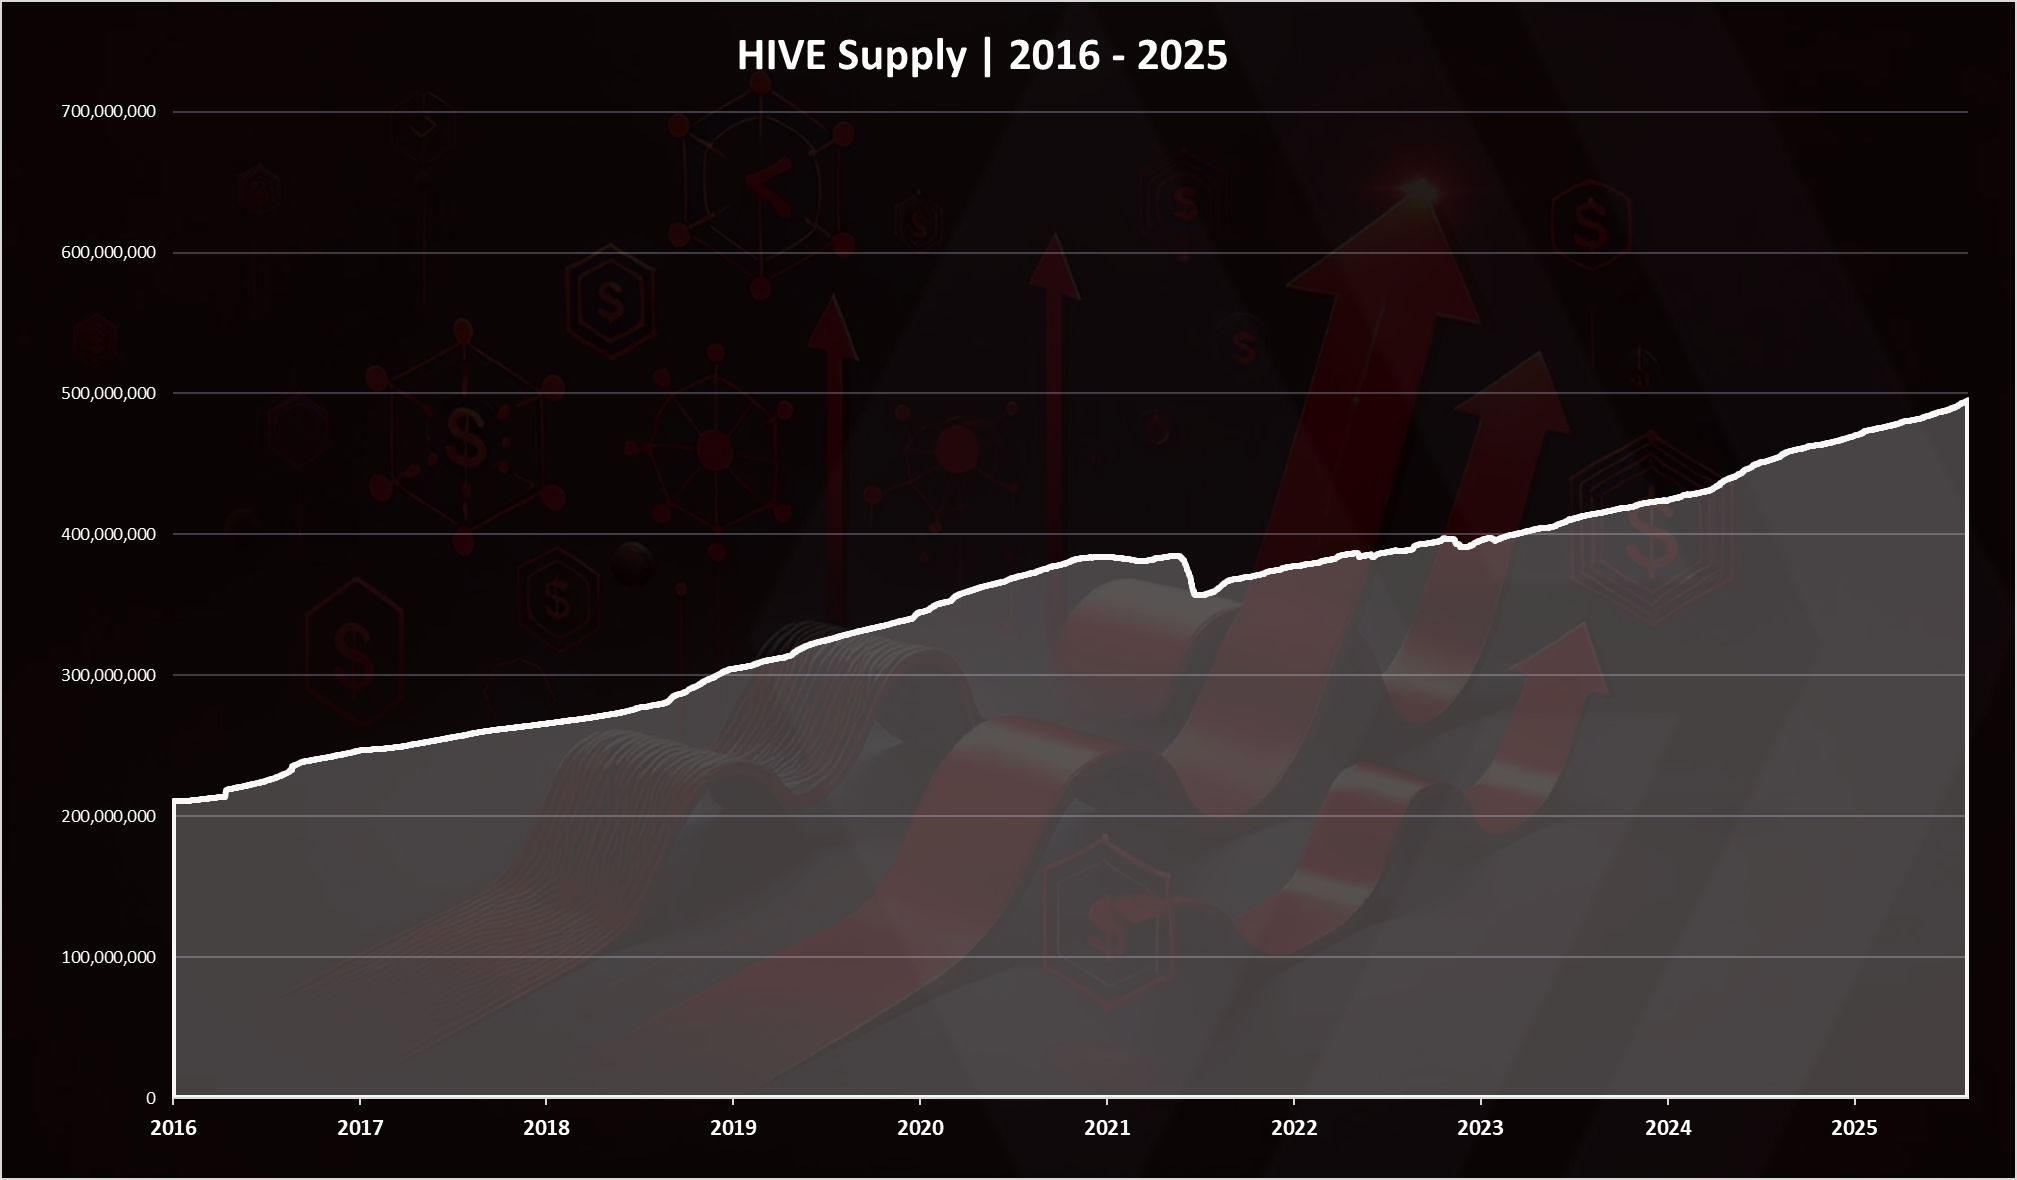
Up until August 2021, the supply was almost steadily increasing with a small fluctuation. Then there was a drop in the supply in September 2021. Since then, from time to time we can see some drops in the supply in February and April 2023.
October 2025 ended with 495M HIVE in circulation.
HBD Supply
Here is the chart for the HBD supply.
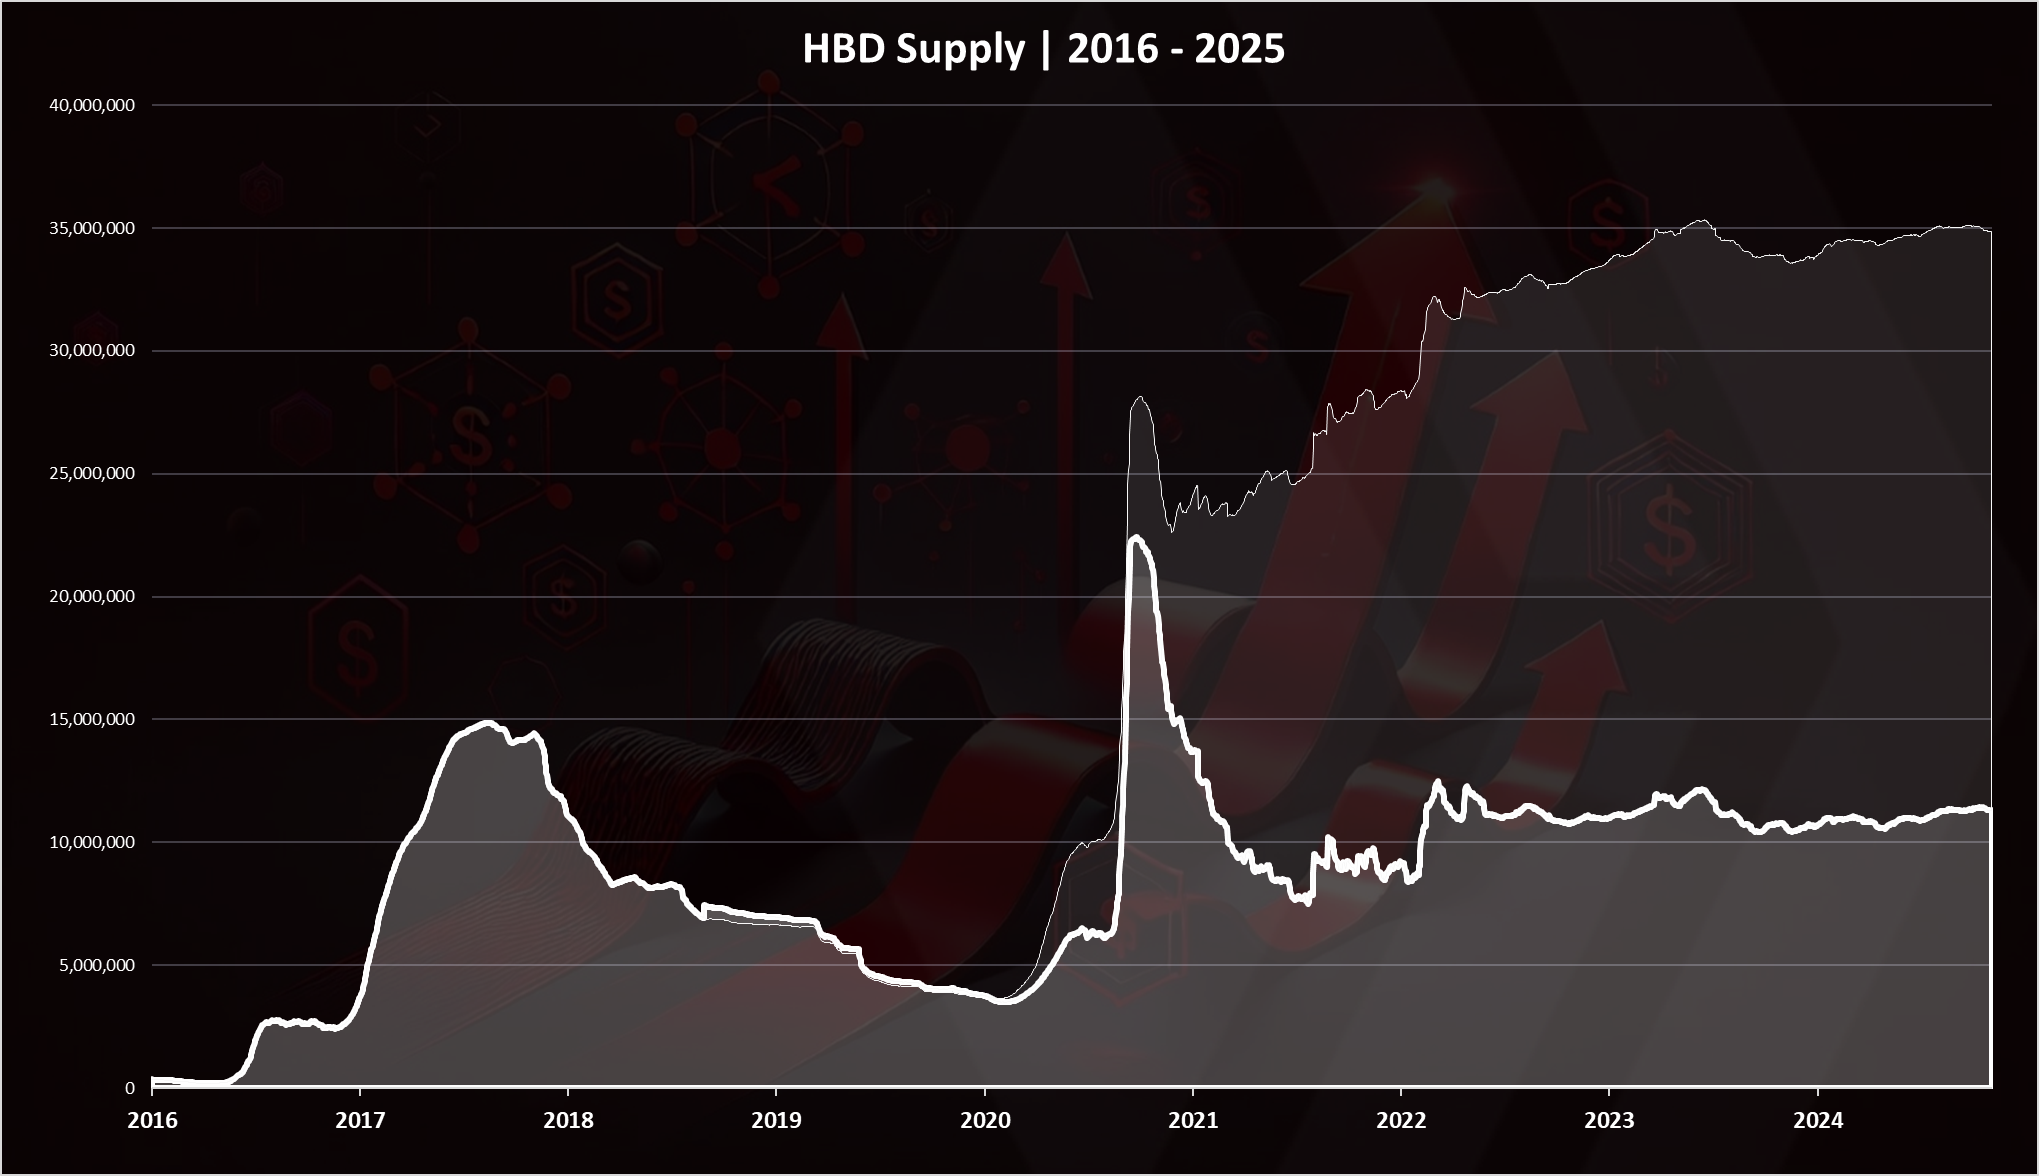
The light color is HBD in DHF. The HBD in the DHF is not freely circulating HBD and only enters circulation when payouts to the DHF workers are made.
HBD is being created and removed in various ways, but the conversions play the major role here in both directions. Other ways HBD are created are DHF proposal payouts, author rewards and interest.
We can see that after a downtrend in 2022, in the last period the HBD supply is very stable around the 11M HBD. In the last month the HBD supply has remained the same at 11.5M HBD.
Virtual HIVE Supply
When we add the HIVE equivalent supply from the HBD to the HIVE supply we get the chart below.
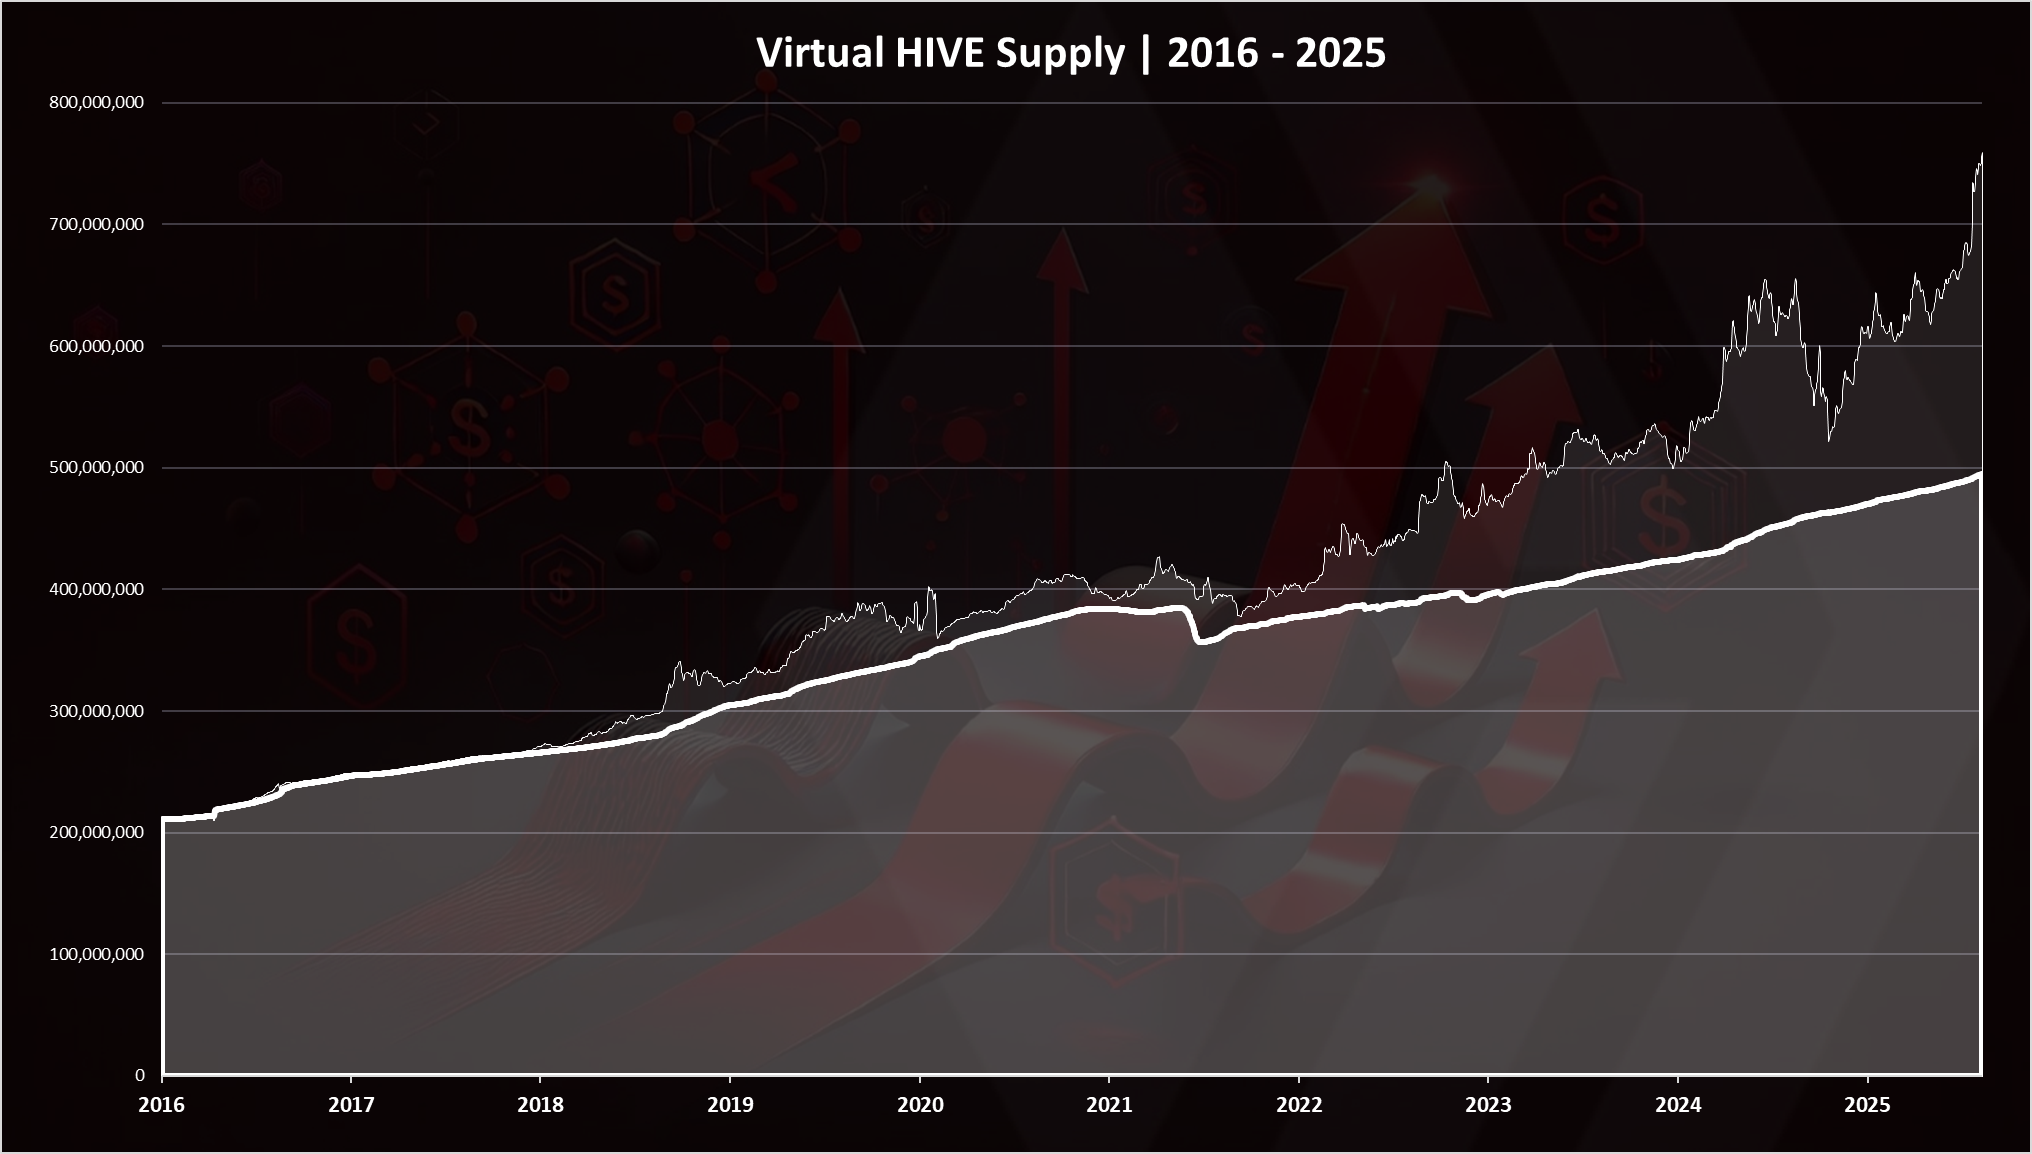
The light color is HIVE that in theory can be converted from HBD at the current market prices for HIVE. We can see the sharp increase in the virtual supply in the last month. This is worsening the overall HIVE economy. We can see that the virtual supply fluctuates a lot, mostly because it is tied to the price of HIVE. As the price of HIVE drops, the virtual supply increases and the opposite.
When we zoom in 2023 - 2025 we get this:
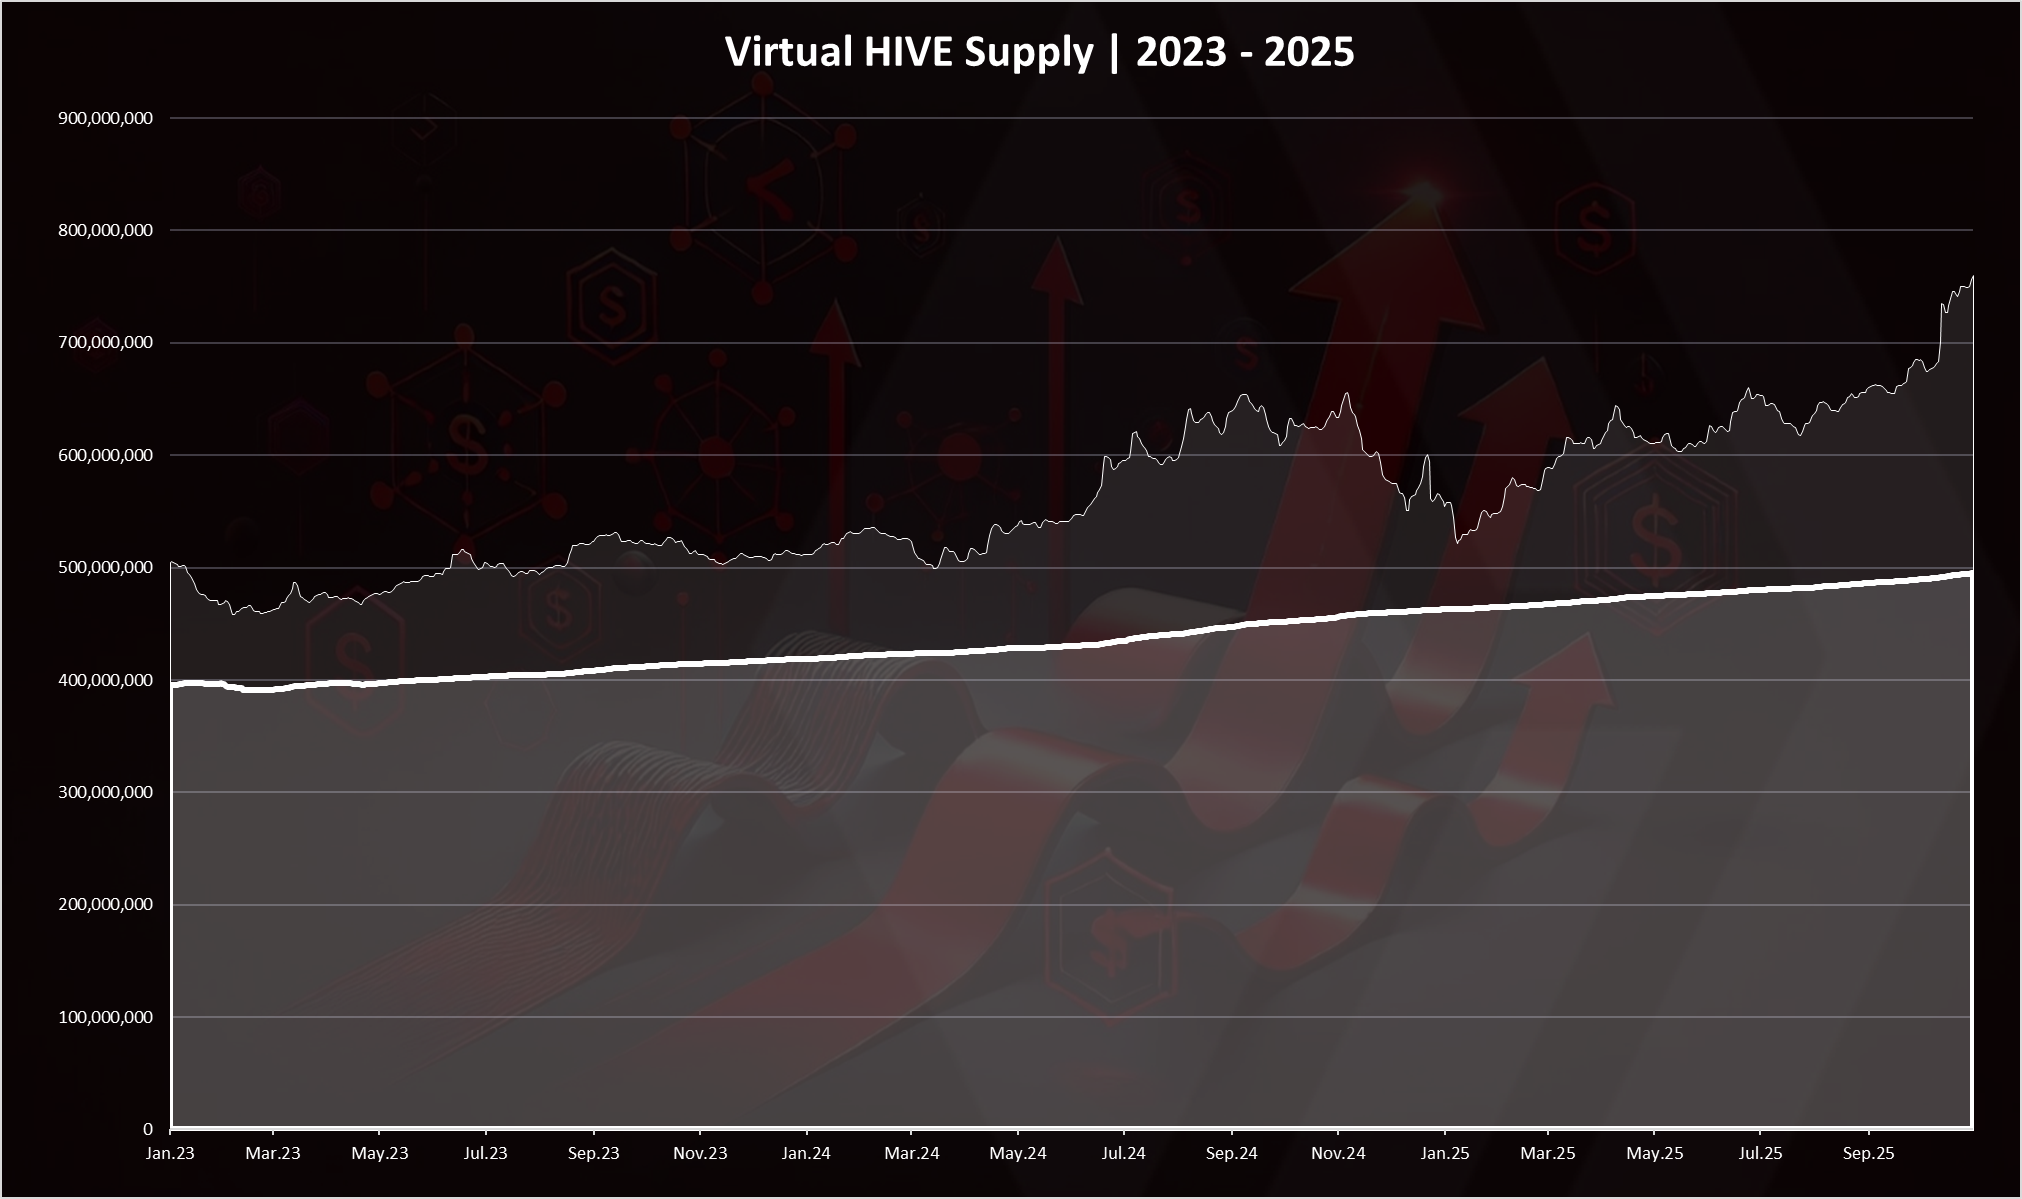
Here again we can see the increase in the virtual supply towards the end of the chart. The regular HIVE supply has increased in the last month.
Projected VS Realized HIVE Inflation in 2025
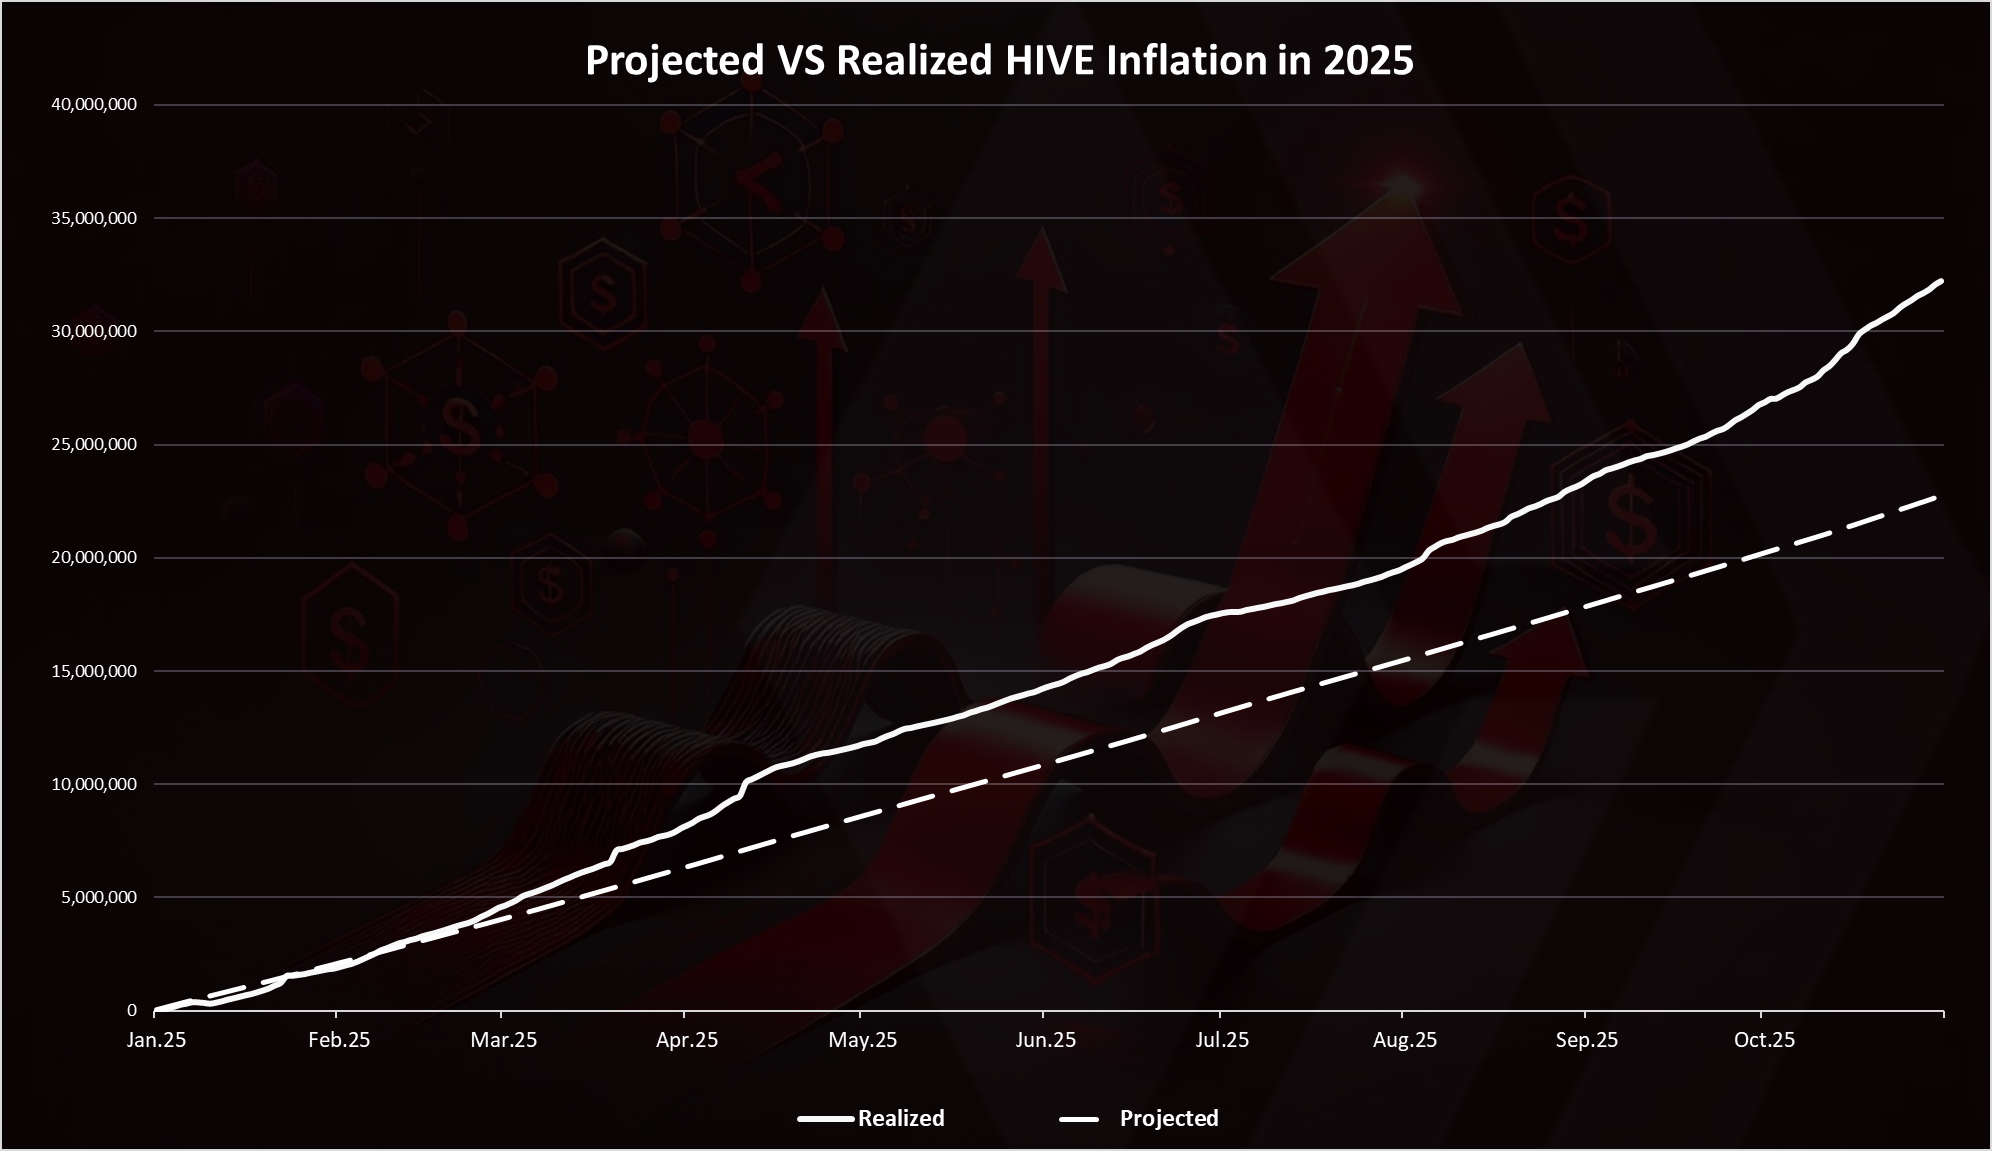
This chart tells the story of the new HIVE entering circulation in 2025.
We can see that in the first months of 2025 the projected vs realized inflation were close to each other/ Since March these two diverged and the realized inflation started to surpass the projected one. Up until October 2025 the projected inflation in absolute numbers is 22M HIVE, while the realized is at 32M. In terms of percentages, the projected for 2025 is at 5.8%, while the realized annualized inflation is at 8.0%.
Monthly Inflation
If we plot the monthly inflation in 2024-2025, we get this.
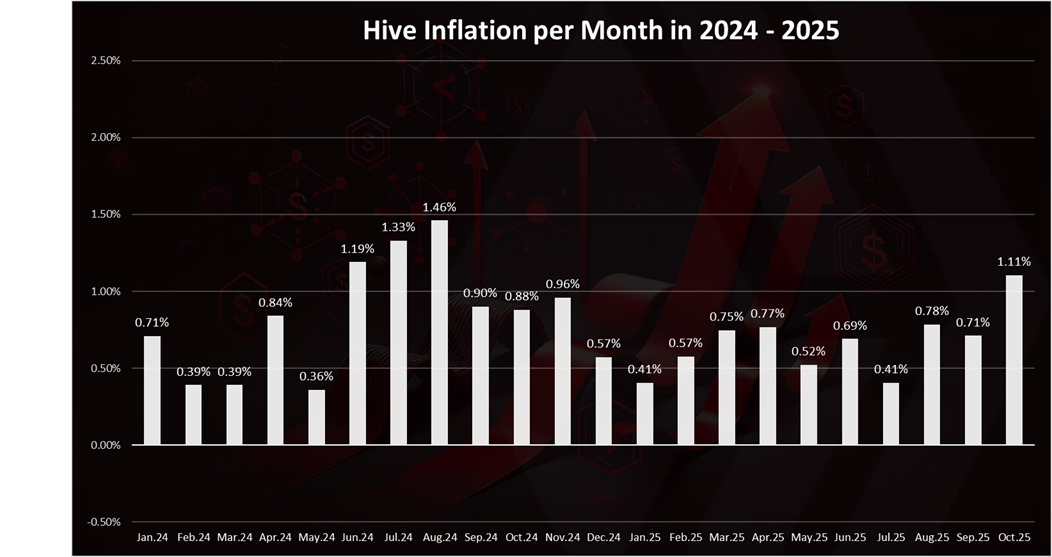
This is a chart for the period of 2024-2025. As we can see, all the months in the period are positive. May 2024 is the lowest one with 0.36%, while August 2024 is the highest with 1.46%.
October 2025 is above the projected one with 1.11%. First time in the whole number since the summer of 2024.
In terms of absolute numbers, the HIVE supply in October 2025 has increased from 490M to 495M, adding 5M HIVE in circulation, while the projected one is around 2.2M.
Yearly Inflation [%]
The yearly, projected and realized inflation looks like this.
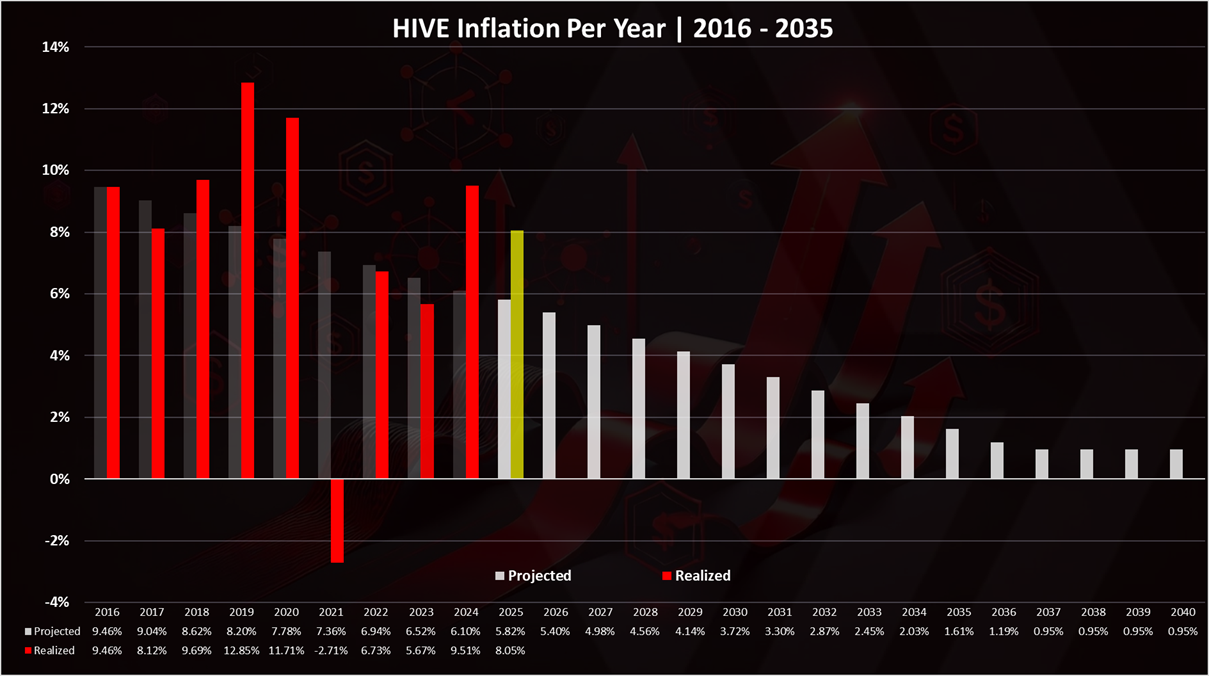
After the first four months of 2025 the annualized HIVE inflation is at 8.0%. This is higher than the projected 5.5% for 2025. The reason is because of the HBD to HIVE conversions. The HBD supply is almost constant in the period at 11M HBD, and approximately the same amount of HBD that is entering in circulation on a monthly basis is being converted to HIVE.
Net HIVE Created by Category in October 2025
Here is the new HIVE put in circulation by category for the month.
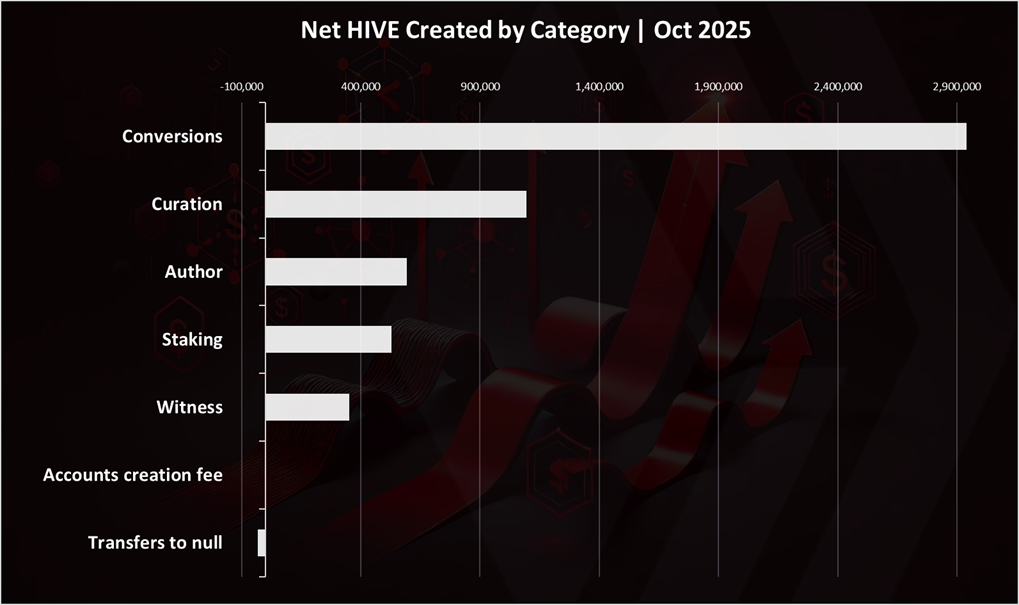
Conversions are by far on the top in the month with close to 3M! Conversions are the main variable that is changing the Hive inflation and when they are positive the inflation is above, or when they are negative the inflation is below the projected one.
Curation comes second with 1M HIVE added, followed by the authors rewards with around 500k. Note that authors rewards are paid 50% HIVE, 50% HBD, and the HIVE share only is at 500k, while approximately the same amount was paid in HBD equivalent.
Some HIVE was burned for @null as beneficiary and account creation fees.
All the best @dalz