USDC has been one of the stablecoins, (a dollar pegged tokens), that has tried to grow and build a reputation as the safest and the most legit out there. It wants to be a legitimate competitor to Tether USDT, but it is US based and in compliance with all the regulations, unlike Tether that is an offshore company and not subject to US regulations.
But even with all its regulation and compliance USDC had a real market test back in March 2023, when due to a bank failure it lost its peg for one weekend. Before this event, USDC was considered by most the safest stablecoin to park your dollars. In 2024 there seems to be some positive numbers again.
Let’s take a look at the growth of USDC through some data.
USDC is issued by Circle. It is a US-based company that is regulated and has regular audits on its holdings.
Here we will be looking at: - Daily USDC printed - Monthly USDC printed - USDC supply - Number of daily users - USDC chain allocation - USDC VS USDT
The data is collected from tools like Coingecko and Dune analytics.
Daily USDC Printed
USDC started at the end of 2018, but here we have data from 2019, for simplicity, and because there is not much movement in 2018.
Here is the chart for the USDC printed per day.
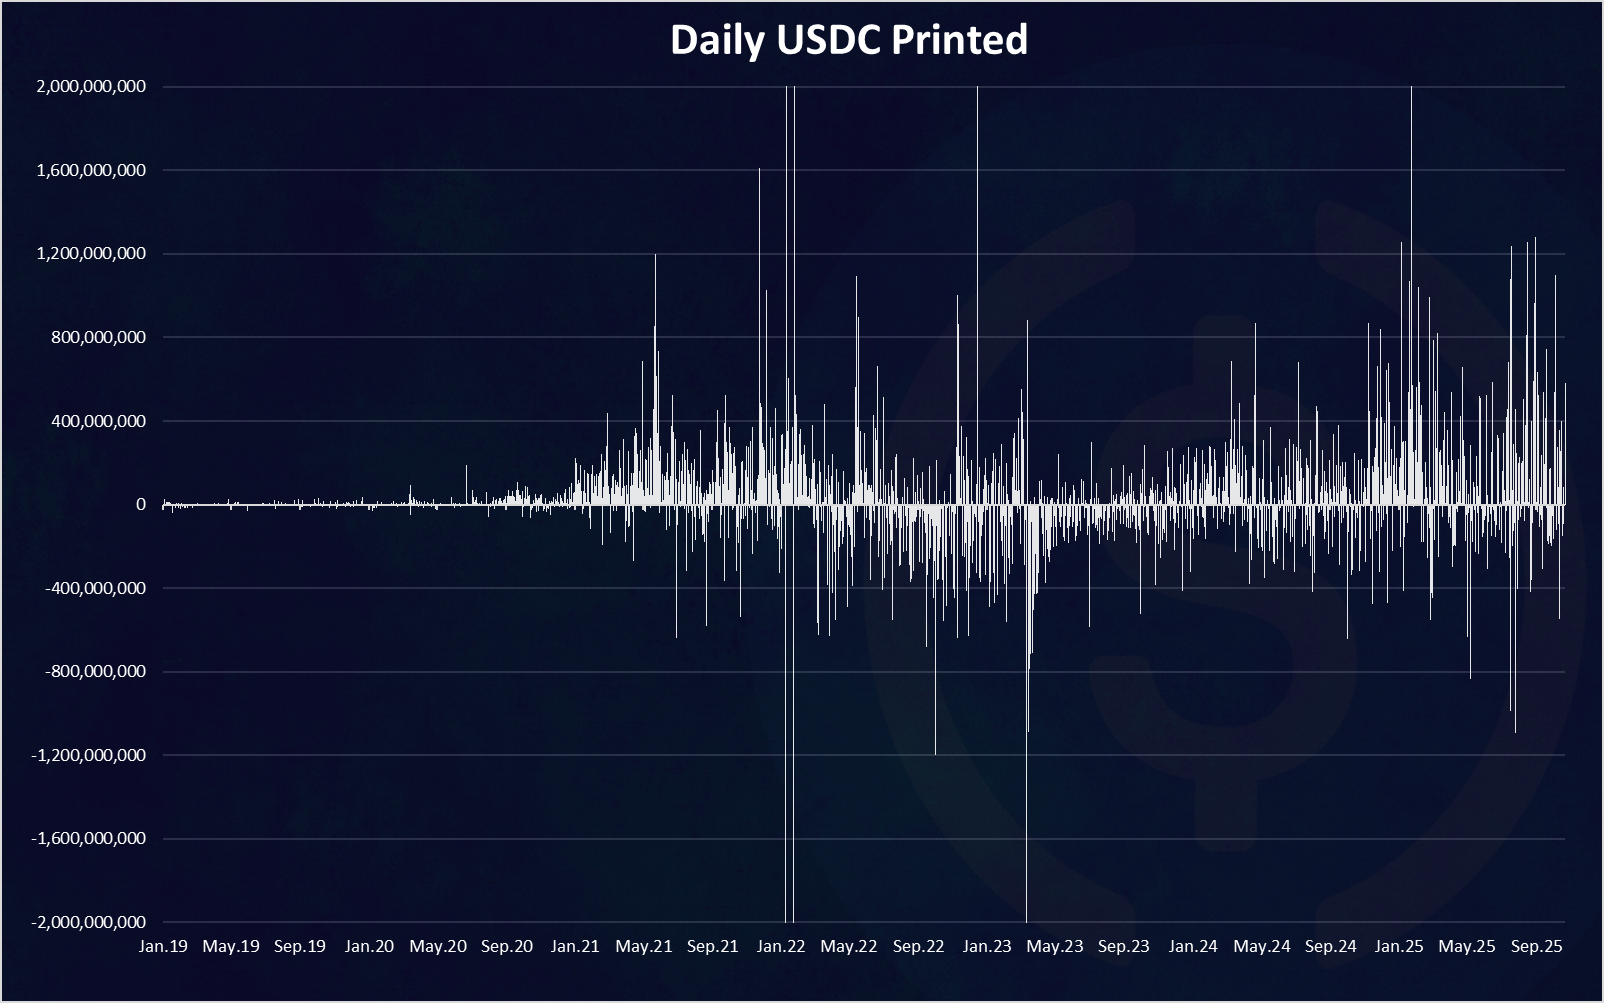
As we can see in the first years there was not a lot of printing for USDC. The larger amounts started to come in 2020 and increased significantly in 2021.
At times there was more than one billion USDC issued per day. We can notice the sharp burns that happened in March – April 2023 when the deppeging event happened. 2024 seems to be a mixed bag with a higher numbers in the first half and some lows in the second half and spike toward the end of the year. In 2025 we have a overall positive bars, first at the beginning of the year and in the last months as well.
Monthly USDC Printed
Here is the monthly chart for better visibility.
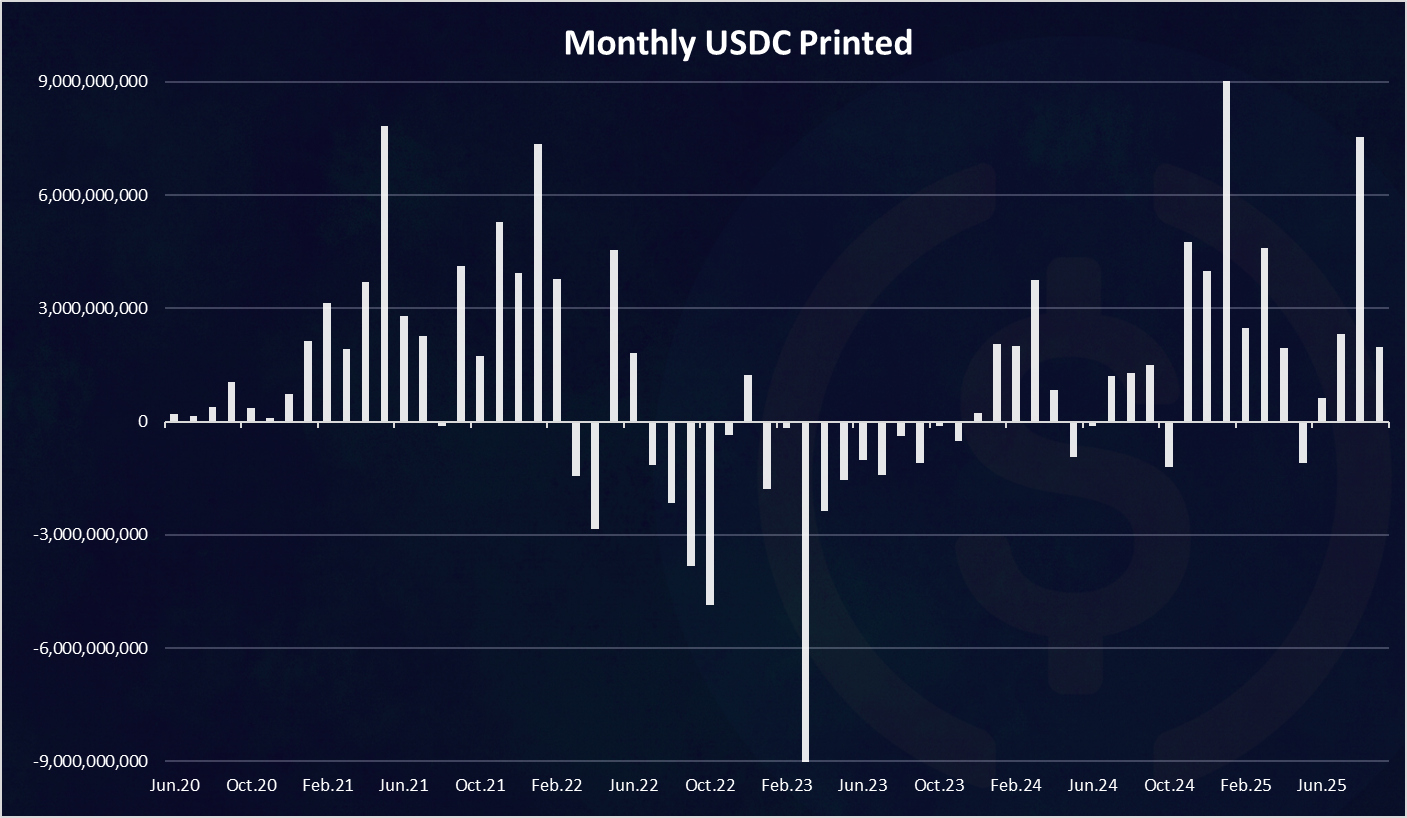
We can see that up to 2022, there was in general more USDC monthly printed, and then in 2022 the trend shifted with almost every month being in the negative. A massive negative bar in March 2023, when almost 10B USDC was taken out of circulation. This was during the deppeging event.
In 2025 we can notice the spike that is January 2025, where almost 10B more USDC was put in circulation. This month recorded the highest amount of new USDC printed. Each month in 2025 is positive except for May, when there was negative 1B. September was also quite a good month for USDC with 7.5B put in circulation.
USDC Supply
The chart for the USDC supply looks like this.
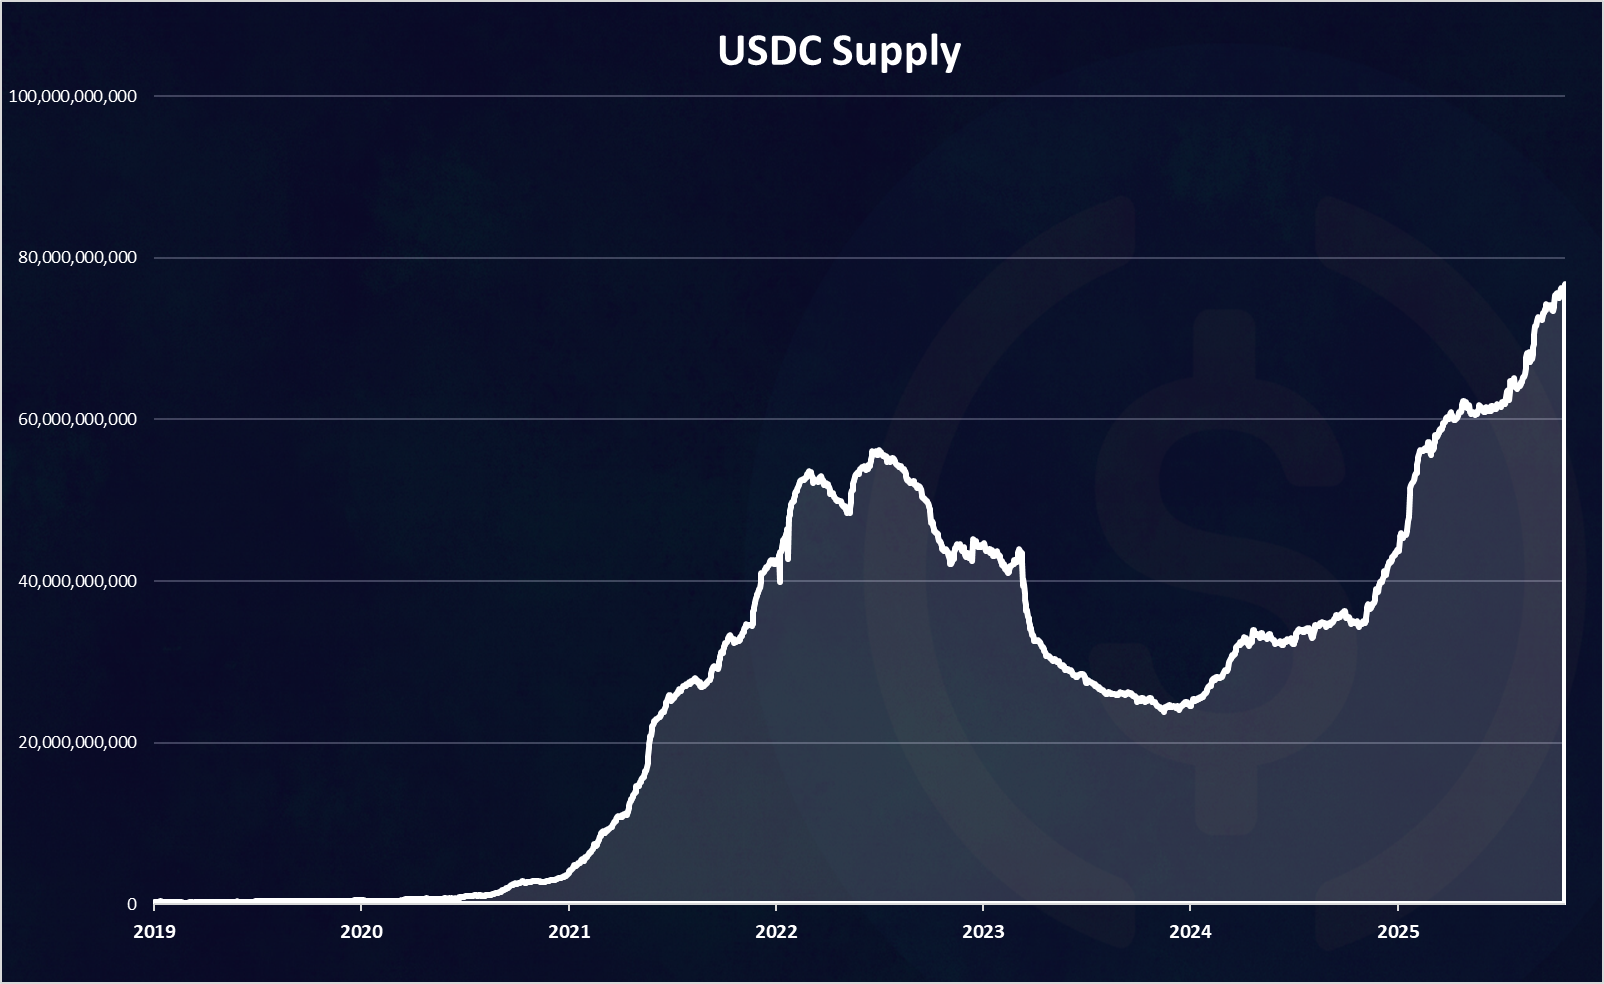
We can see that prior to 2020, the marketcap of USDC was negligible, with under 1B in supply. Then there was a huge increase in 2021 when almost 40B USDC added to the supply. The peak for the USDC market cap was in June 2022, with around 55B in market cap. At this time Tether was experiencing FUD, and a lot of the stablecoins were transferred to USDC. Since the summer of 2022, the supply of USDC has went down, with a massive drop in March 2023 . Since the beginning of 2024 the market cap of USDC has started growing again and has been growing much faster at the end of 2024 and in 2025 again, reaching a new ATH of 76B.This is far above the previous one when it was at 55B.
If we zoom in, we have this.
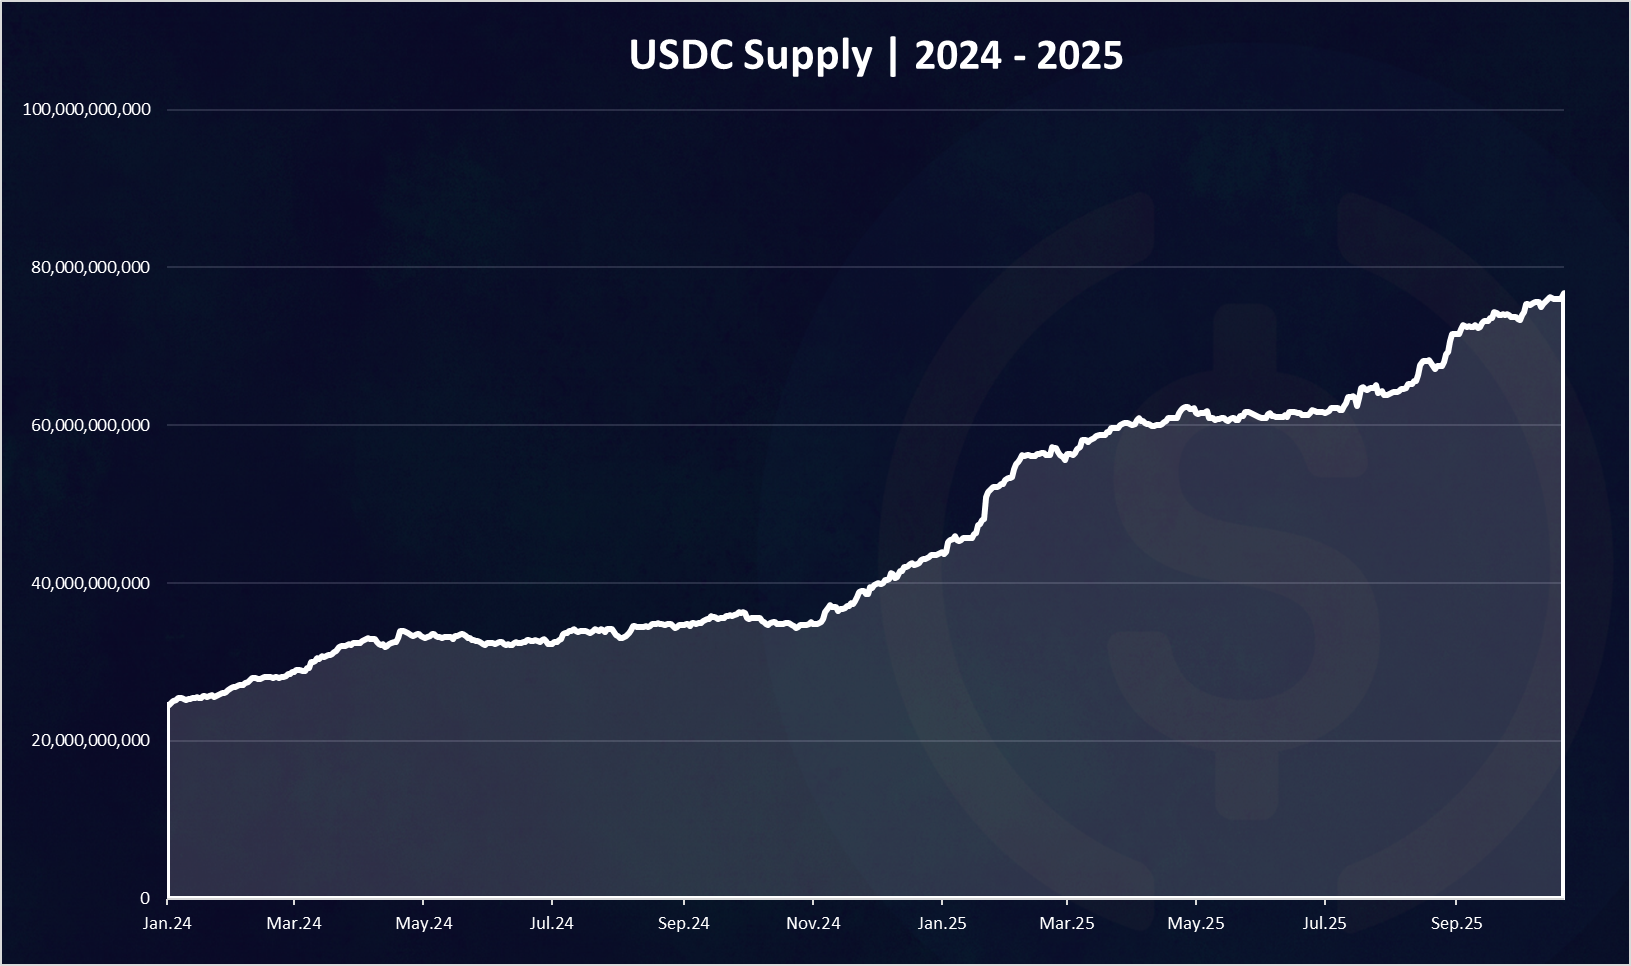
This is for the last two years, 2024 and 2025. We can see that there was a steady growth in the period, with most of it happening at the end of 2024 and the beginning of 2025. In the last months there has been some more growth again, especially in September 2025.
USDC Allocation on Different Chains
USDC is centrally issued but can live on multiple chains. Here is the chart.
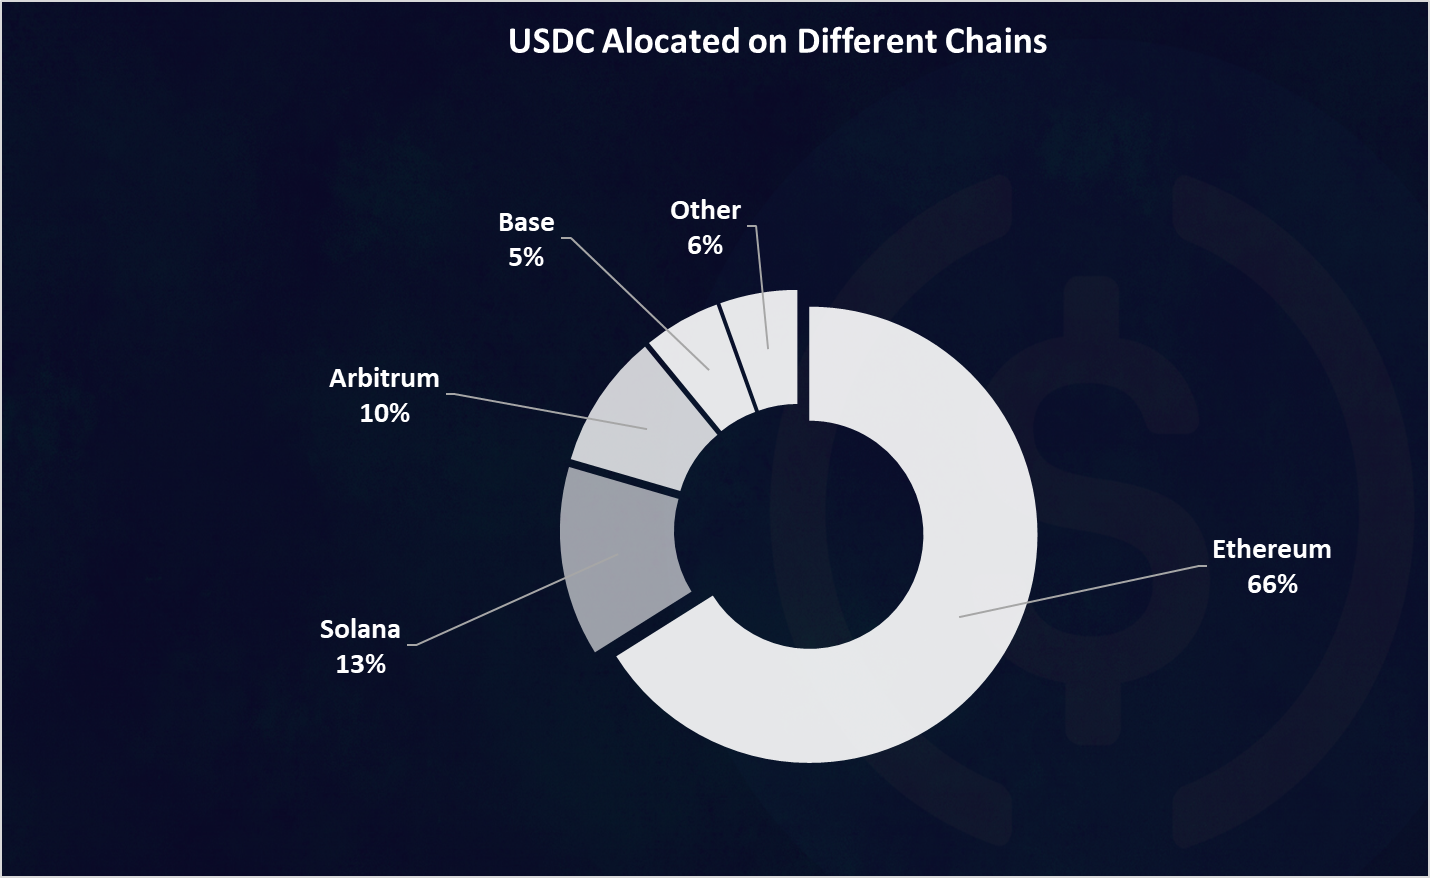
Obviously, the big share of USDC remains on Ethereum with 66% share (50B), but it was even higher in the past up to 80% at some point. We can notice that Solana is now on the second spot with USDC allocation of 13% of the USDC is there now or 10B. This growth happened at the end of 2024, and some more recently. Interesting Arbitrum is now at 10%. Base comes on the fourth spot with 5% of the USDC supply there.
USDC VS USDT
How is USDC doing against the number one stablecoin Tether? Tether was founded three years before USDC, so it has some head start. Is USDC managing to catch up?
Here is the chart.
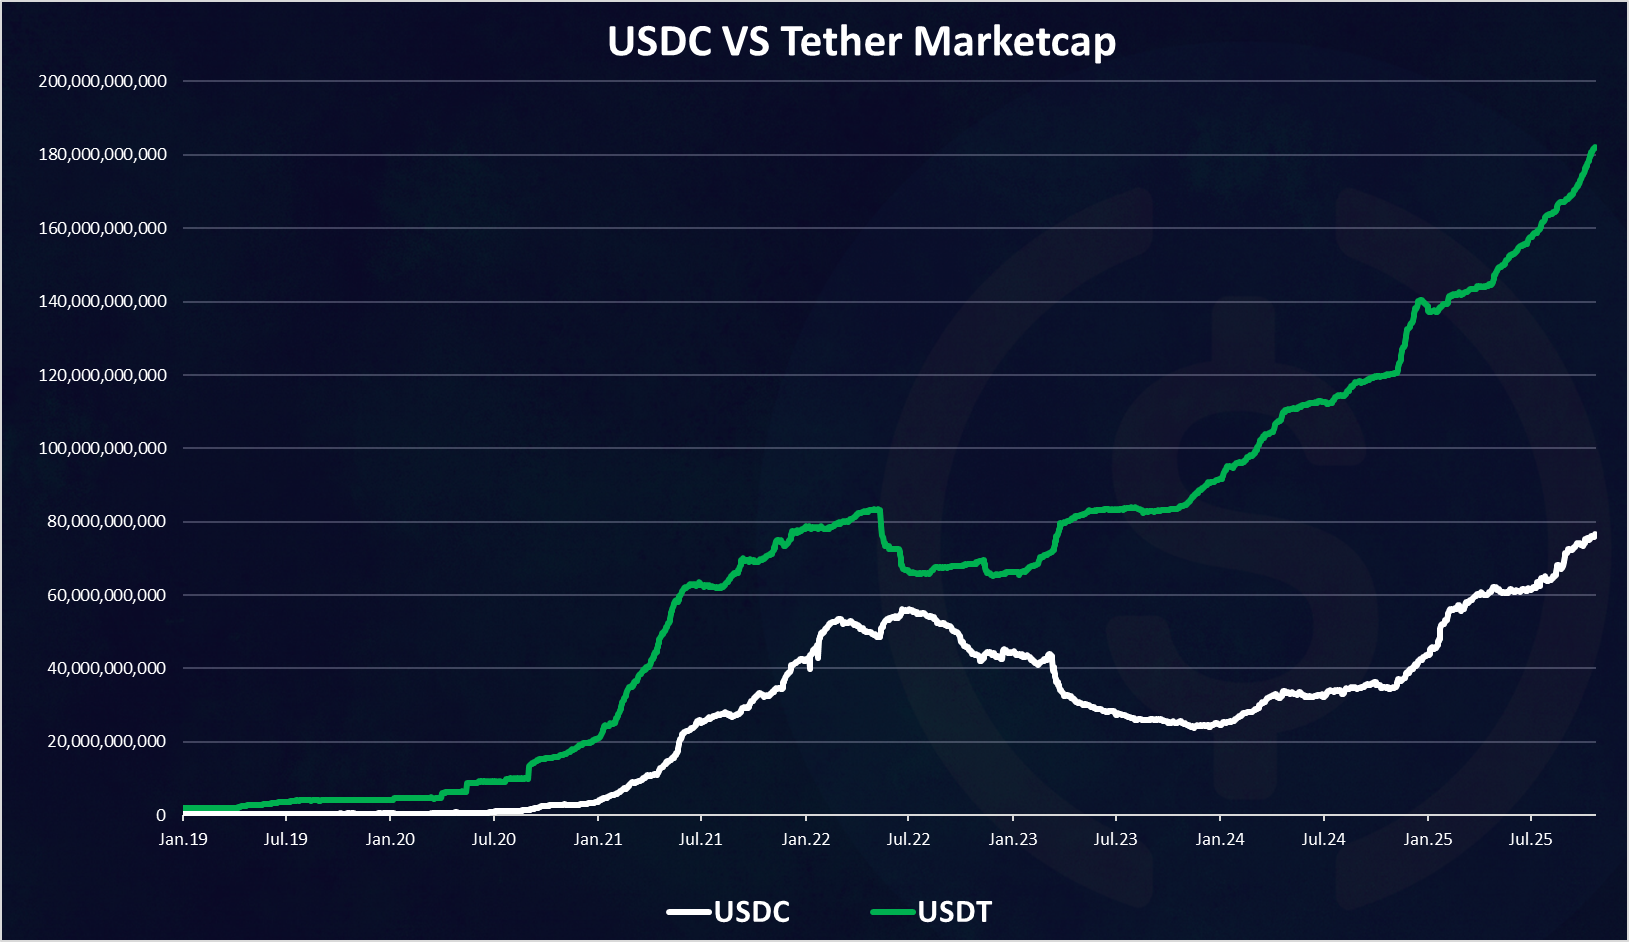
At first these two were both growing on a similar pace in the bull market of 2020 and 2021. The in 2022 when the bear market kicked in the correlation between the two became almost negative, when one was growing, the other was falling. Tether came out as the stronger from the bear market can consolidated its number one position even further. In the last year both of these tokens have been growing again in marketcap but we can notice that Tether is clearly outperforming USDC. Tether has now more than 180B in marketcap, while USDC is at 76B. Both of these are big numbers, but Tether has obviously been the dominant player.
In relative terms % the chart looks like this:
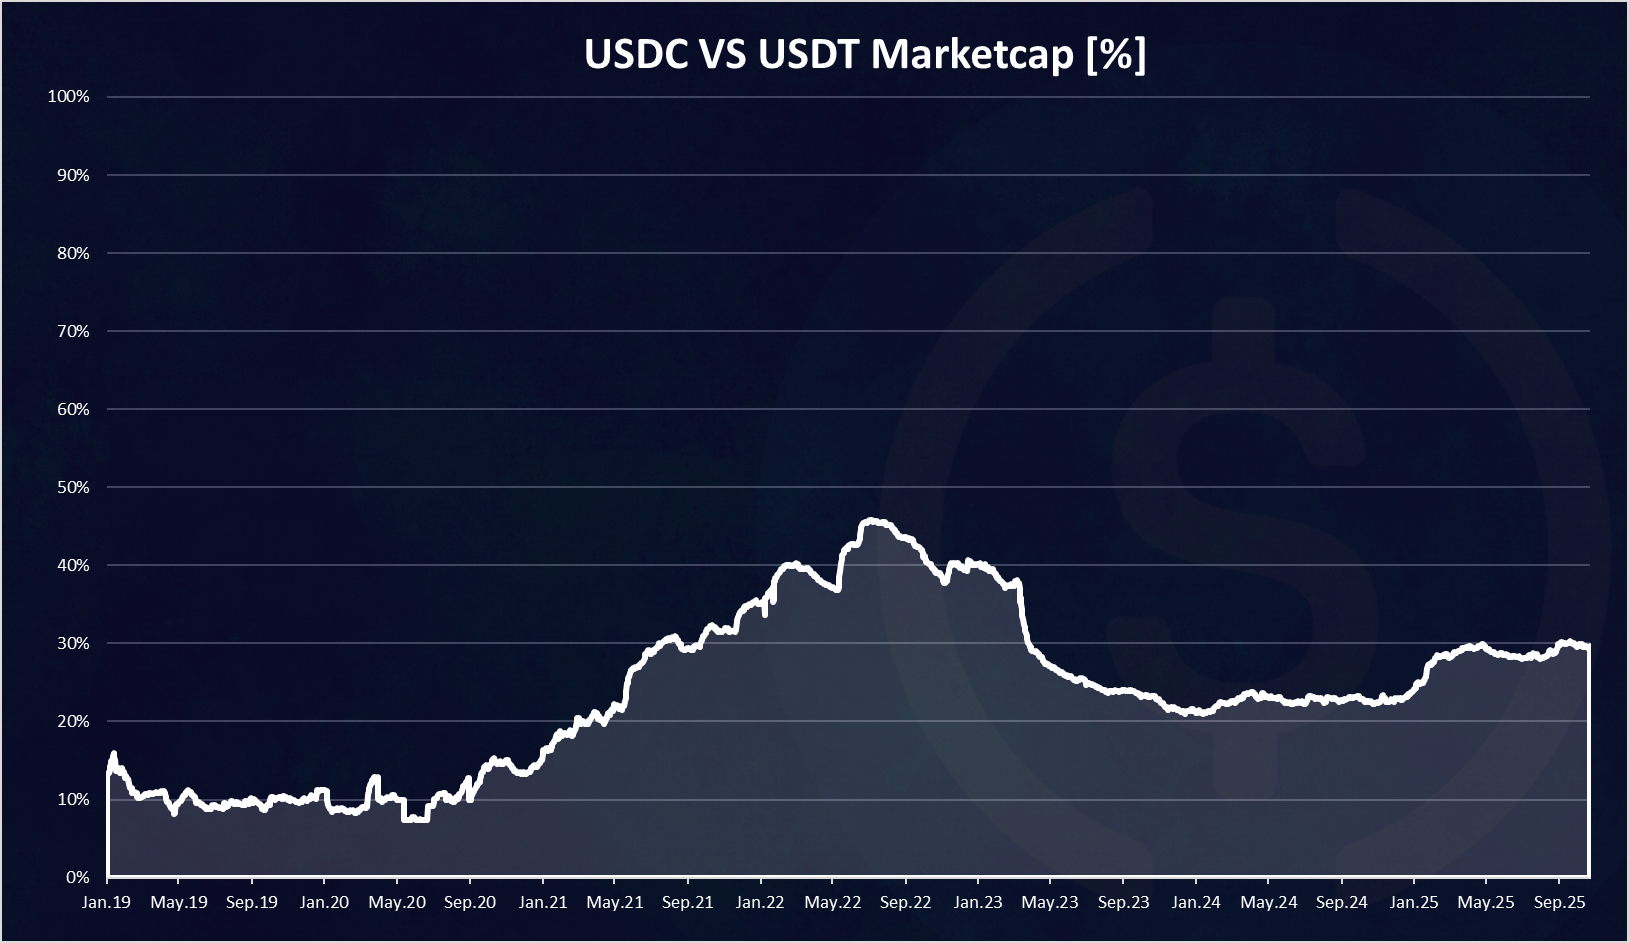
The USDC market share against Tether has been growing up until the summer of 2022, when it reached a 45% of the USDT and USDC marketcap (56B to 66B), and it was looking that at some point USDC will flip Tether, but then it lost momentum and started losing market share. It dropped to 20% at the end of 2023. In 2024 the USDC market share was hovering slightly above the 20% and has gained momentum in the last month of the year reaching almost 30% share after a long period of time. In 2025 the growth against Tether stopped and it has been mostly stagnant close to the 30% share.
All the best @dalz