I made some errors in the creation of my HBD charts recently. The last two posts had charts where the last few weeks were accidentally cut off. Below are some corrections.
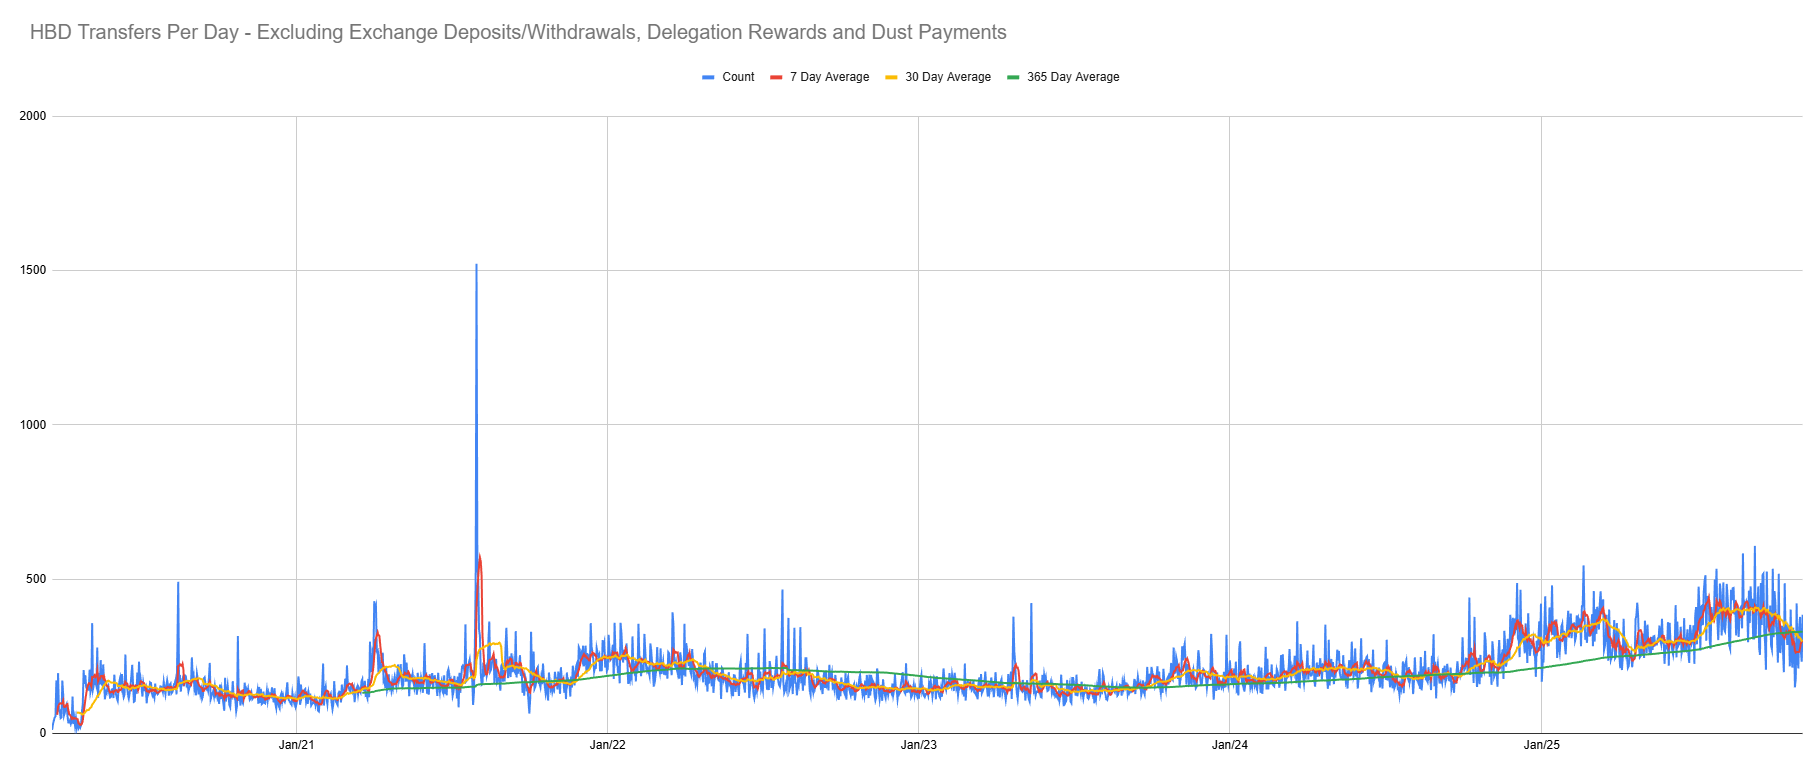
HBD Payments
It seems HBD payments have started to drop off recently.
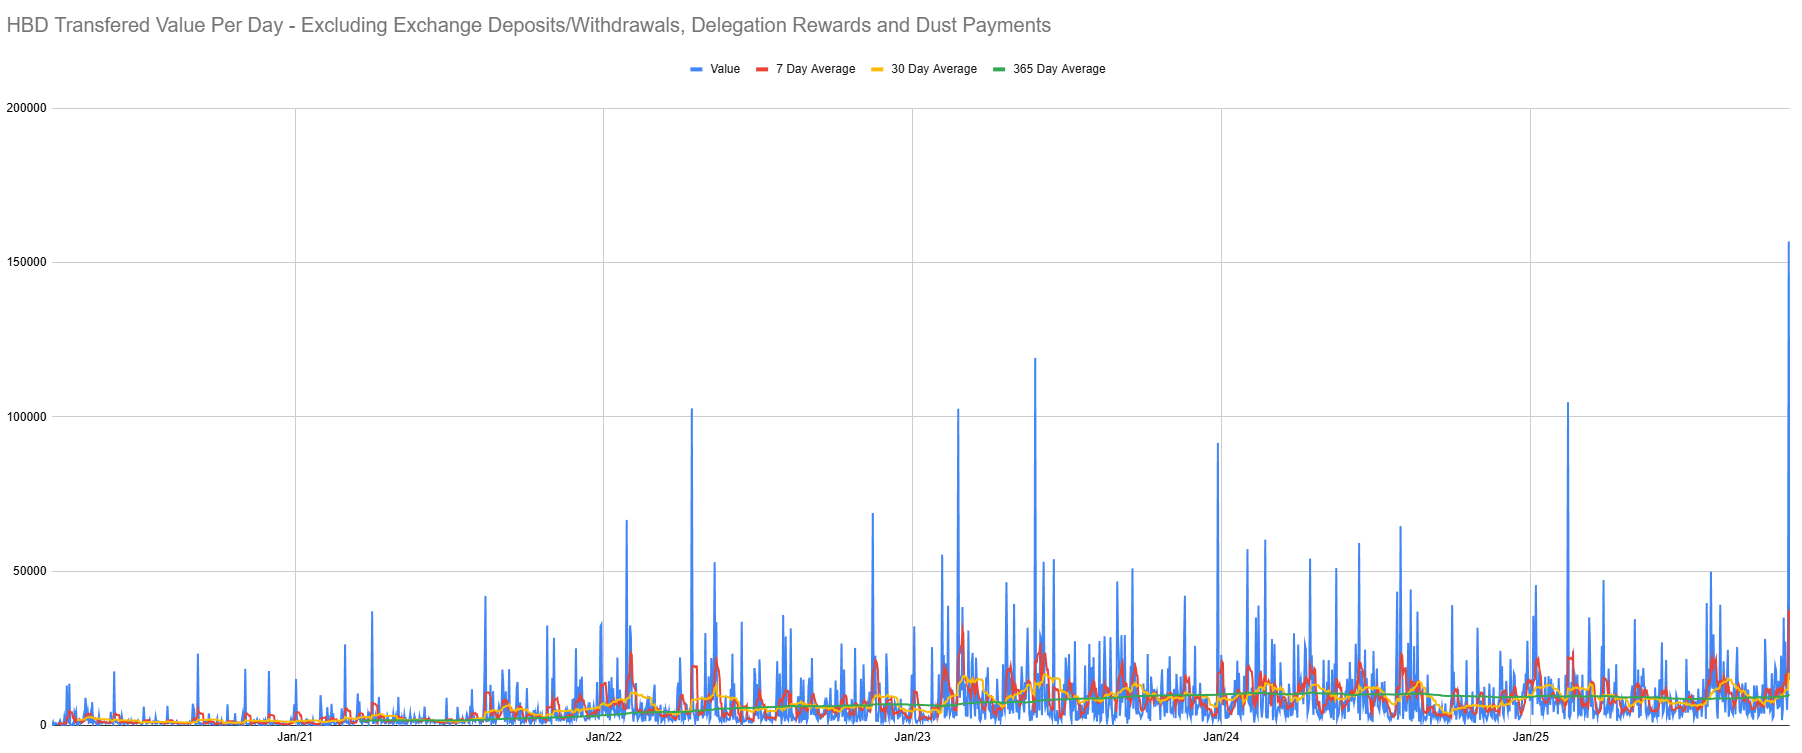
HBD Payments - Value Spent
On the other hand, value spent is rising recently.
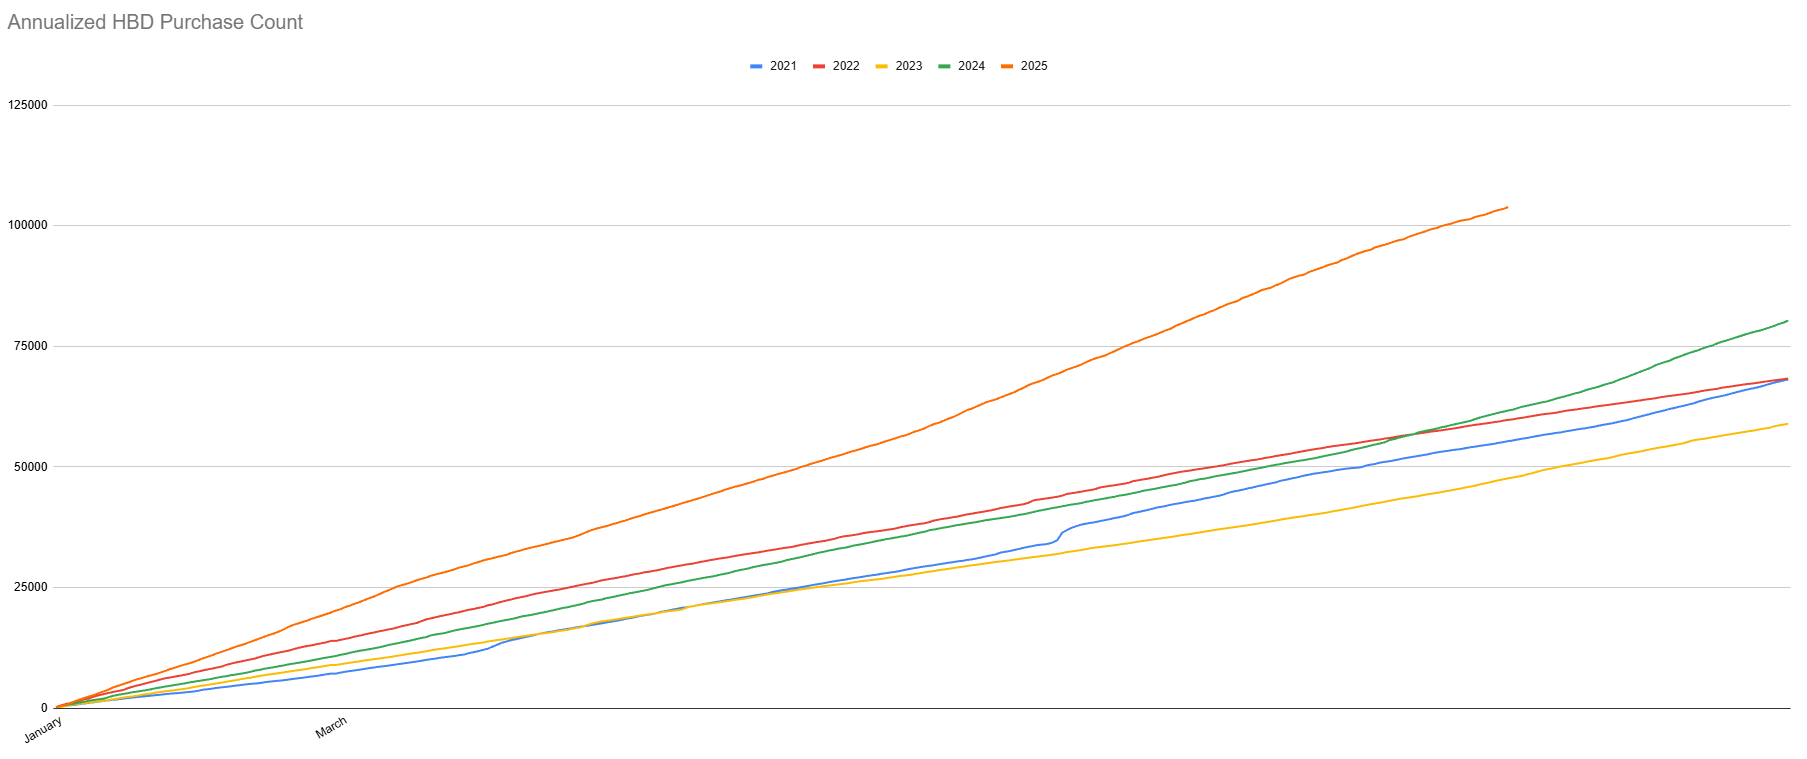
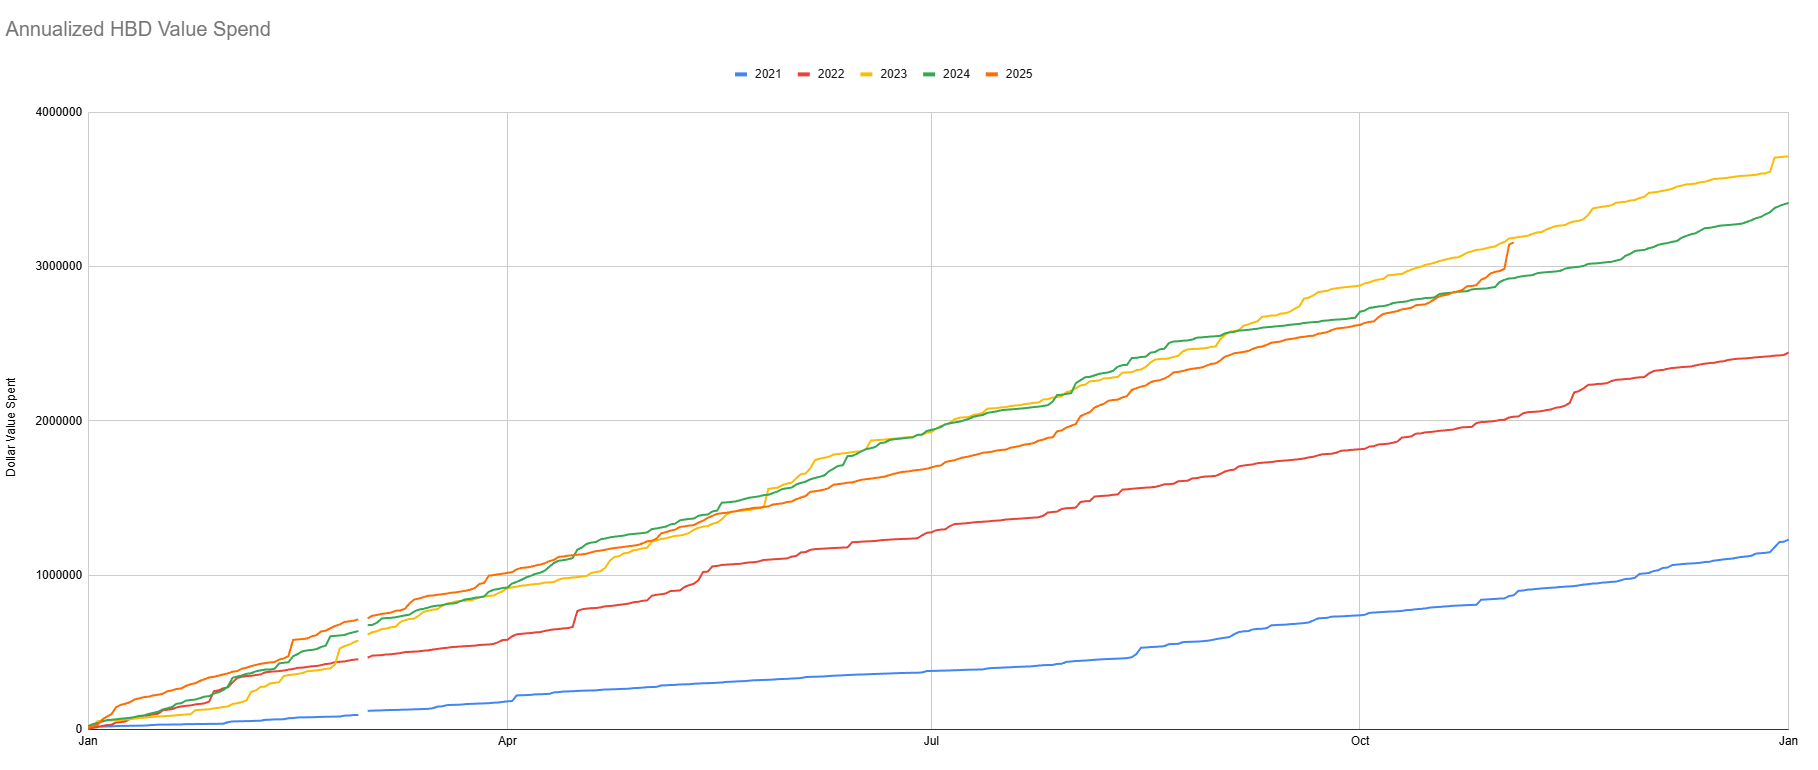
Annual comparison charts
2025 has also been a much better year for HBD compared to previous years than I recognized before. It is in fact looking to possibly exceed all other years in terms of value spent after all, and is way ahead in terms of purchase count.