EN
"Citizen Science" Project Activity Report 3 - Detector Effects and Event Reconstruction
By Enio...
Summary
This article is the third activity report in the context of the participatory research project Citizen science particle physics project on Hive led by @lemouth and undertaken by a number of blockchain enthusiasts. In it we will see the realization of the project tasks concerning _detector effects and event reconstruction_. The instructions laid out in this article have been followed. In the first attempt there were some exceptions related to the generation of PDF and DVI files. Configuration differences were also noticed when comparing with the tutorial in the mentioned article. An output HTML document could be obtained, but without the expected histogram. I ask @lemouth to please review my procedures in order to correct them and make the corresponding updates. ---Task 1: Getting started with MadAnalysis 5
In order to simulate the particle physics detector such as the one at CERN, it is necessary to install MadAnalysis5. To do this I rangit clone https://github.com/MadAnalysis/madanalysis5 to download the source code, which can be run immediately.
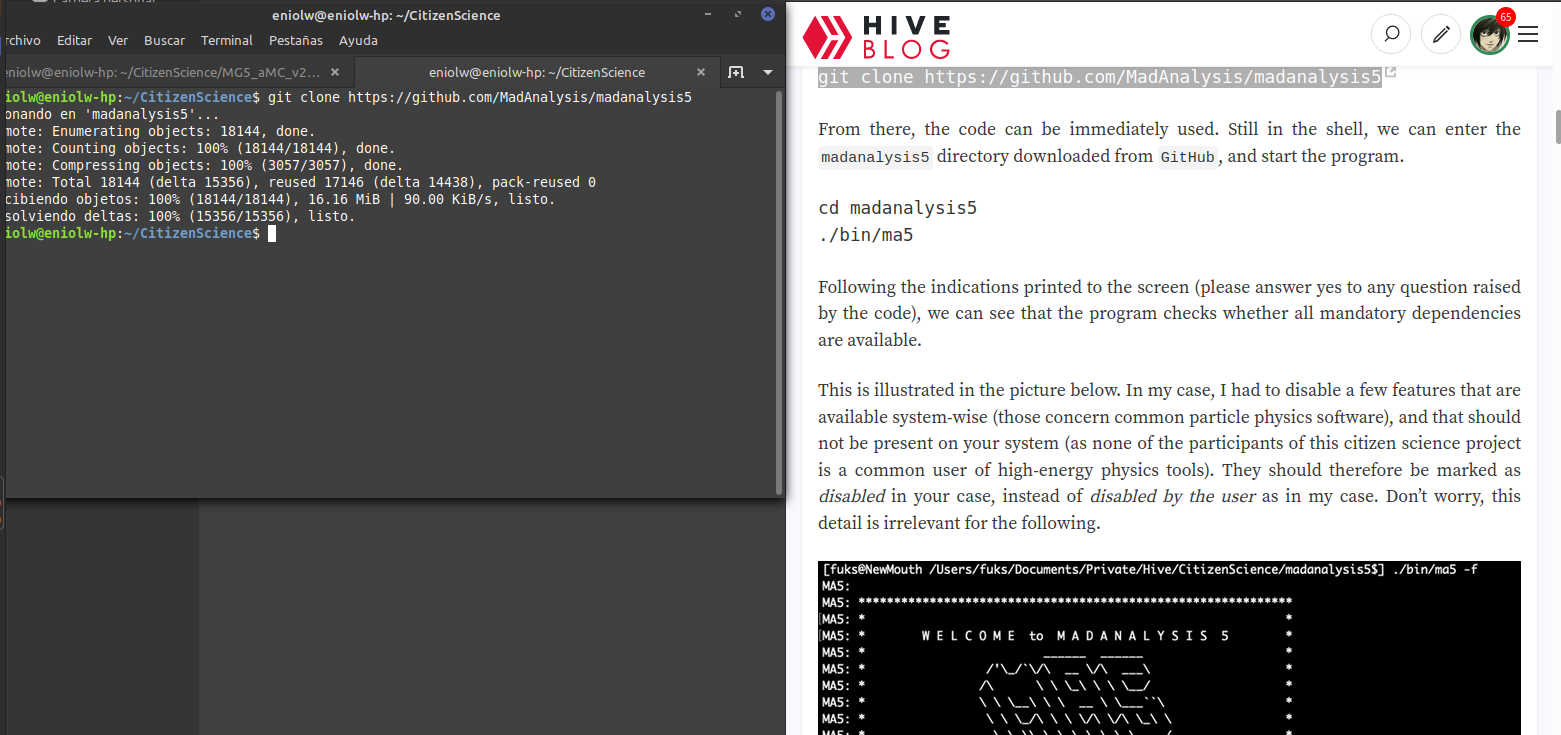
⬆️ Image 1: Downloading MadAnalysis5 from GitHub according to the instructions.
python3 alias, I had to do some configuration tweaking following the instructions at this post to create that alias and have python call to the Python 3 program. Once that was done, MadAnalysis5 ran normally.
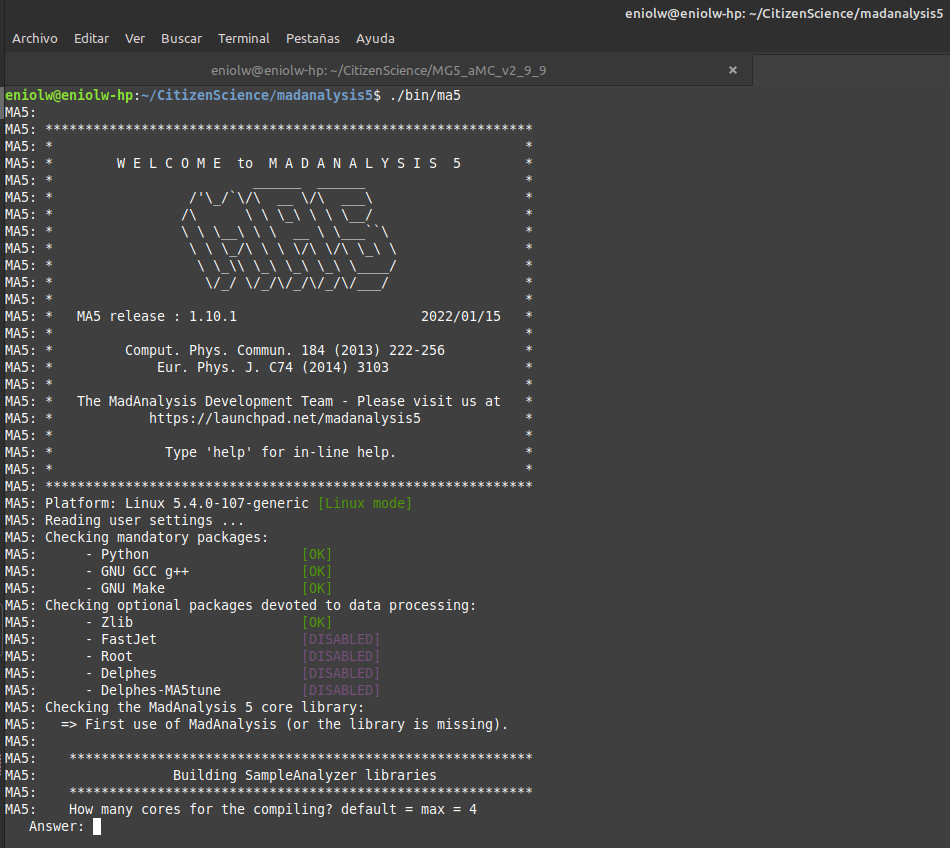
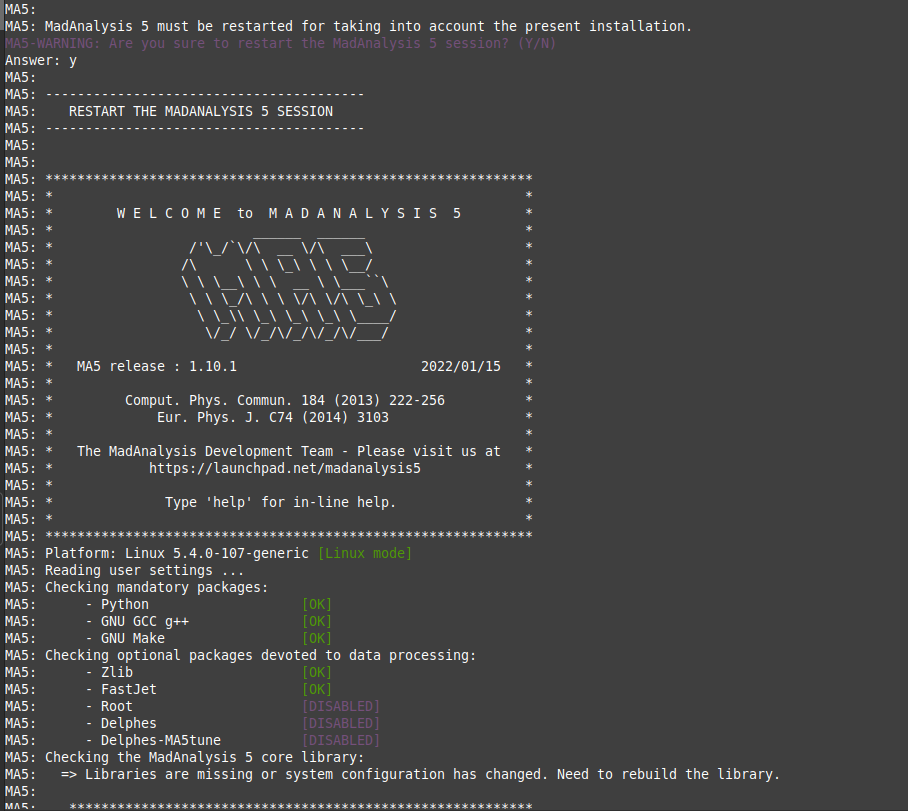
⬆️ Image 2: MadAnalysis5 is working fine.
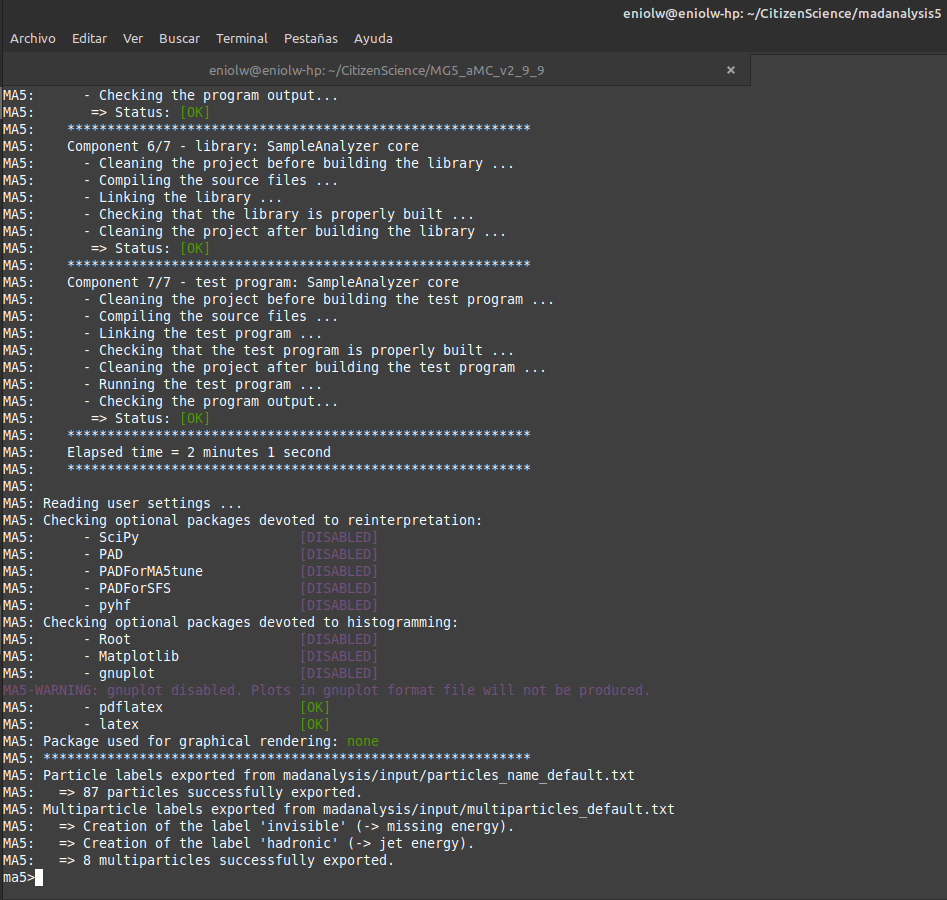
⬆️ Image 3: Output.
Task 2: Additional packages
I installed zlib and fastjet usinginstall zlib and, after restarting MadAnalysis5, I used install fastjet (funny names by the way).
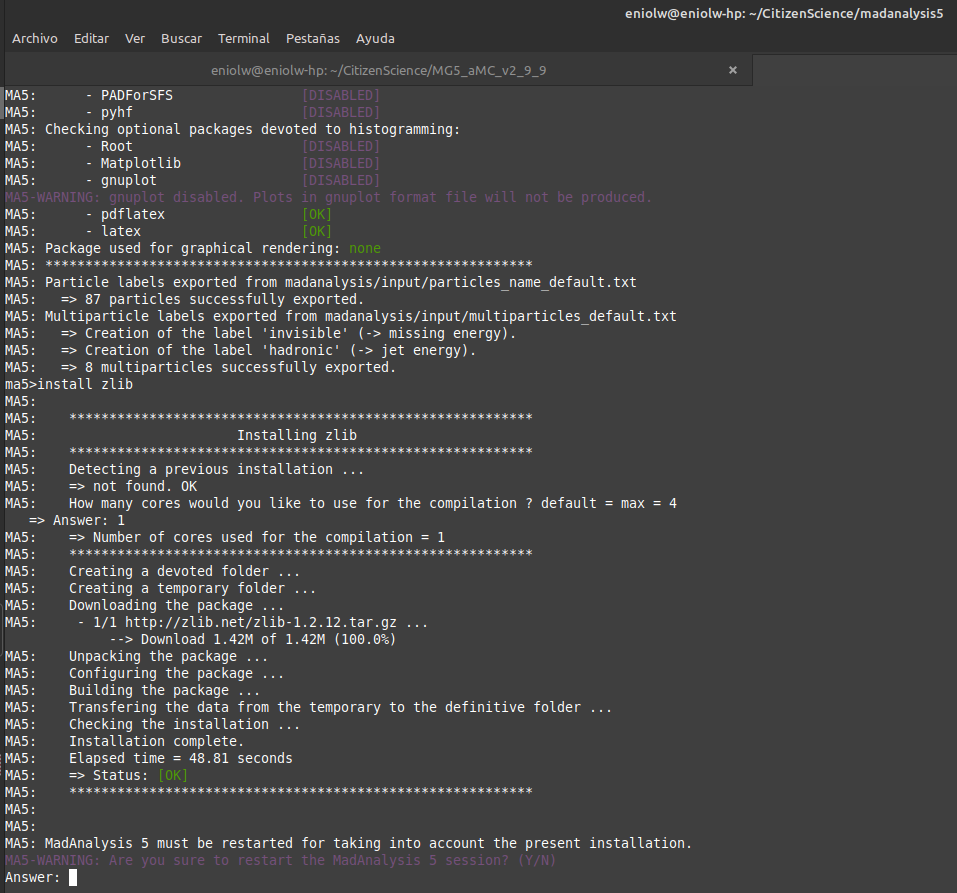
⬆️ Image 4: Installed zlib. You can see that matplotlib is still marked as disabled, since I didn't notice it yet.
⬆️ Image 5: Installed zlib and fastjet and restarted MadAnalysis5 once again.
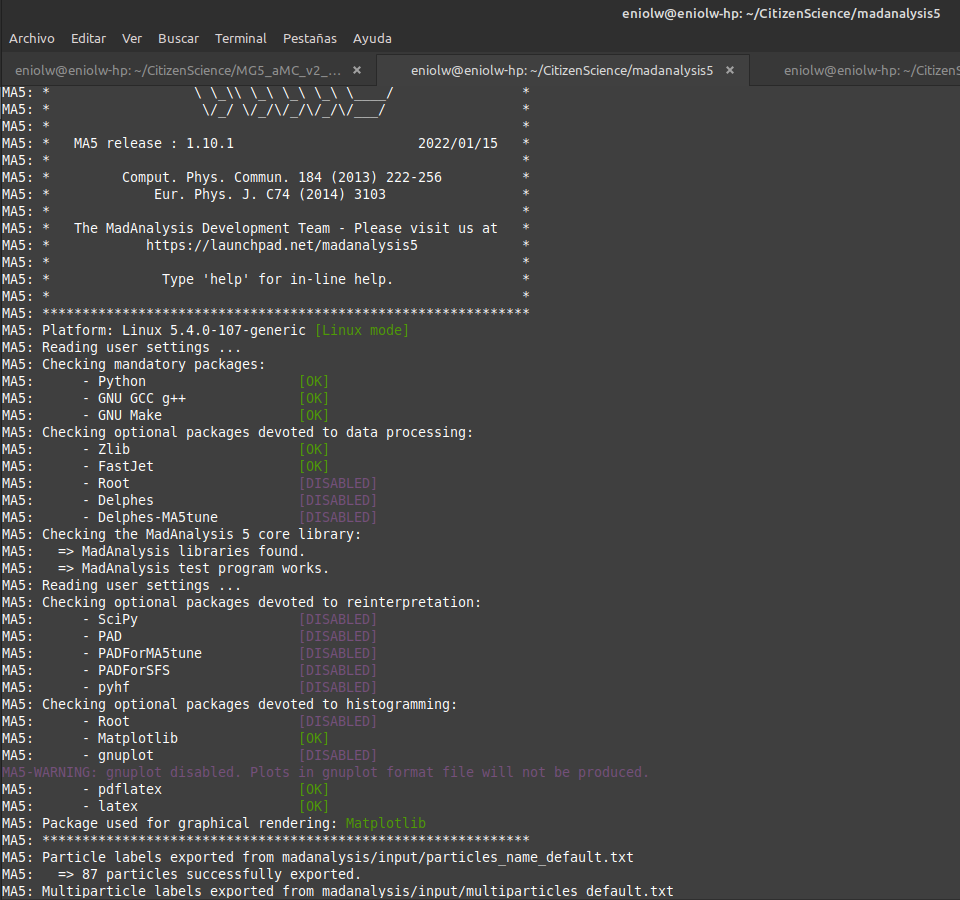
⬆️ Image 6: Matplotlib is already installed and enabled.
Task 3: Top-antitop simulations
I'm still getting ready to do some physics. I copied the path to the file tag_1_pythia8_events.hepmc.gz generated with the past activity and then restarted Ma5 with./bin/ma5 -R madanalysis/input/ATLAS_default.ma5. I ran the other instructions (import , set main.outputfile=myeventstoo.lhe.gz and submit) . This took a while to run, but in the end I got this output:
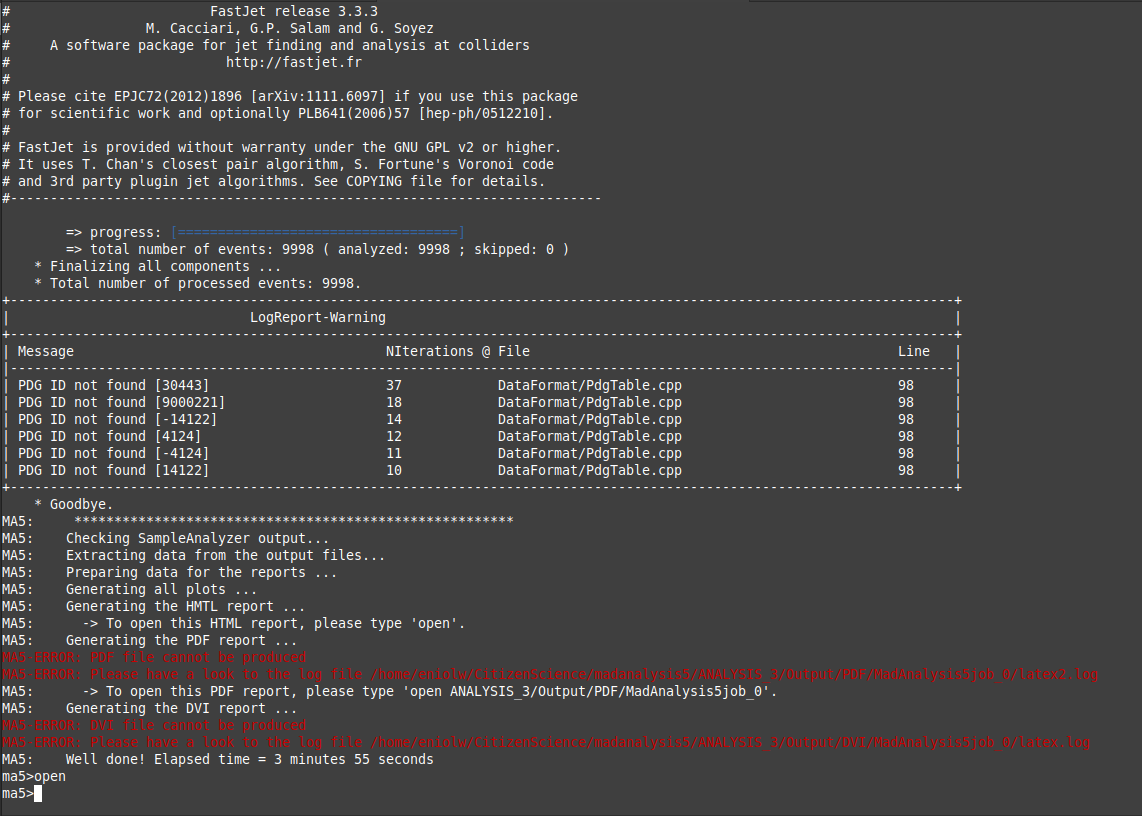
⬆️ Image 7: Oops, there are some issues.
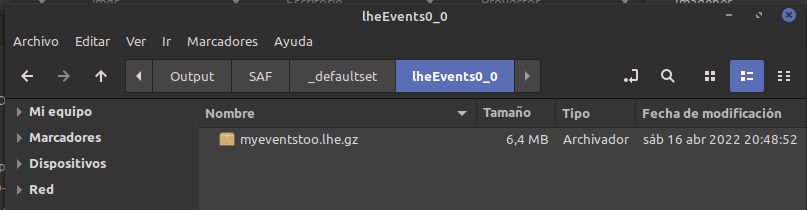
⬆️ Image 8: There it is. The file was generated as expected.
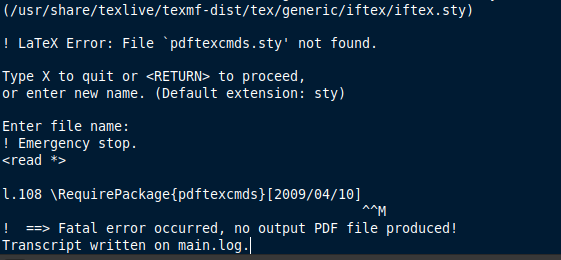
⬆️ Image 9: And this is the log output (.../madanalysis5/ANALYSIS_3/Output/PDF/MadAnalysis5job_0/latex2.log)
! LaTeX Error: File `pdftexcmds.sty' not found. Type X to quit orWhich is basically the same exception.to proceed, or enter new name. (Default extension: sty) Enter file name: ! Emergency stop. l.108 \RequirePackage{pdftexcmds}[2009/04/10] ^^M No pages of output. Transcript written on main.log.
Task 3: Some physics
I decided to go ahead and see if this could work after all. I ran the commands:import ANALYSIS_0/Output/SAF/_defaultset/lheEvents0_0/myeventstoo.lhe.gz as ttbar
set ttbar.xsection = 505.491
plot NAPID
submit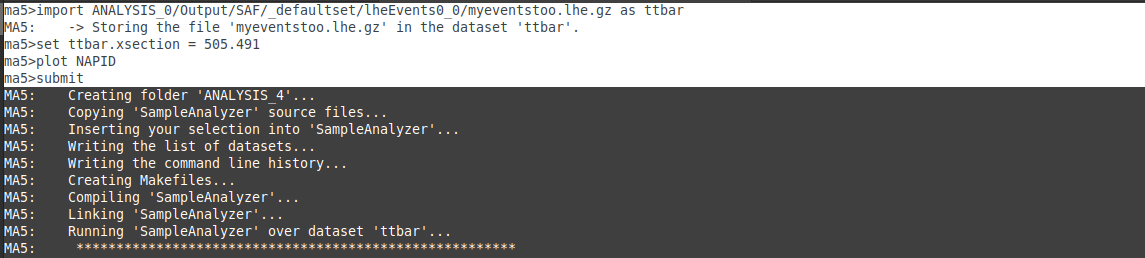
⬆️ Image 10: Entering the commands to do some physics.
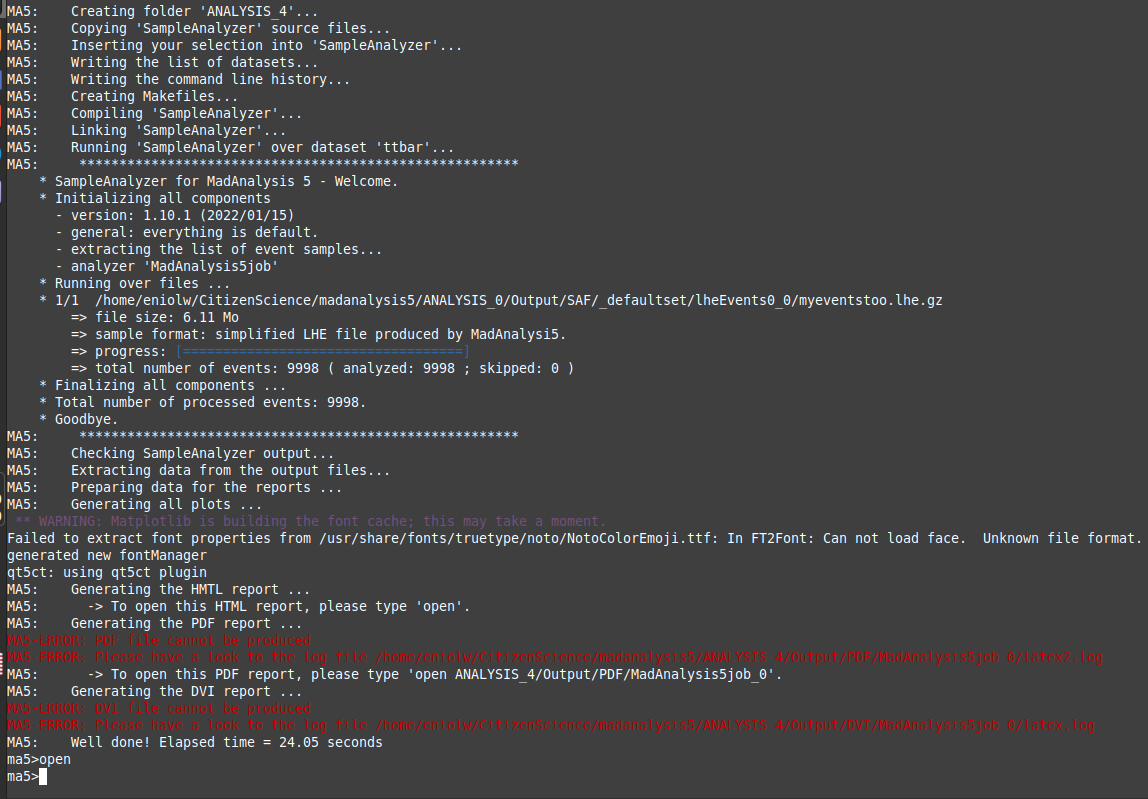
⬆️ Image 11: An alarming output?
Open command, as suggested by the output, opened the web browser displaying this page:
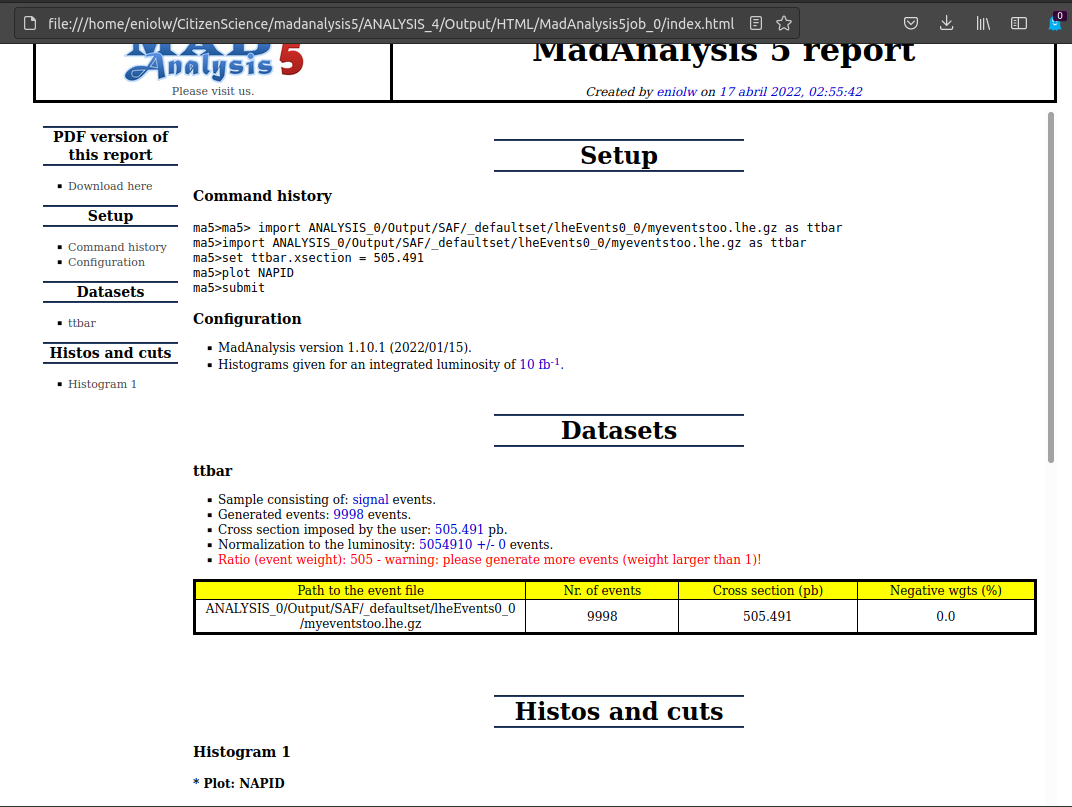
⬆️ Image 12: HTML document generated.
UPDATE 2022/04/26:
Finally I have obtained the expected outputs. Getting to this was quite a "journey" that had many stops and definitely deserves its own post. Essentially I had to get another computer where I could fully install TexLive (2022), reinstall and repeat all the tasks of this project from scratch and read a lot of documentation and support forums to overcome every exception that appeared. But it was worth it!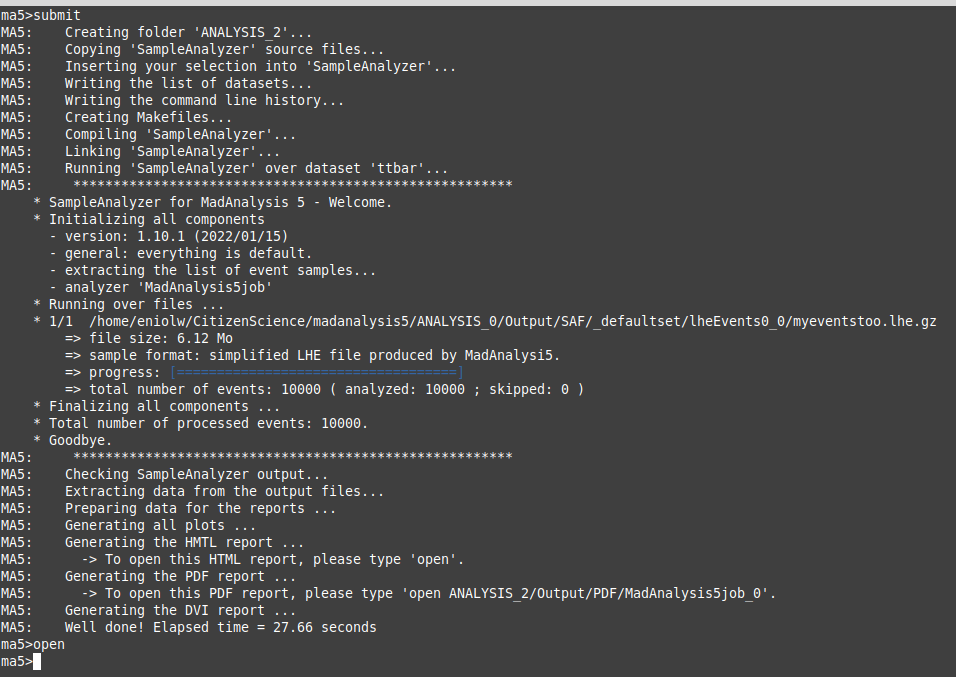
⬆️ Image 13: The expected output, no errors.
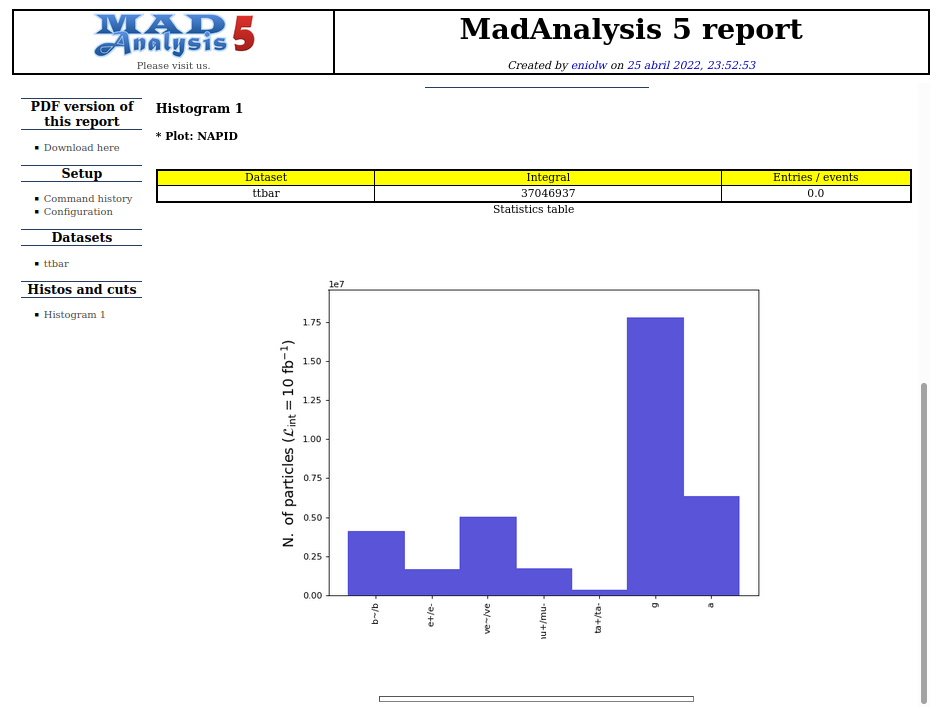
⬆️ Image 14: Histogram generated.
Some References
My previous reports
If you are interested in more STEM (Science, Technology, Engineering and Mathematics) topics, check out the STEMSocial community, where you can find more quality content and also make your contributions. You can join the STEMSocial Discord server to participate even more in our community and check out the weekly distilled.
NOTES
- Unless otherwise stated, the images in this post are the author's.
ES
Reporte de actividades del proyecto "Ciencia Ciudadana" 3 - Efectos del detector y reconstrucción del evento
Por Enio...
Resumen
Este artículo es el tercer reporte de actividades en el contexto del proyecto de investigación participativa Citizen science particle physics project on Hive dirigido por @lemouth y emprendido por una serie de entusiastas de la blockchain. En él veremos la realización de las tareas de proyecto en lo referido a los _efectos de los detectores y reconstrucción de eventos_. Se han seguido las instrucciones planteadas en este artículo. En el primer intento se produjeron unas excepciones relacionadas con la generación de archivos PDF y DVI. También se apreciaron diferencias de configuración al comparar con el tutorial en el artículo mencionado. Se pudo obtener un documento HTML de salida, pero sin el histograma esperado. Agradezco a @lemouth la revisión de mis procedimientos a fin de corregirlos y hacer las actualizaciones correspondientes. ---Tarea 1: Empezar a utilizar MadAnalysis 5
Para poder hacer la simulación del detector de física de partículas tal como el del CERN es necesario instalar MadAnalysis5. Para ello ejecutégit clone https://github.com/MadAnalysis/madanalysis5 para descargar el código fuente, que puede ser ejecutado inmediatamente.
⬆️ Imagen 1: Descargando MadAnalysis5 de GitHub según las instrucciones.
python3, tuve que hacer unos ajuste de configuración siguiendo las instrucciones en este post para crear ese alias y hacer que python invoque al programa Python 3. Una vez hecho eso, MadAnalysis5 se ejecutó normalmente.
⬆️ Imagen 2: MadAnalysis5 funcionando bien.
⬆️ Imagen 3: Salida tras las compilaciones.
Tarea 2: Paquetes adicionales
Instalé zlib y fastjet usandoinstall zlib y, tras el reinicio de MadAnalysis5, install fastjet (curiosos nombres por cierto).
⬆️ Imagen 4: Instalado zlib. Puede verse que matplotlib sigue marcado como disabled, puesto que aún no lo notaba.
⬆️ Imagen 5: Inslaldos zlib y fastjet y reiniciado MadAnalysis5 una vez mas.
⬆️ Imagen 6: Matplotlib ya está instalado y marcado como enabled.
Tarea 3: Simulaciones de top-antitop
Sigo preparándome para hacer algo de física. Copié la ruta al archivo tag_1_pythia8_events.hepmc.gz generado con la actividad pasada y acto seguido reinicié a Ma5 con./bin/ma5 -R madanalysis/input/ATLAS_default.ma5. Ejecuté las demás instrucciones (import , set main.outputfile=myeventstoo.lhe.gz y submit). Esto tardó algo en ejecutarse, pero al final obtuve esta salida:
⬆️ Imagen 7: Ups, hay problemas.
⬆️ Imagen 8: Allí está. El archivo generado como se esperaba.
⬆️ Imagen 9: Y esta es la salida del log (.../madanalysis5/ANALYSIS_3/Output/PDF/MadAnalysis5job_0/latex2.log).
! LaTeX Error: File `pdftexcmds.sty' not found. Type X to quit orQue es básicamente la misma excepción.to proceed, or enter new name. (Default extension: sty) Enter file name: ! Emergency stop. l.108 \RequirePackage{pdftexcmds}[2009/04/10] ^^M No pages of output. Transcript written on main.log.
Tarea 4: Algo de física
Decidí seguir adelante para ver si esto podía funcionar después de todo. Ejecuté los comandos:import ANALYSIS_0/Output/SAF/_defaultset/lheEvents0_0/myeventstoo.lhe.gz as ttbar
set ttbar.xsection = 505.491
plot NAPID
submit⬆️ Imagen 10: Ingresando los comandos para hacer algo de física.
Payout: 0.000 HBD
Votes: 568
More interactions (upvote, reblog, reply) coming soon.