The first week of September is ending today, we have some data to analyze today, to see where we stand with $HIVE $BTC and the famous pair of ETH/BTC, which serves as an important indicator, especially in this phase of the cycle.
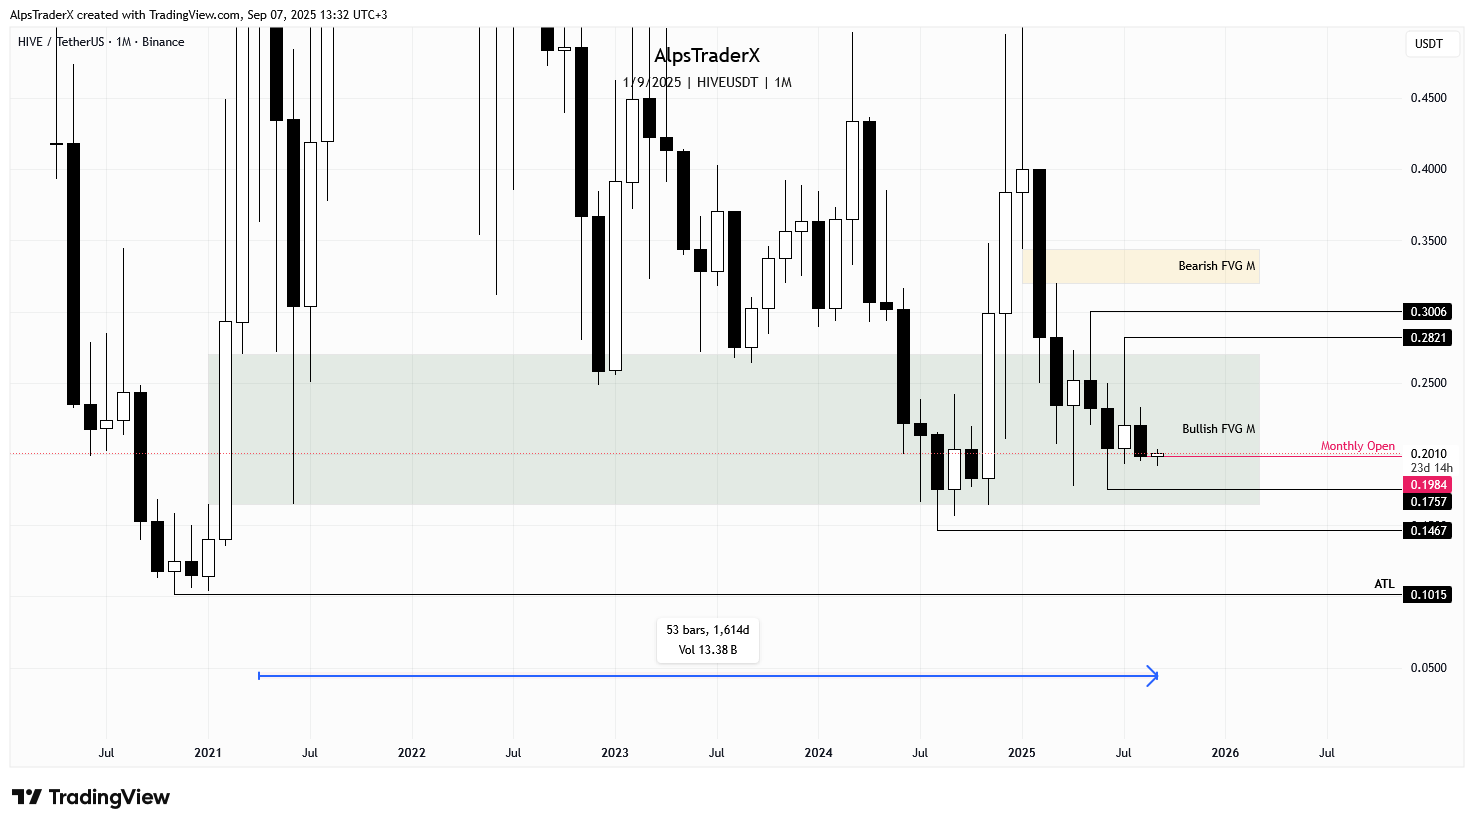
Too early to say anything about the current monthly candle as there are three weeks to go till the candle close, but the good news is, that at the time or writing, price is above the monthly open, which is $0.1984, which is the opening price, not reference to the George Orwell book.
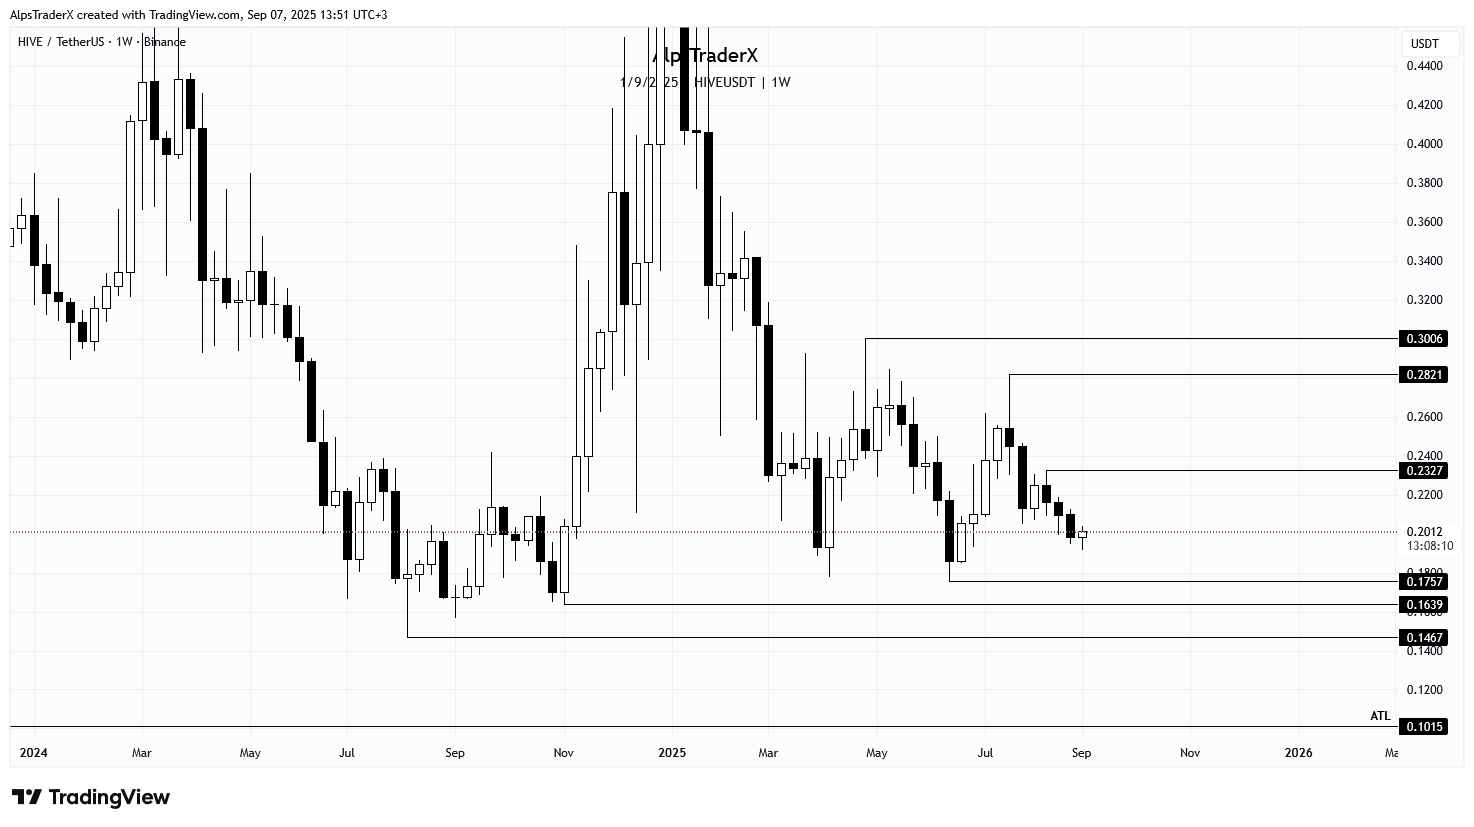
On the weekly time frame, price is below mid-range and still looks heavy. Still 13 hours to go till the candle close, but so far we have a bullish candle, with a very small body. Levels to watch are still the same as mentioned in my previous post, $0.1757 if there's more weakness and $0.2327, if we get a bounce here or at some point soon.
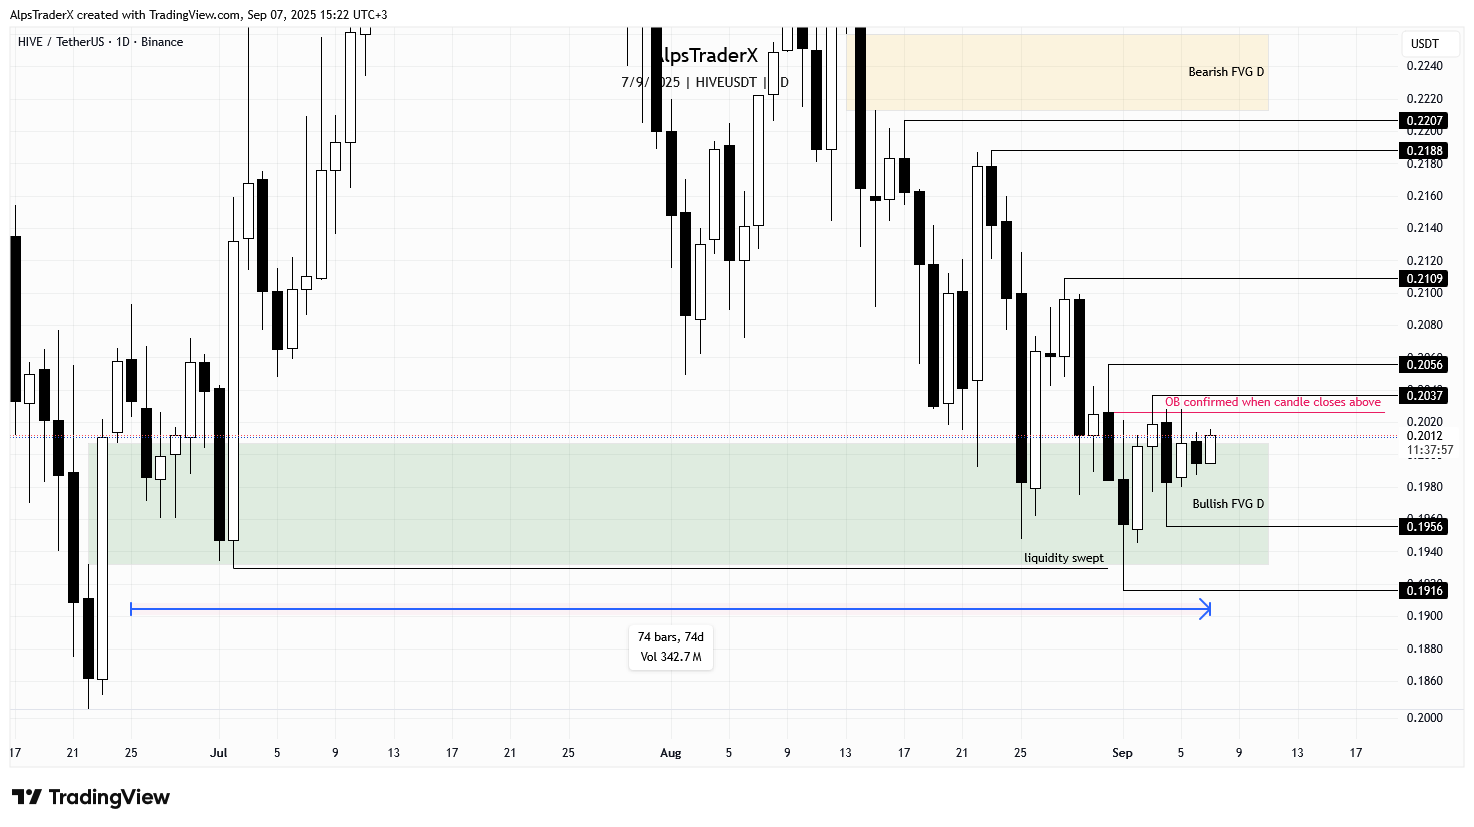
On the daily time frame, price retested the bullish gap that has been holding price for 74 days now. We got a nice bounce, but we're not out of the woods yet. Price needs to close above the red line, in order to confirm the bullish OB, which is at $0.2026. If we get that, $0.2037 and $0.2056 could be next.
In case of weakness, $0.1956 and $0.1916 are the wick lows I'd be looking at to be swept.
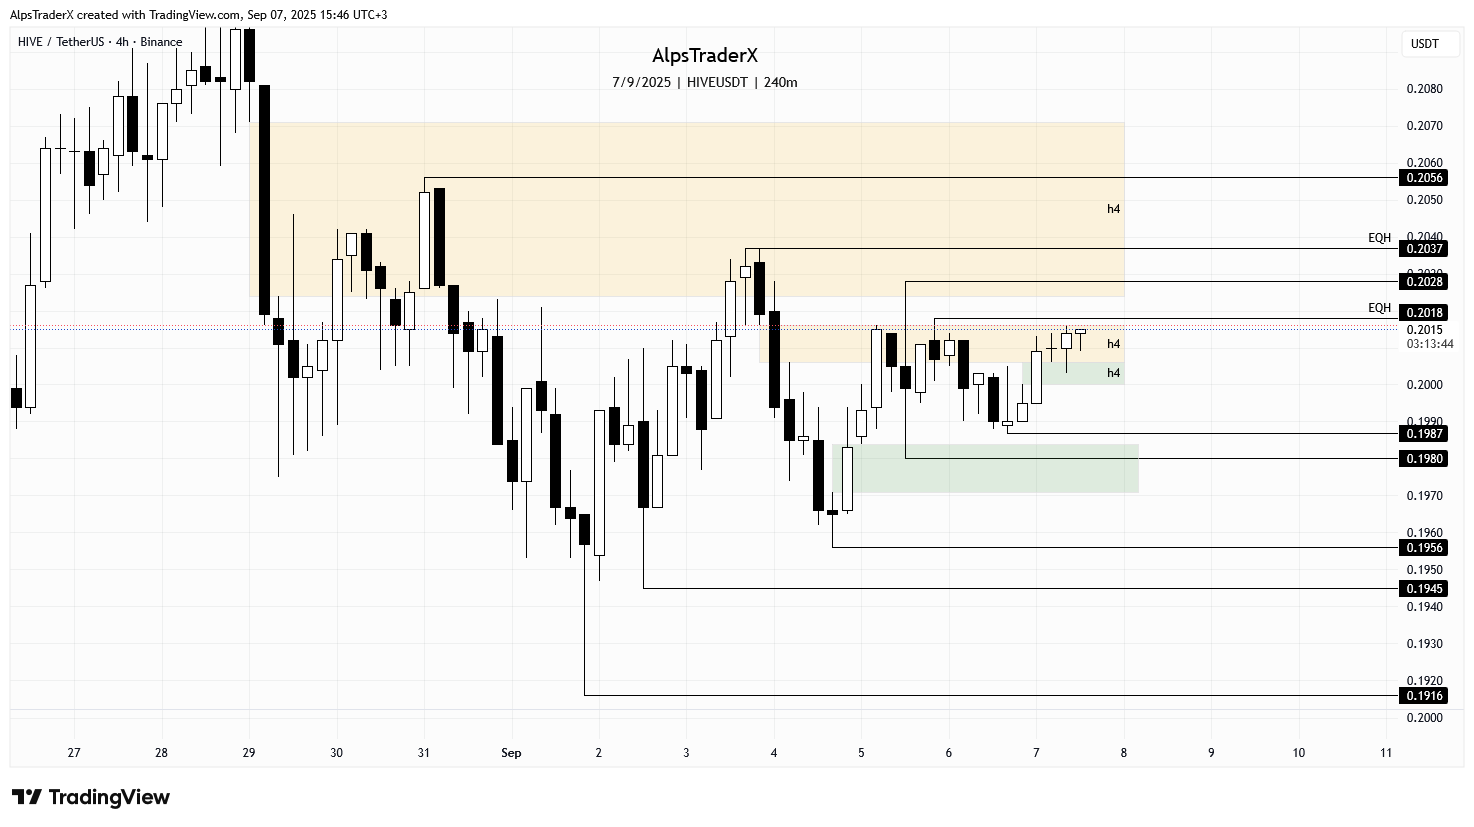
On a more granular scale, we have an interesting price action (PA). The h4 time frame chart shows price trying to close above the bearish gap is in right now and invert it. This gap has been capping the market since Friday. As I said in one of my snaps, the gap has already been fully rebalanced, should not mean resistance, so sooner or later price is going to invert it.
Today we got a bullish gap, which price retested with the last closed candle and it is above it now. $0.2018 is next on the upside, which is relative equal highs (EQH), then comes $0.2028, $0.2037 and $0.2056.
If we get another rejection here, levels to take into consideration on the downside are $0.1987 and $0.198.
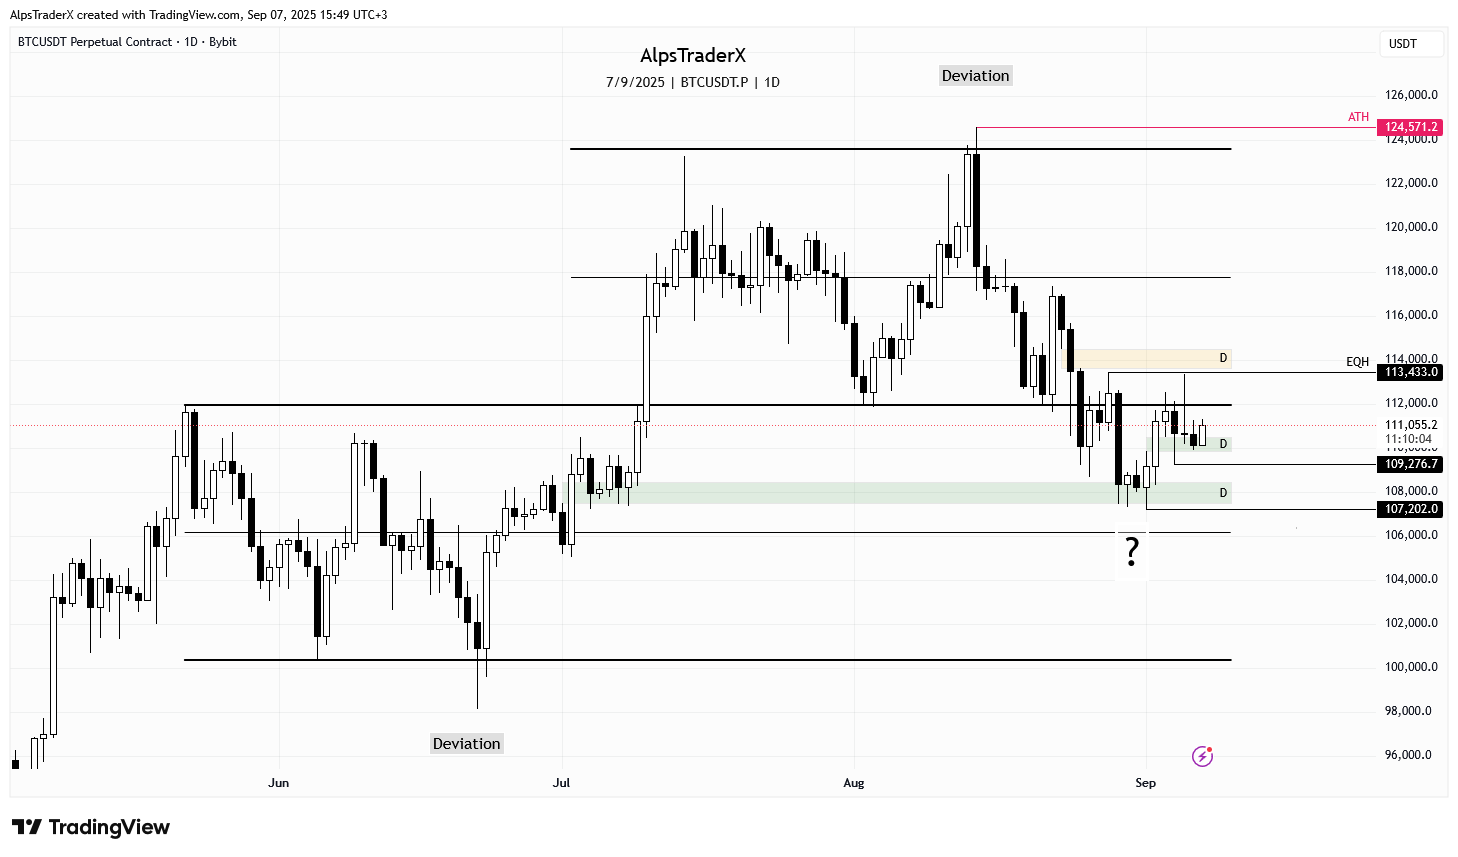
$BTC made a move to the upside this week, attempted to break inside the top range, which is an extrapolation of the previous one, but got rejected. There's a bullish gap that has been retested and holding price so far. Levels to watch are $113,433 on the upside and $109,276 on the downside, if we get some weakness.
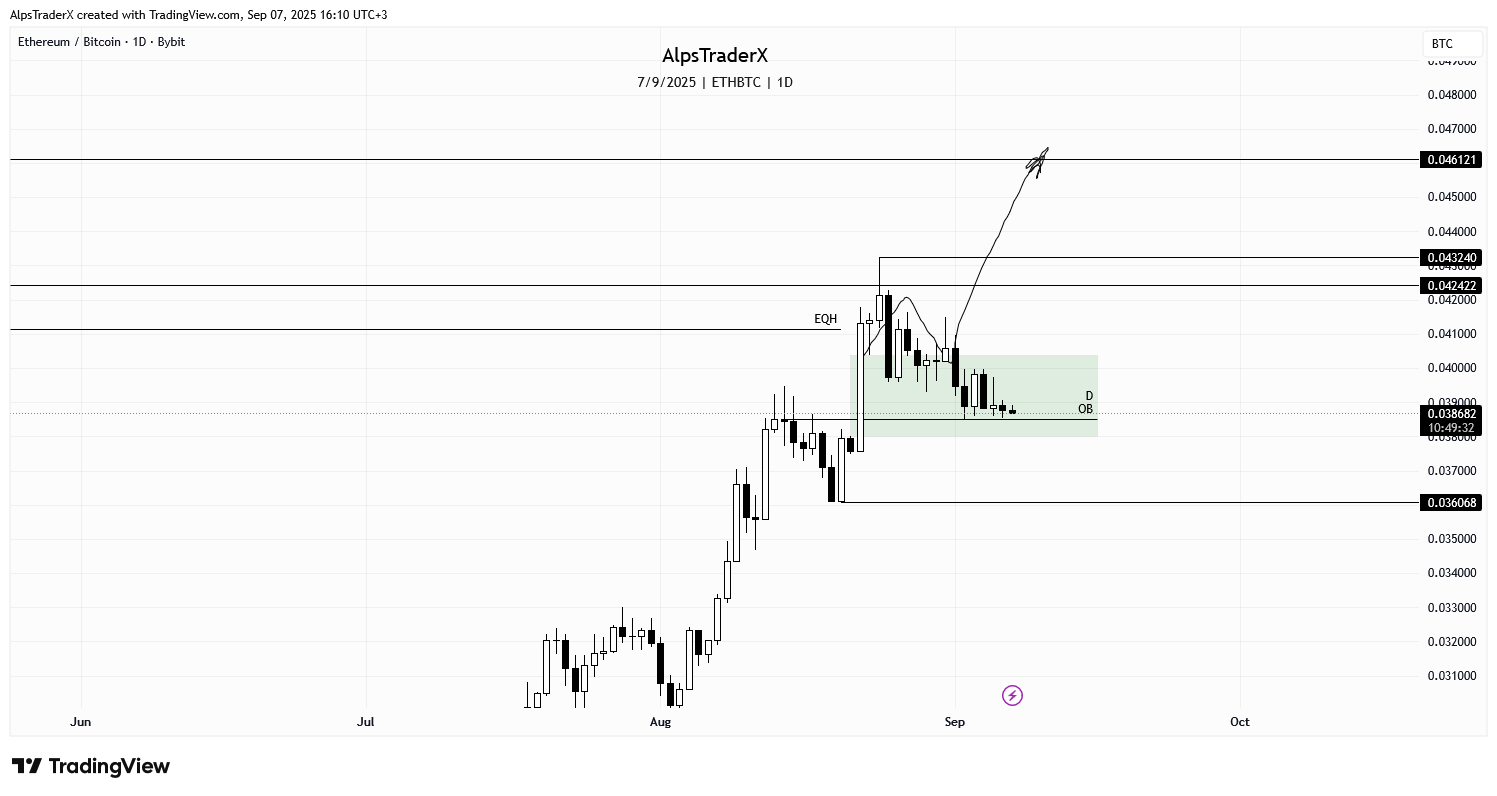
ETH/BTC is retesting the OB and has never closed below it, which is a good sign. Next week is decision time, the market has to show its hand, give us some indication of where it wants to go. As long as this level holds, we're good.
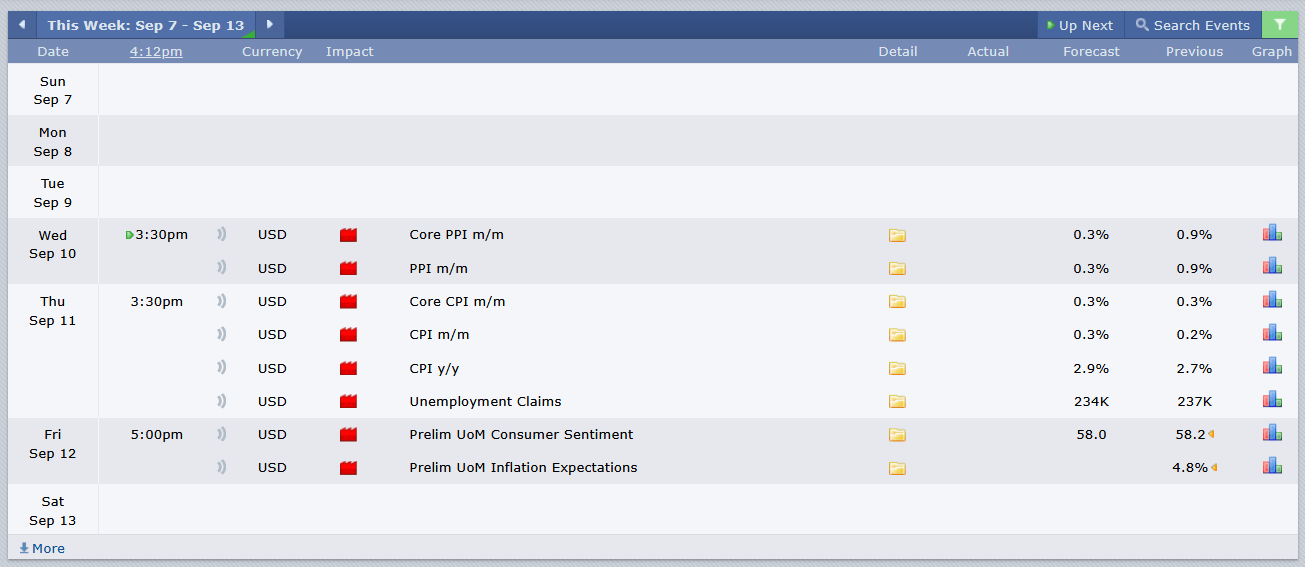
next week we have only 3 red folder days, but the data we are expecting is really important for the dollar, so expect volatility and manipulation.
For those of you who are interested, I've been posting updated on $HIVE on Snaps, keep an eye on it.
Remember, technical analysis is not about forecasting price, but about reacting to what price does.
As always, this is a game of probabilities, not certainties. Also please note, this is not financial advice, it's my view and understanding of the market.
All charts posted here are screenshots from Tradinview.
Come trade with me on Bybit.

If you're a newbie, you may want to check out these guides: - Communities Explained - Newbie Guide - Cross Posting And Reposting Explained, Using PeakD - Hive Is Not For Me - How To Pump Your Reputation Fast - Newbie Guide - Tips And Tricks & Useful Hive Tools For Newbies - More Useful Tools On Hive - Newbie Guide - Community List And Why It Is Important To Post In The Right Community - Witnesses And Proposals Explained - Newbie Guide - To Stake, Or Not To Stake - Newbie Guide - Tags And Tagging - Newbie Guide - Newbie Expectations And Reality - About Dust Vote And Hive Reward Pool, by libertycrypto27
