Here is another post in response to the task given by @lemouth on the ongoing citizen science project - a project that has to do with the simulation of particle collision using software instead of the real one ongoing at the Large Hadron Collider.
If my mathematics skill is still anything to go by, this should be the 4th task on the project. The previous 3 tasks are as below:
- Task 1: [Citizen science particle physics project on Hive - Let’s get started!](https://peakd.com/@lemouth/citizen-science-particle-physics-project-on-hive-let-s-get-started)
- Task 2: [Citizen science on Hive - simulating top quark production at CERN’s Large Hadron Collider](https://peakd.com/hive-196387/@lemouth/citizen-science-on-hive-simulating-top-quark-production-at-CERN-s-large-hadron-collider).
- Task 3: [Citizen science on Hive - detector effects and event reconstruction](https://peakd.com/hive-196387/@lemouth/citizen-science-on-hive-detector-effects-and-event-reconstruction)
The drill is, that anyone with a PC can participate in the project just by installing some software and following stepwise instructions as they are being spelled out by the instructor. The whole thing might look like a bunch of codes, however, one really does not need any coding knowledge to participate. I am a good example as I got zero knowledge of coding. All the documentation about the project can be found by following the hashtag #citizenscience.
The present task has to do with [Deciphering top quark production at CERN’s Large Hadron Collider](https://peakd.com/hive-196387/@lemouth/citizen-science-on-hive-deciphering-top-quark-production-at-cern-s-large-hadron-collider). This has to do with the *analysis of those ‘reconstructed-level events’* as spelled out by Lemouth. So let's get started.
### Task 1
The software is started using the following codes:
`cd madanalysis5`
`./bin/ma5`
And the simulated event is imported using:
`import ANALYSIS_0/Output/SAF/_defaultset/lheEvents0_0/myevents.lhe.gz as ttbar`
`set ttbar.xsection = 505.8` (I was able to access my own cross-section value, luckily)
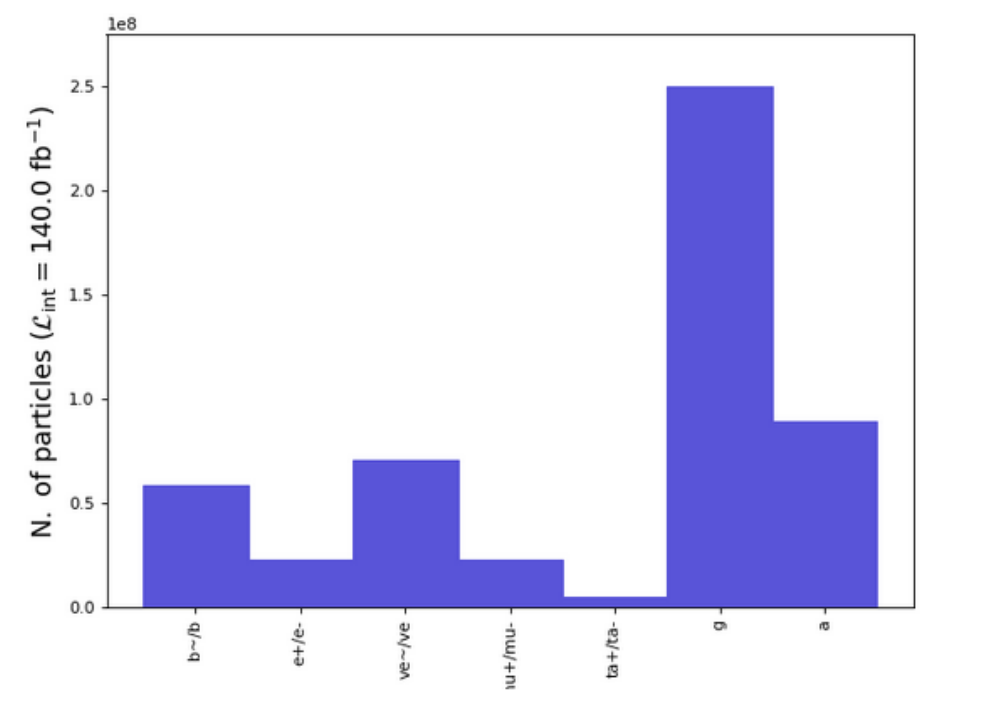
Next is the setting up of Ma5 to normalize the number of collisions recorded during the full run 2 of the LHC and then generating the histogram of the event:
`set main.lumi = 140`
`plot NAPID`
`submit`
`open`
The result:
### Task 2: Lepton and photon multiplicity
For lepton
`define l = l+ l-`
`plot N(l) 5 0 5`
`select (l) PT > 20`
`plot N(l) 5 0 5`
`plot NAPID`
`resubmit`
`open`
Result:
https://files.peakd.com/file/peakd-hive/gentleshaid/23zSNAEnpj2qwWDGfUZMrpQtczrJsLR79GSAUCaRSFFroZGc1wFvnVRLEM9R72EqP2BxG.png
https://files.peakd.com/file/peakd-hive/gentleshaid/23y9EkubAKXoia9A7W7cEC84YbUgMoeHrUmZswQ4juTnRvpNBVTa9kCvLV9Ntv7q1V9pK.png
For photon
`N(a) 5 0 5`
`select (a) PT > 20`
`plot N(a) 5 0 5`
`resubmit`
`open`
Result:
https://files.peakd.com/file/peakd-hive/gentleshaid/23yJbt2WMbJPhKd8CgSEpS9FNq6H9mRZfn45xtKeBP2nyLtrG9E9aqgWTW4NWWoBbkuzL.png
https://files.peakd.com/file/peakd-hive/gentleshaid/EopyhvdiqitvmXJXGANpD8xbz8C9yDmswiGPXYF5yZQioYKxTN9nocTQg4daa68MGtY.png
### Assignment 1: Jet multiplicity
`N(j) 5 0 5`
`select (j) PT > 25`
`plot N(j) 5 0 8`
`resubmit`
`open`
Result:
https://files.peakd.com/file/peakd-hive/gentleshaid/242sC1BuLNP3saMQDNUtZGy7zwkvztNjGgmSZ26E4JdNbQN28vENqCETjvycHUi3Ny5jK.png
https://files.peakd.com/file/peakd-hive/gentleshaid/2424GmxZxV9eVpZob8Yk3pEHYfRaEf24D9Nvadkh5k62KdF3v8V59PUrdQkAfQGtzfrDg.png
For b-jets:
`N(b) 5 0 5`
`select (b) PT > 25`
`plot N(b) 5 0 8`
`resubmit`
`open`
The result:
https://files.peakd.com/file/peakd-hive/gentleshaid/23wgmQyXHJjAAAVK62RLqXp7Kyi8A1qbURRmFZUAFbpbUgyZoi7QhHSMqTkw18L2oMbM6.png
https://files.peakd.com/file/peakd-hive/gentleshaid/23xAwGQoJ1WPfDfWnghh3SKz5a9jxLfwxGEYKP1BkizUxzanpYUEEhFdgk8GFxdwcksmz.png
## Why very little variation in the *before* and *after* cut figures? Perhaps it is because simulated collisions usually produce large amounts of b-jets - two b-jets actually? I hope my guess is correct :)
### Task 3: Selecting a subset of simulated collisions
Cut
`select N(l)==1`
Looking at the effects of the cut on lepton multiplicity
`define l = l+ l-`
`plot N(l) 5 0 5`
`select (l) PT > 20`
`plot N(l) 5 0 5`
`plot NAPID`
`resubmit`
`open`
The result:
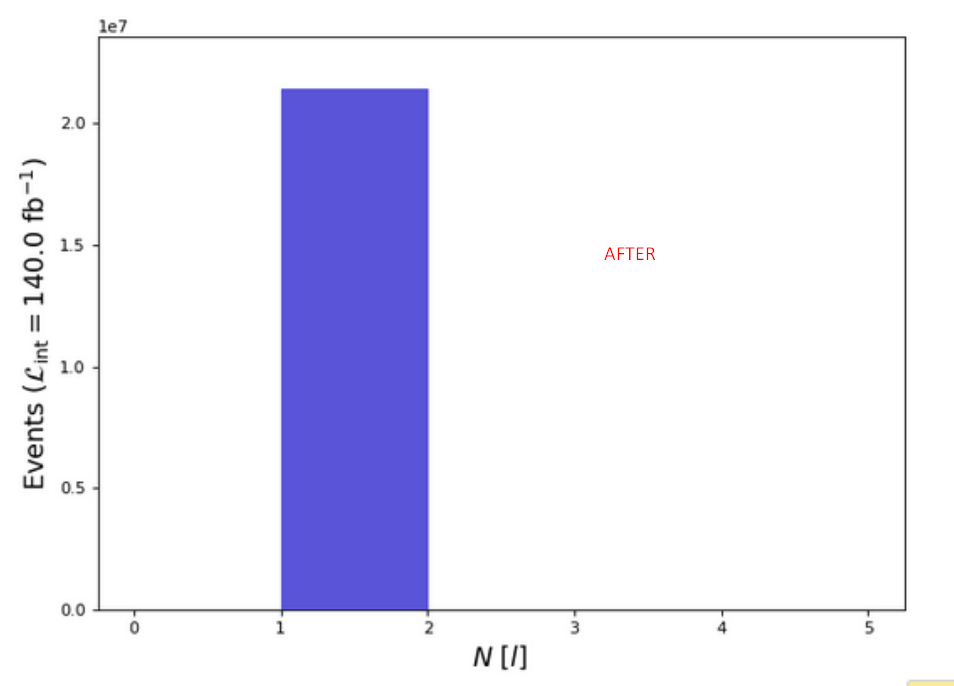
### What do I expect as a resulting histogram? Is the output in agreement with m expectation? I really have no idea of what to expect, in all sincerity :)
### Task 4: Lepton properties
`plot PT(l) 25 0 200 [logY]`
`plot ABSETA(l) 25 0 2.5 [logY]`
`resubmit`
`open`
The result:
https://files.peakd.com/file/peakd-hive/gentleshaid/244eRQdQjfCoersHyaxp7Cno4wvcZfYfnKY6LXu2YrfSyya9ZTHCghfv51TGDwtyu6Giy.png
https://files.peakd.com/file/peakd-hive/gentleshaid/244KZVrwfEu6F7UgVY2PV7B3pi39MqqX9H5gziyYSQ6TaJvTRV7zxojeWbVdVuPr4DGmX.png
There is a bit of variation in these results and those posted by @lemouth (especially in the screenshot on the left). I hope he can explain the reason.
Next is combining two jets:
`plot M(j[1] j[2]) 50 0 250 [logY]`
`resubmit`
`open`
The result:
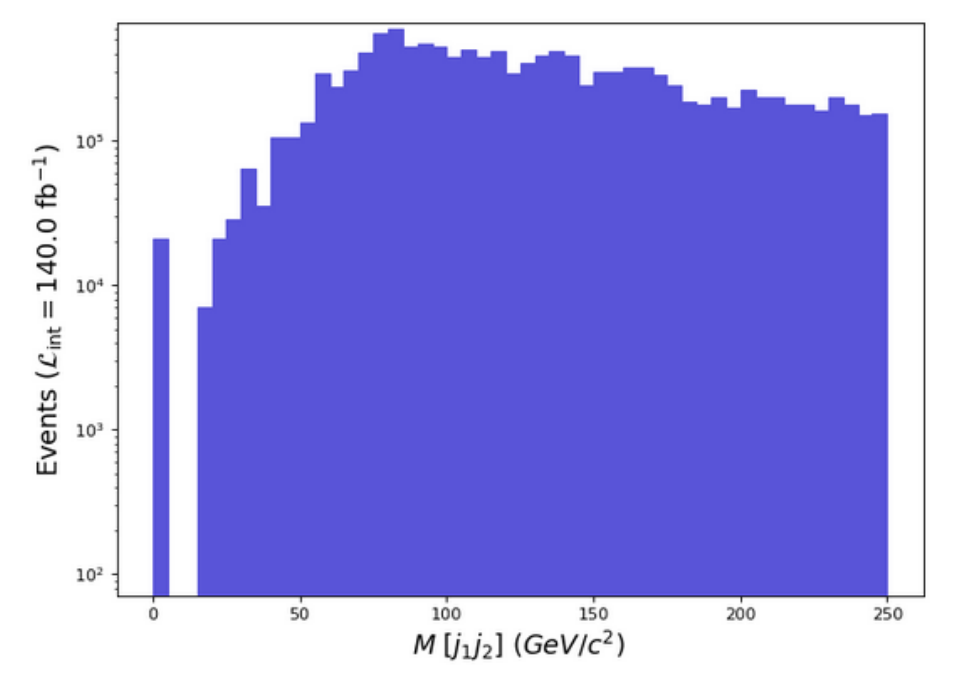
Again, there is a little variation from the result of Lemouth. I await an explanation.
I will leave the last assignment for the pros as I have got no idea how to go about it. I am just glad to follow the project and learn as much as I can while at it.
See you all when the next task drops.
Posted with STEMGeeks