In less than 24 hours, the LTC block reward will be halved from 12.5 LTC to 6.25 LTC. Traders and investors are eagerly watching the market to see if Litecoin (LTC) will experience a price increase (pump) after the 8.93% drop that occurred 24 hours ago.
For a more in-depth analysis of Litecoin, I'll be using the Market Cipher indicator. This tool includes four essential indicators – Market Cipher A for trend analysis, Market Cipher B for oscillation, Support & Resistance, and DBSI (Dual Band Strength Index). These indicators offer valuable insights to make informed decisions in my analysis.
Curious about Market Cipher indicators? Explore more at: https://marketciphertrading.com?ref=50160
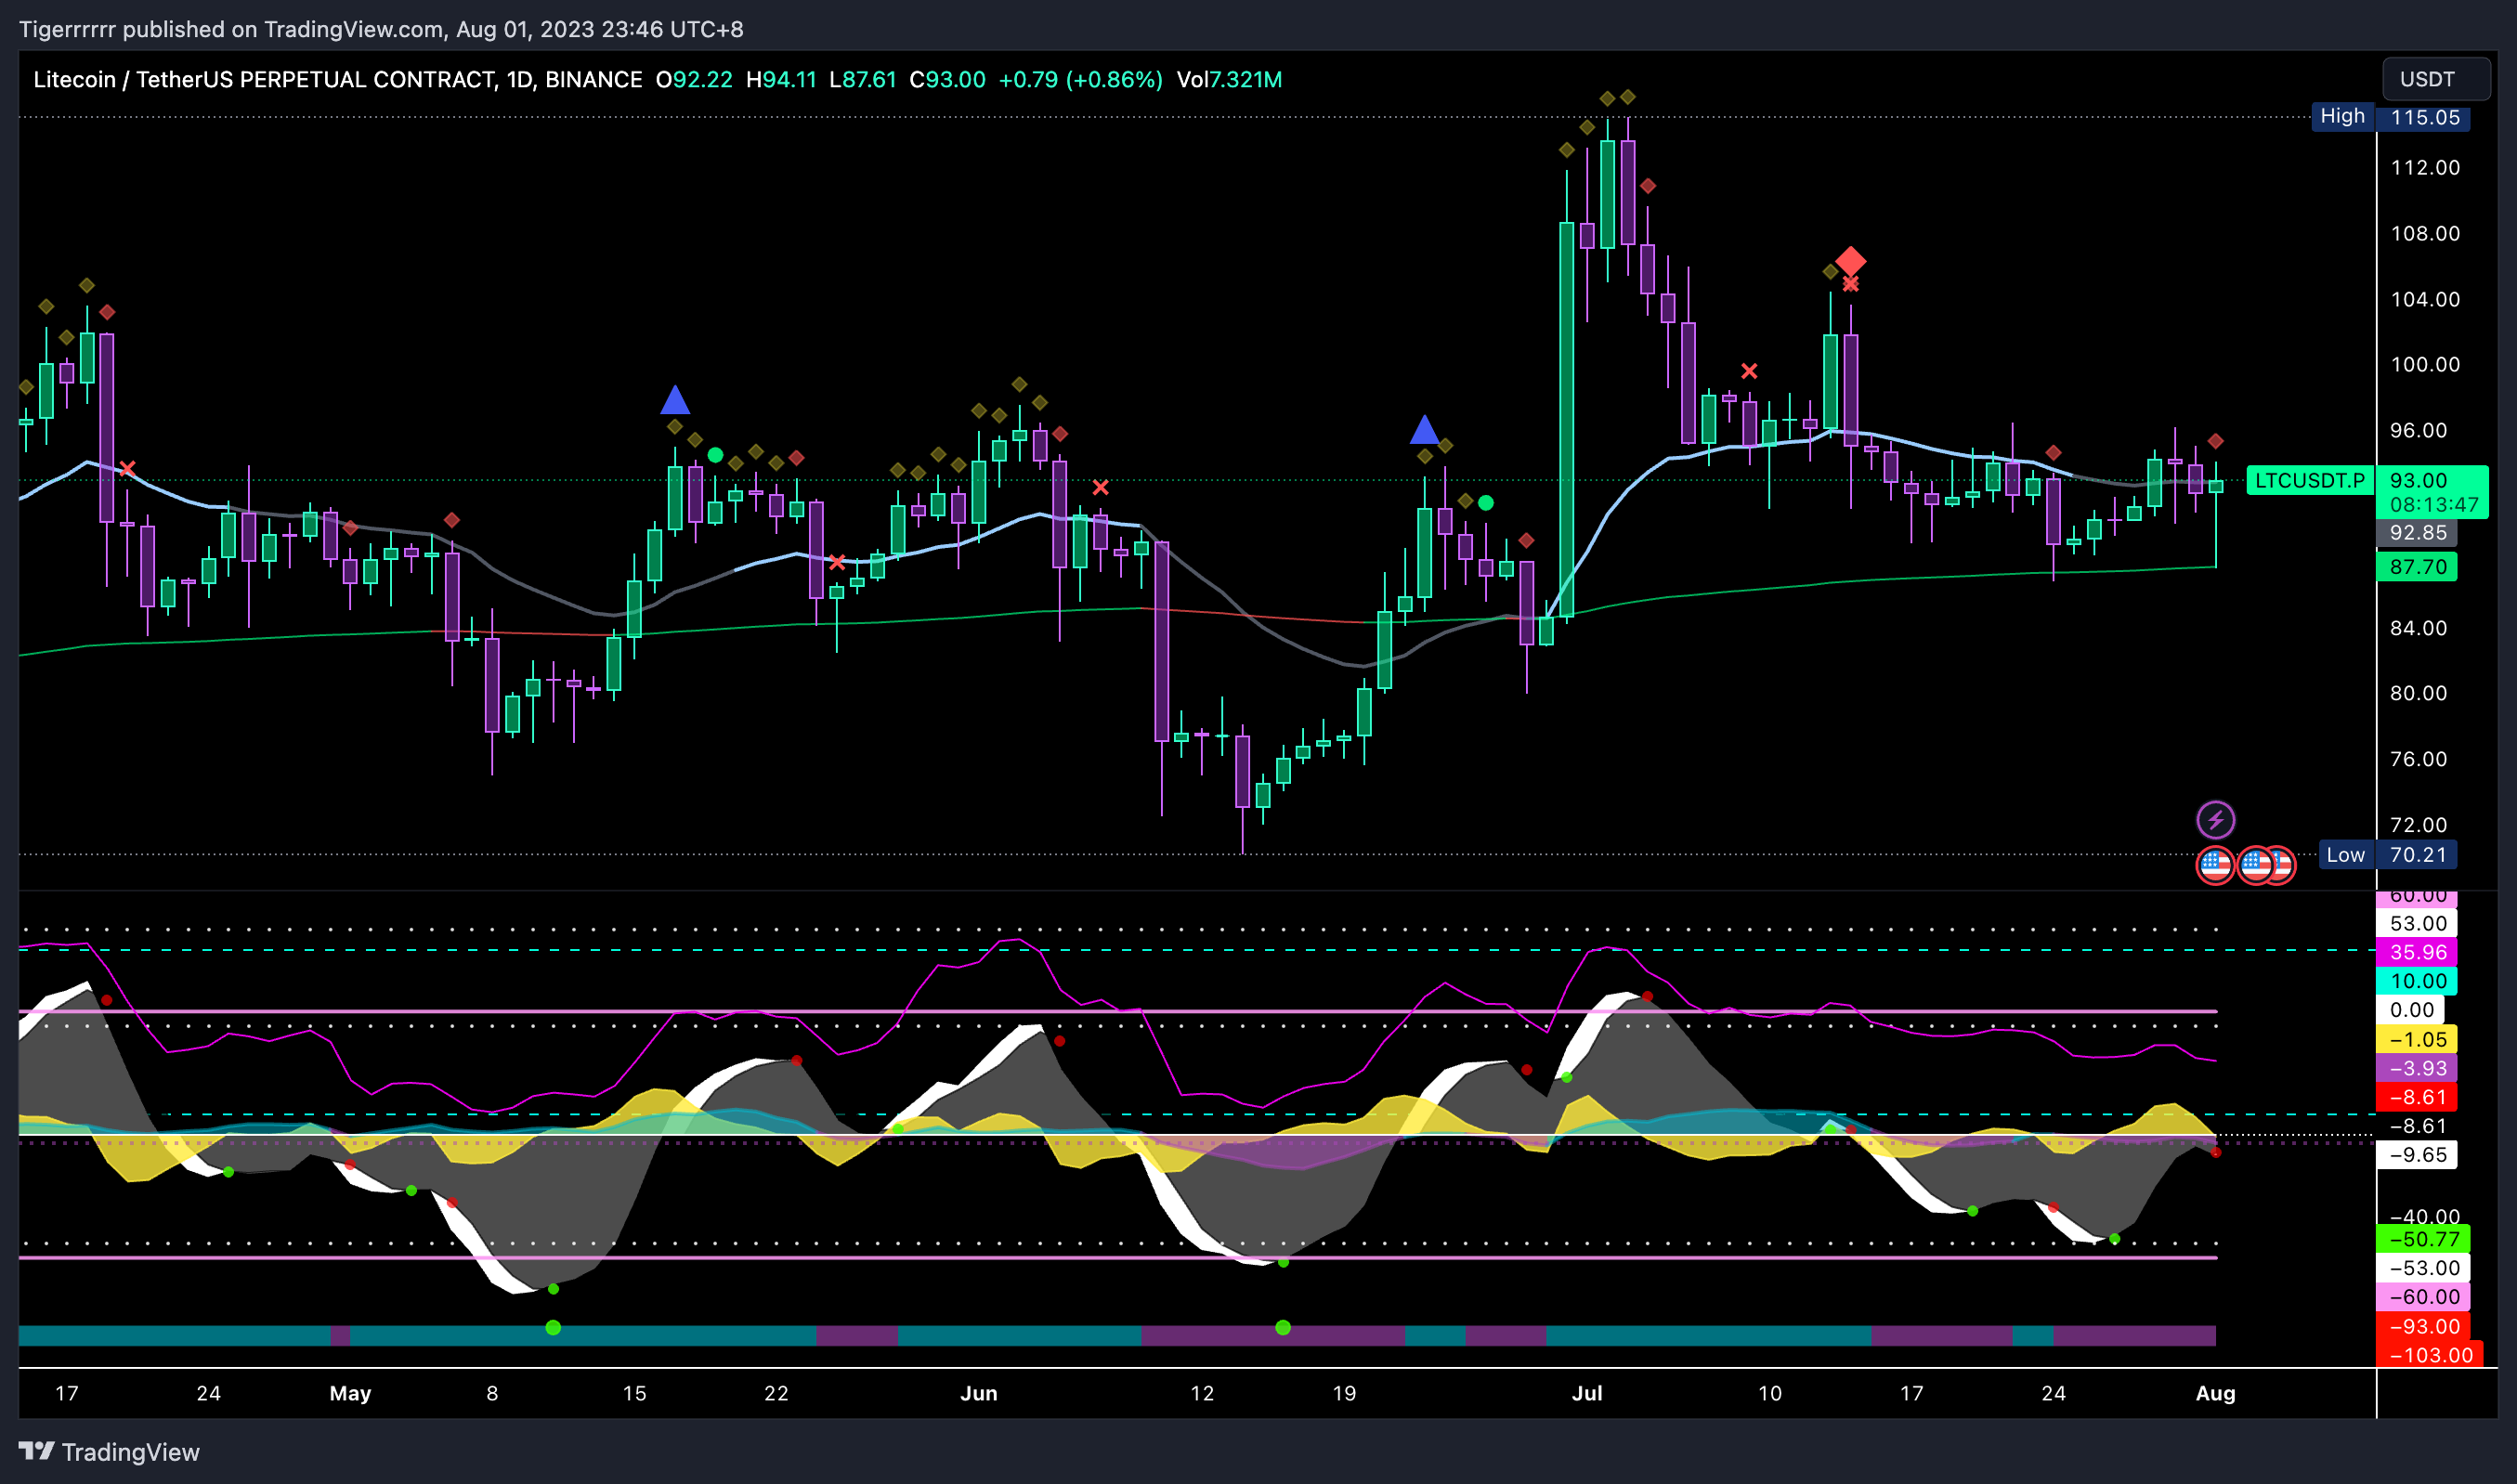 LTC Daily Chart
https://www.tradingview.com/x/Y9UzHXov/
LTC Daily Chart
https://www.tradingview.com/x/Y9UzHXov/
On July 14th, 2023, the "Blood Diamond" appeared, which resulted Litecoin's price to drop by 12% in a single day, wiping out the gains from the previous day. Since the confirmation of the Blood Diamond, the price of LTC has not really increased to reach $100.
Currently, there is a resistance level at $96, meaning that the price struggles to go above this point. On the other hand, the price has bounced back twice after reaching the support level at $87.70. This suggests that $87.70 is a strong support level for LTC.
Now, the big question is whether LTC will experience a pump due to the upcoming halving, which is less than 24 hours away.
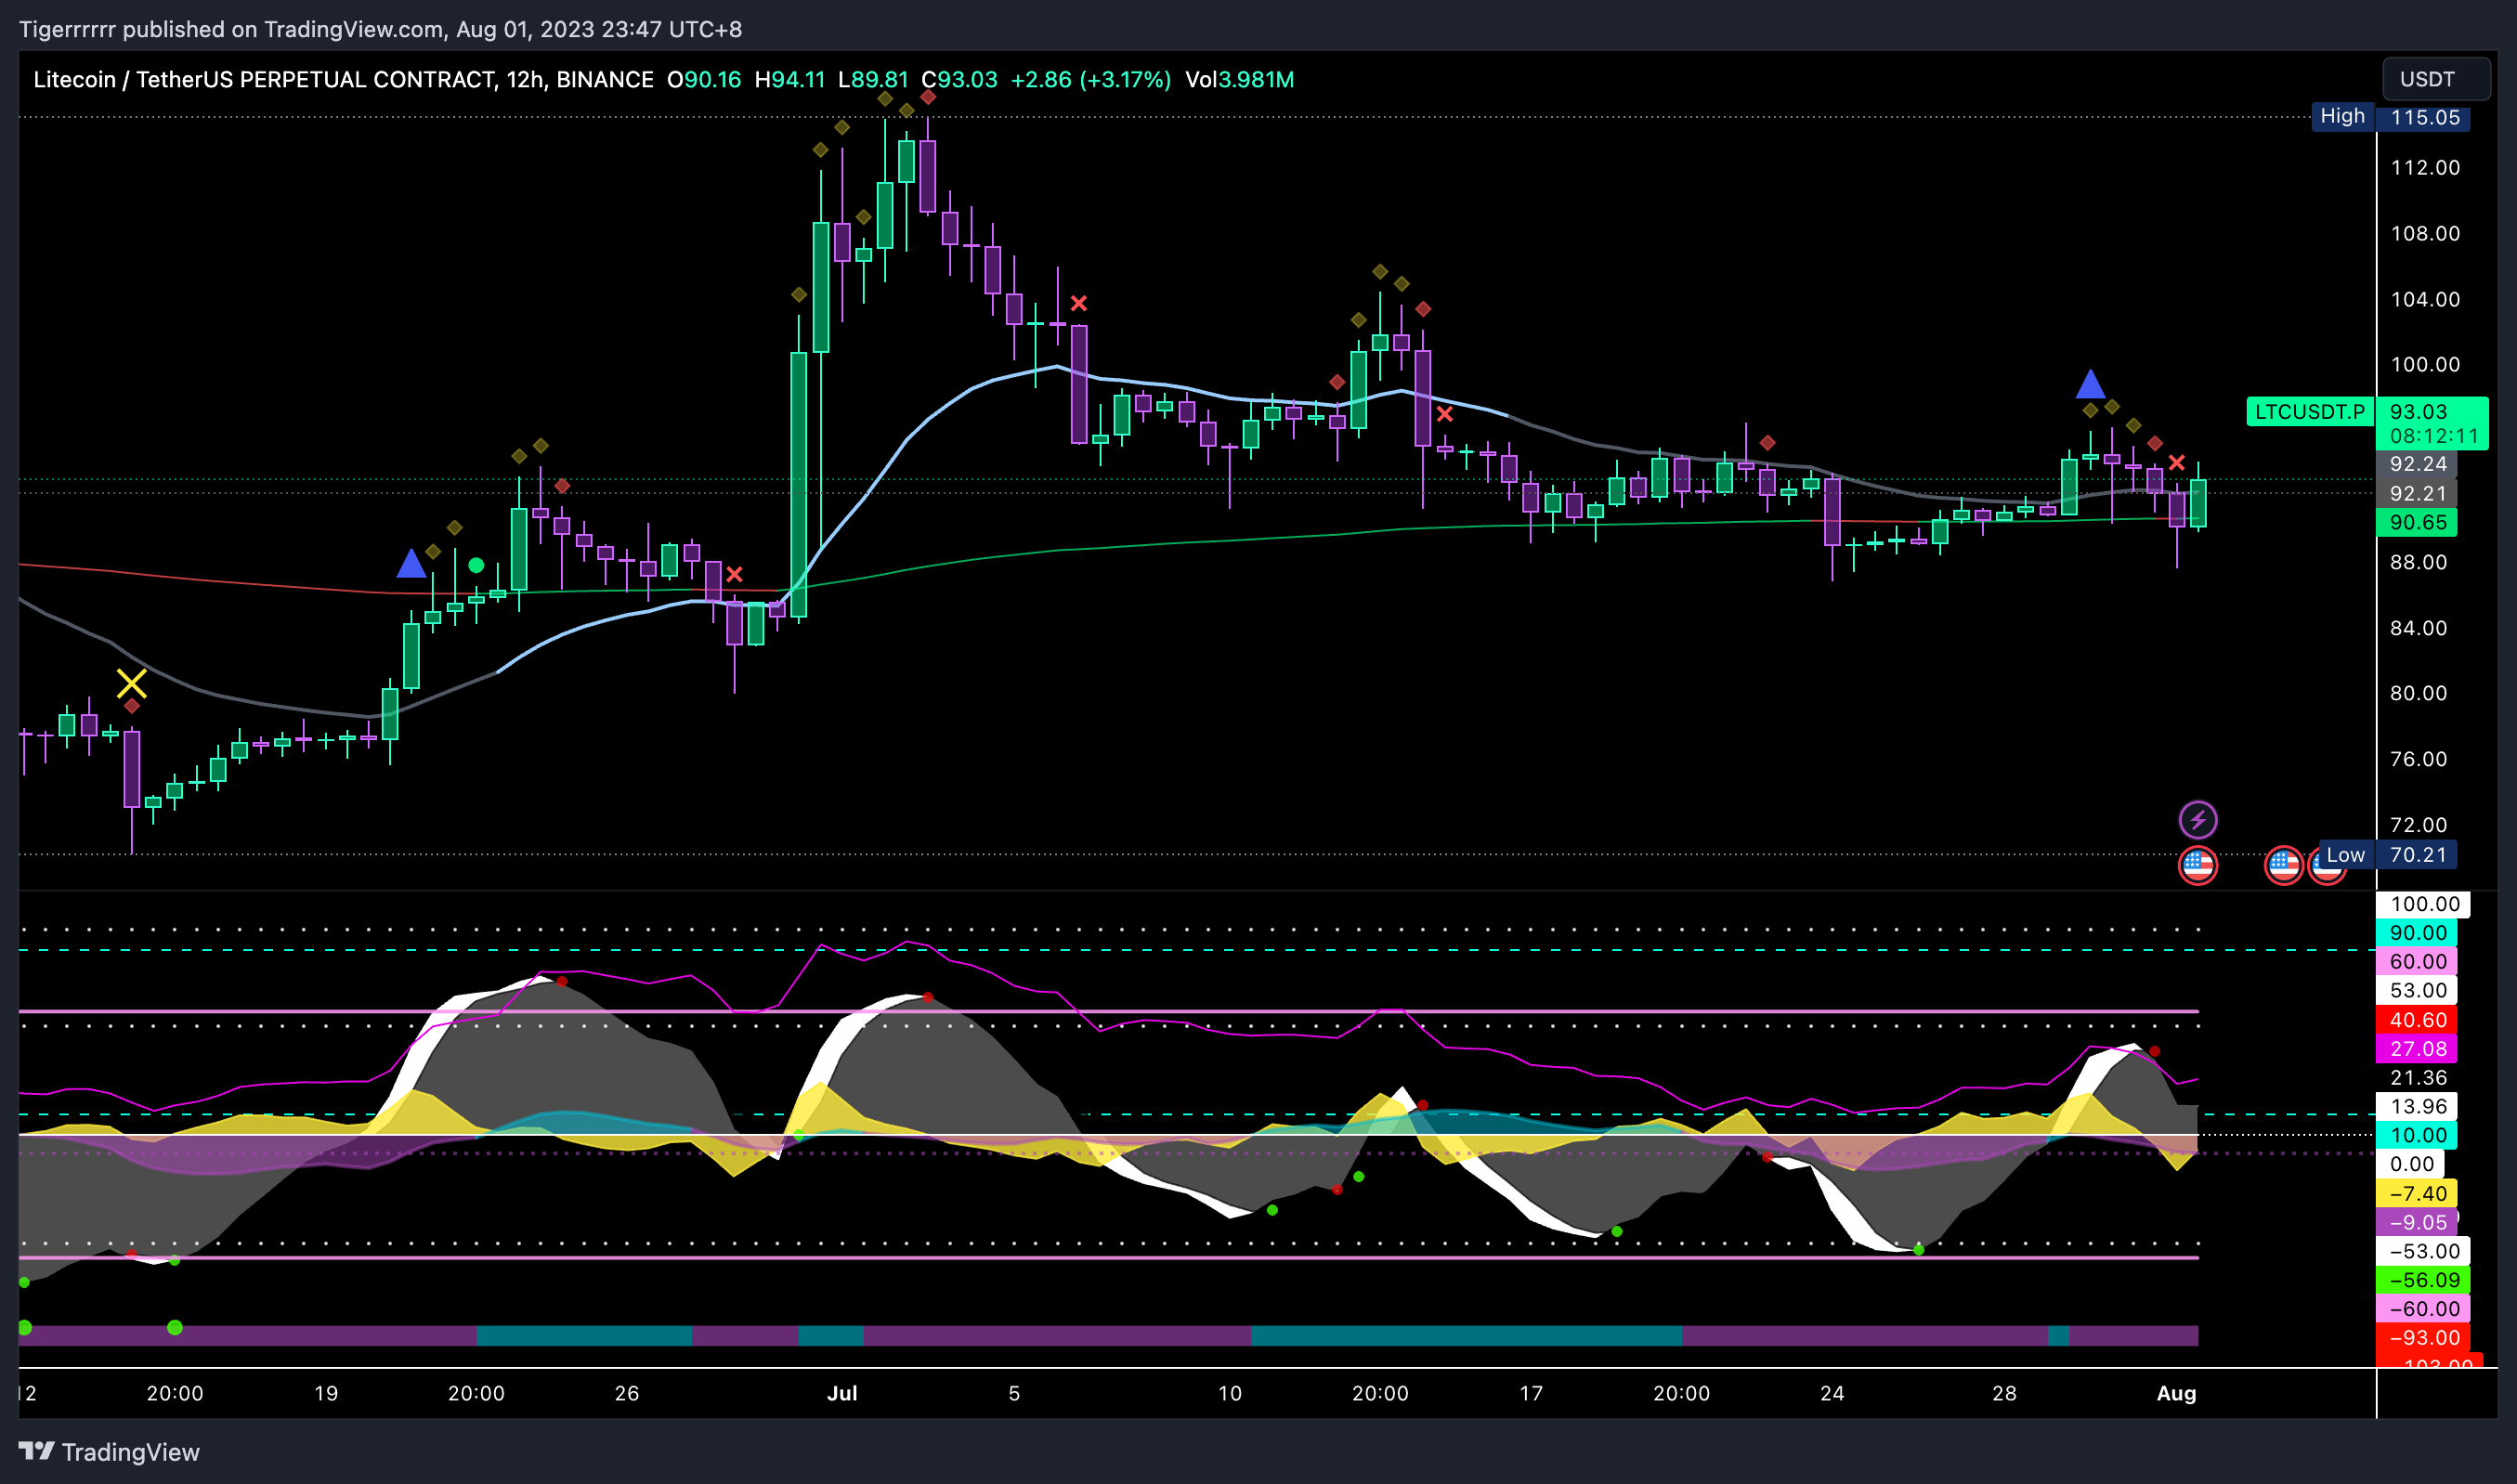 LTC 12H Chart
https://www.tradingview.com/x/za3cIOrk/
LTC 12H Chart
https://www.tradingview.com/x/za3cIOrk/
Let's switch to the 12-hour chart for a closer look. At the moment, the Relative Strength Index (RSI) is indicating that Litecoin is in the oversold level, which means the price may have dropped too much and a potential reversal could be on the way. Additionally, there's a possibility that the Volume Weighted Average Price (VWAP) is going to curve up, which could further support the idea of a potential price increase.
It's important to note that nothing is confirmed yet, and be cautious in making any assumptions. However, considering the higher time frames, chart seem to suggest that a pump might be incoming.
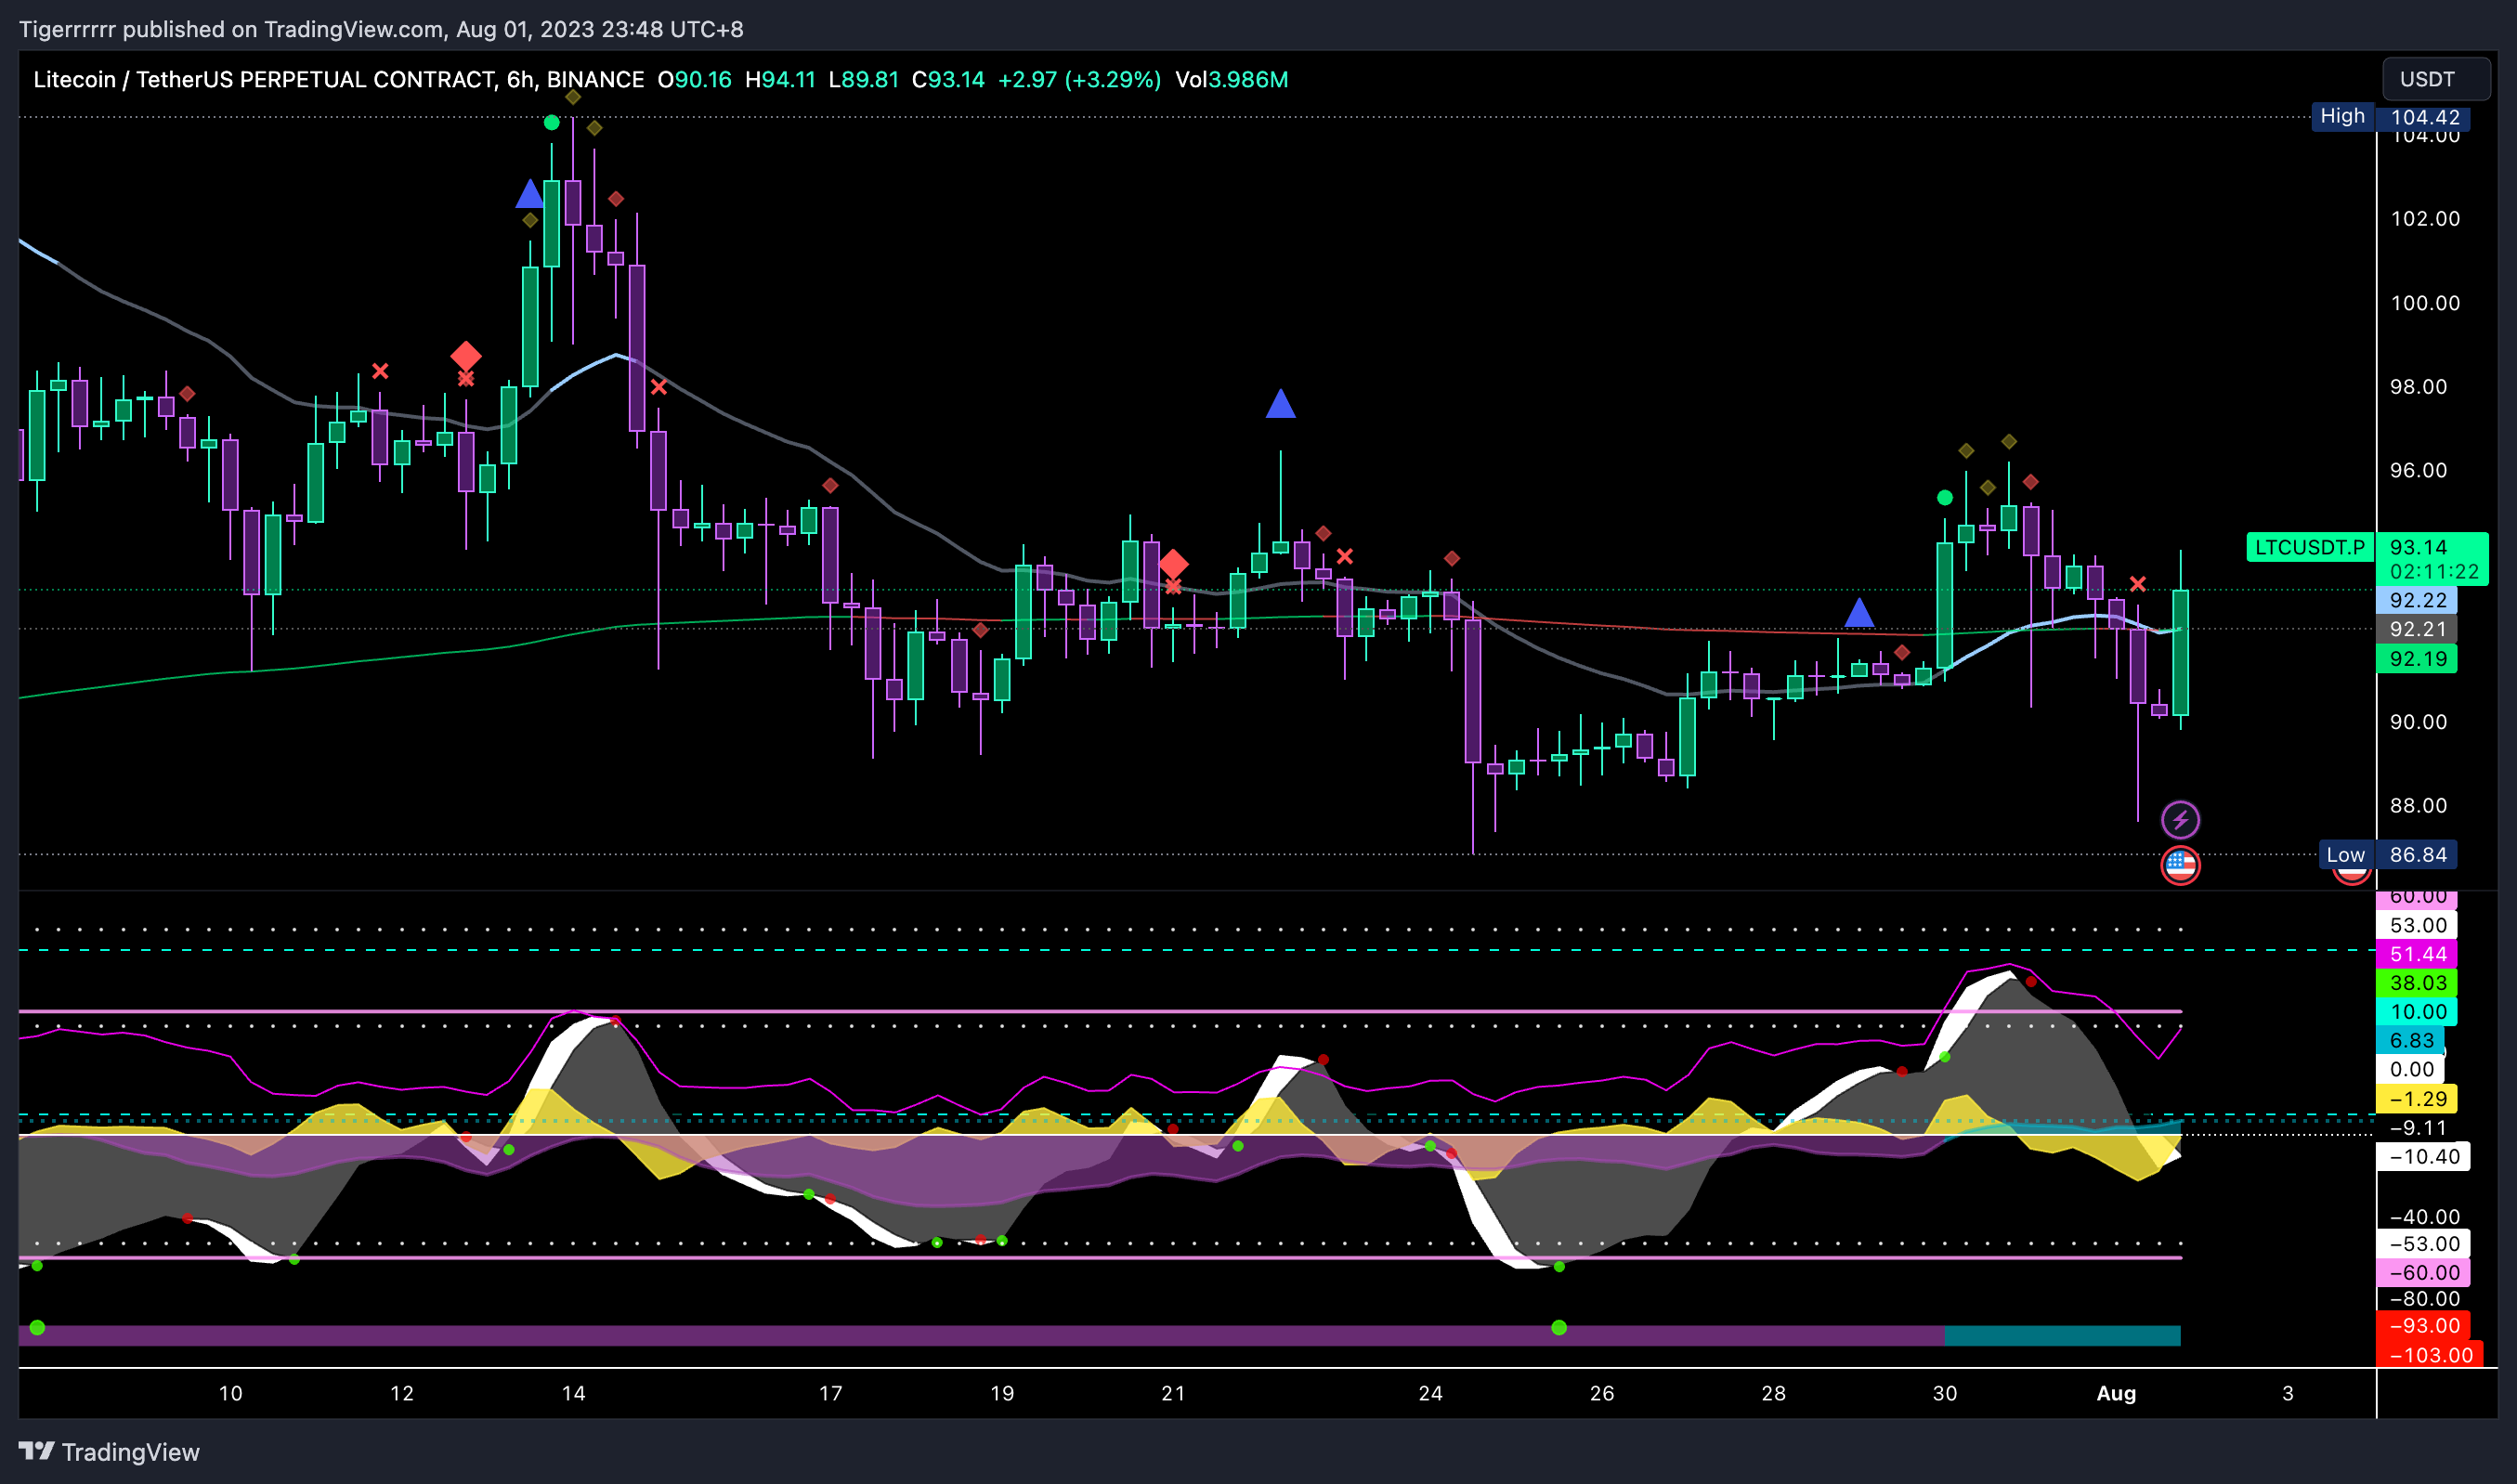 LTC 6H Chart
https://www.tradingview.com/x/8dIqfdgo/
LTC 6H Chart
https://www.tradingview.com/x/8dIqfdgo/
Let's take a look at the 6-hour chart to see if it aligns with the 12-hour analysis. On the 6-hour chart, it appears to be supporting the possibility of a pump too. There is a potential for a green dot to appear. A trigger wave is forming, indicating possible buying momentum building up.
The RSI on the 6-hour chart has already started to turn, and the green money flow suggests that buyers might be stepping in.
However, it's essential to remember that trading involves risks, and nothing is guaranteed in the market. Literally NOTHING...!
 LTC 4H Chart
https://www.tradingview.com/x/u8QmIcQU/
LTC 4H Chart
https://www.tradingview.com/x/u8QmIcQU/
The 4-hour candle has done an impressive job, nearly wiping out the previous dump completely. A beautiful trigger wave confirmed by a green dot, and the money flow has also turned green.
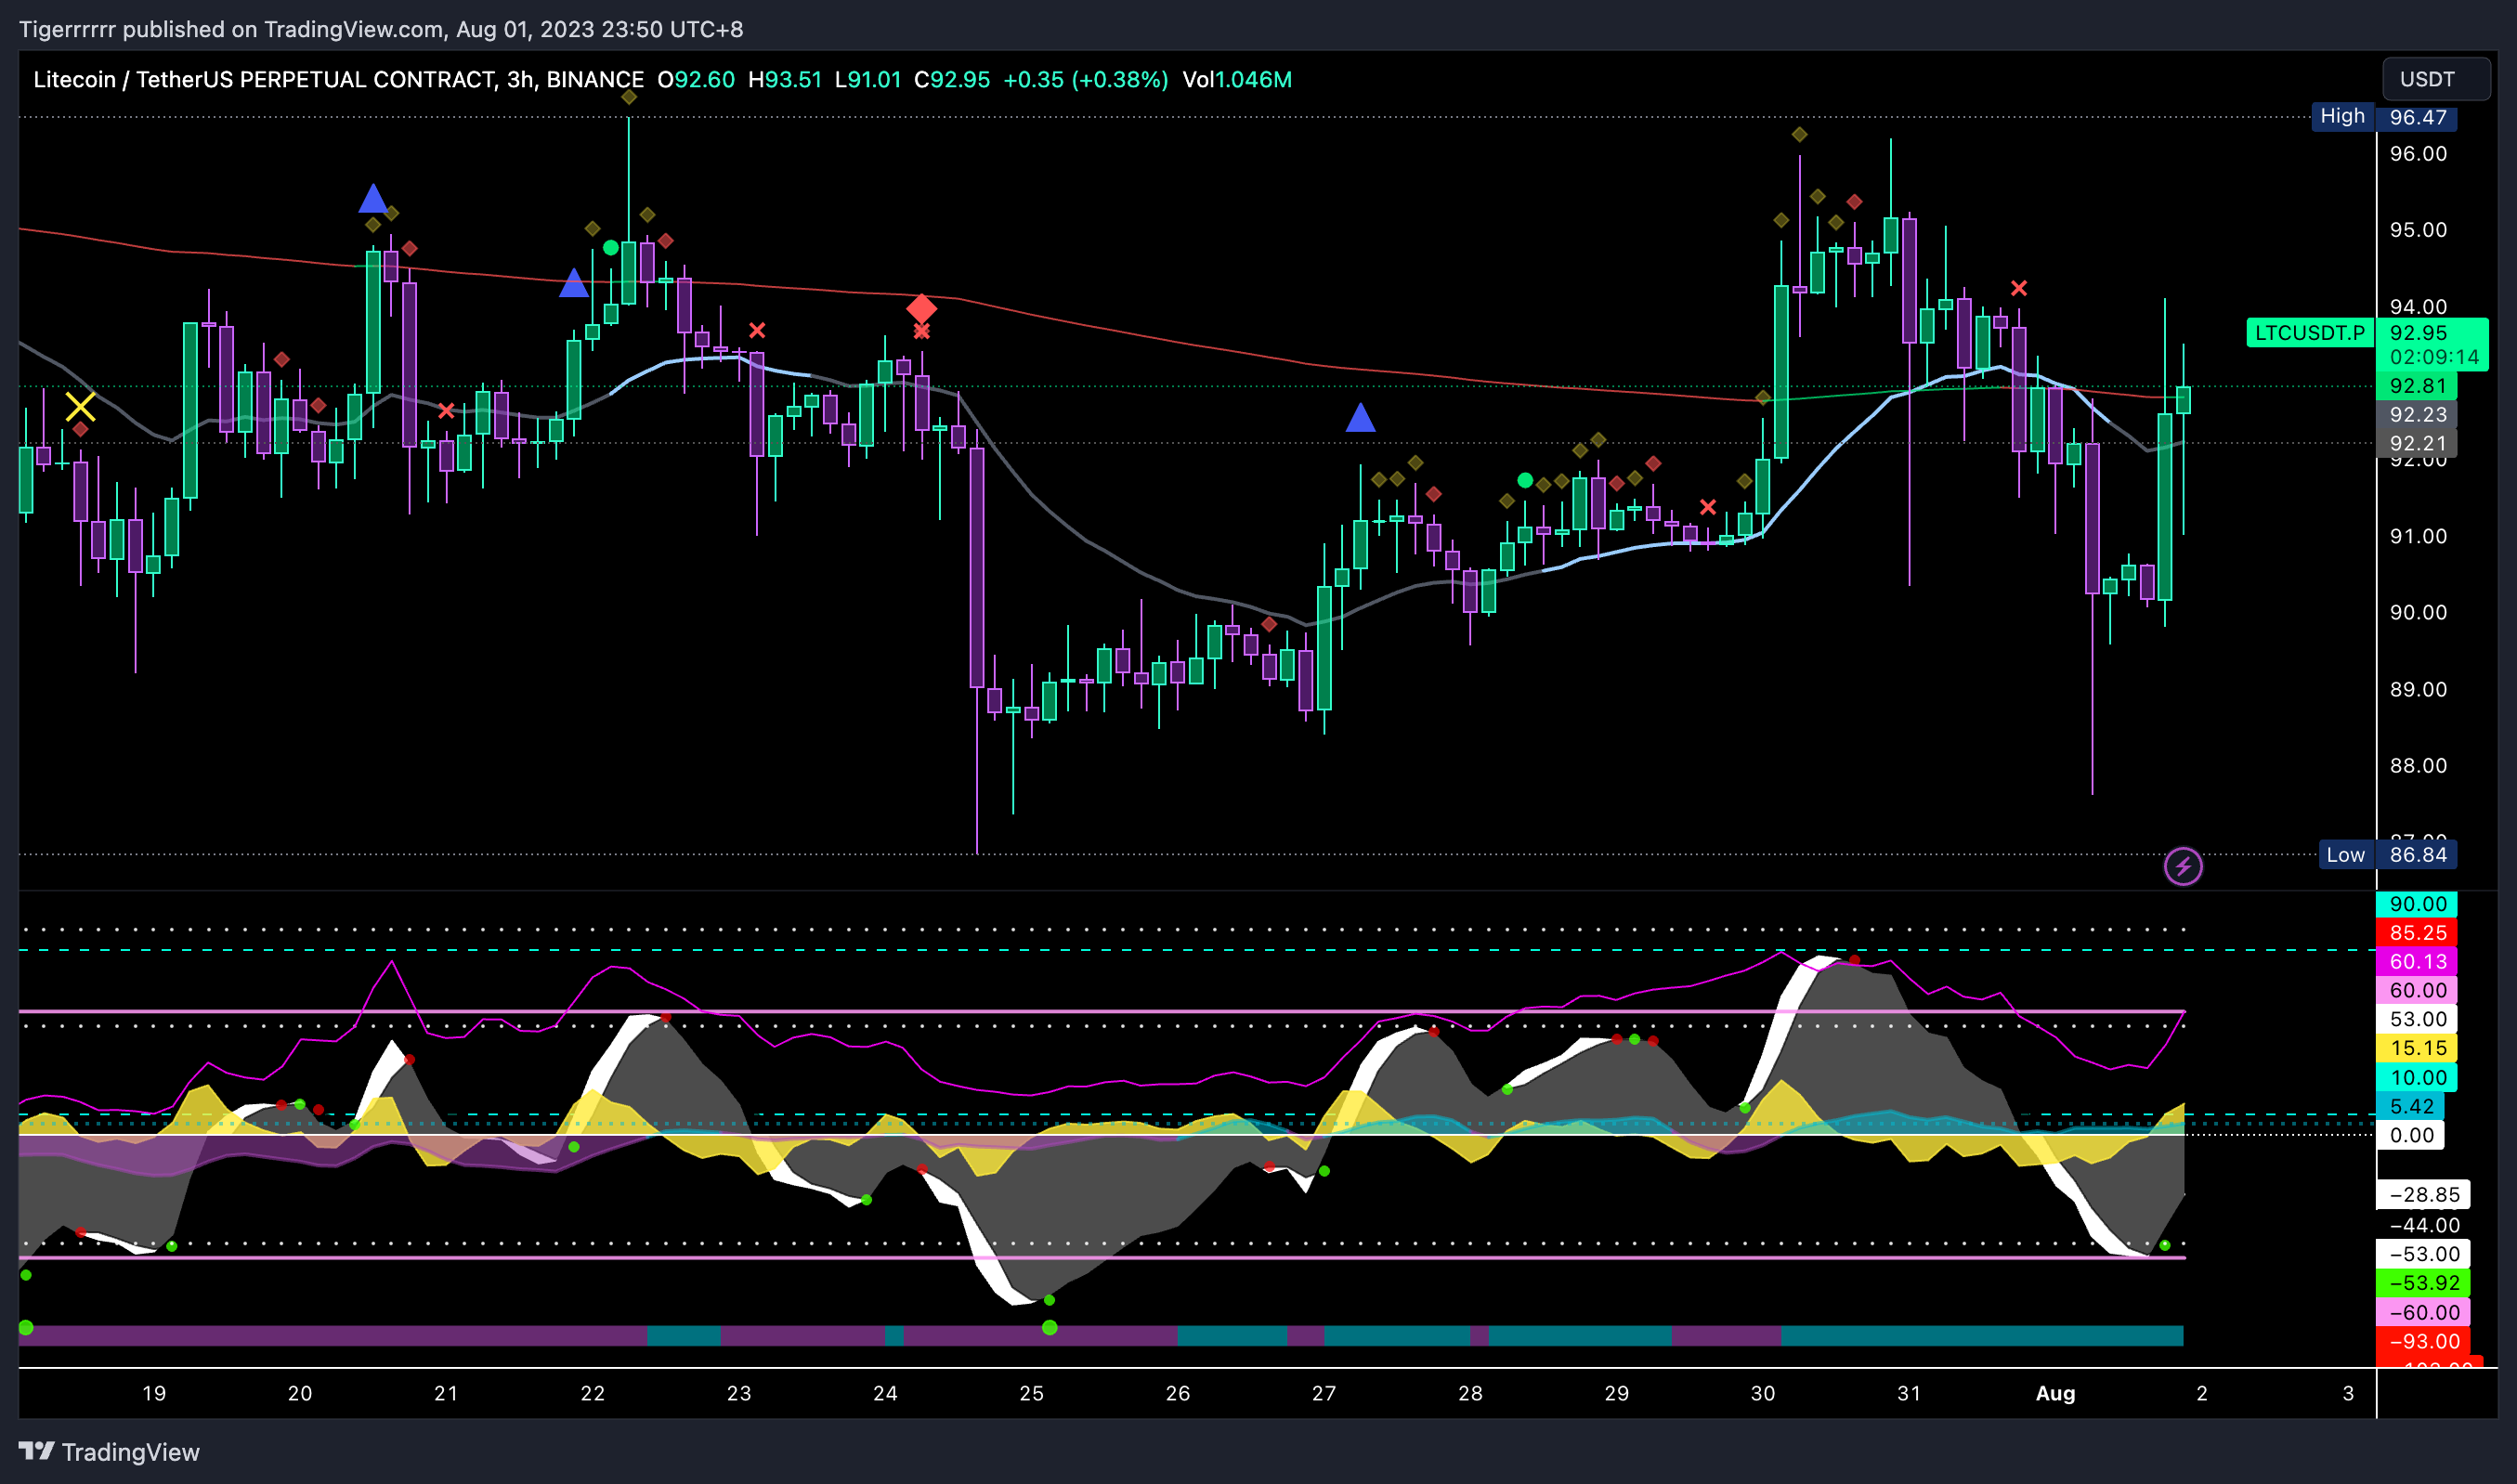 LTC 3H Chart
https://www.tradingview.com/x/cwnONjWa/
LTC 3H Chart
https://www.tradingview.com/x/cwnONjWa/
The 3-hour chart resembles the 4-hour chart. I got no comment.
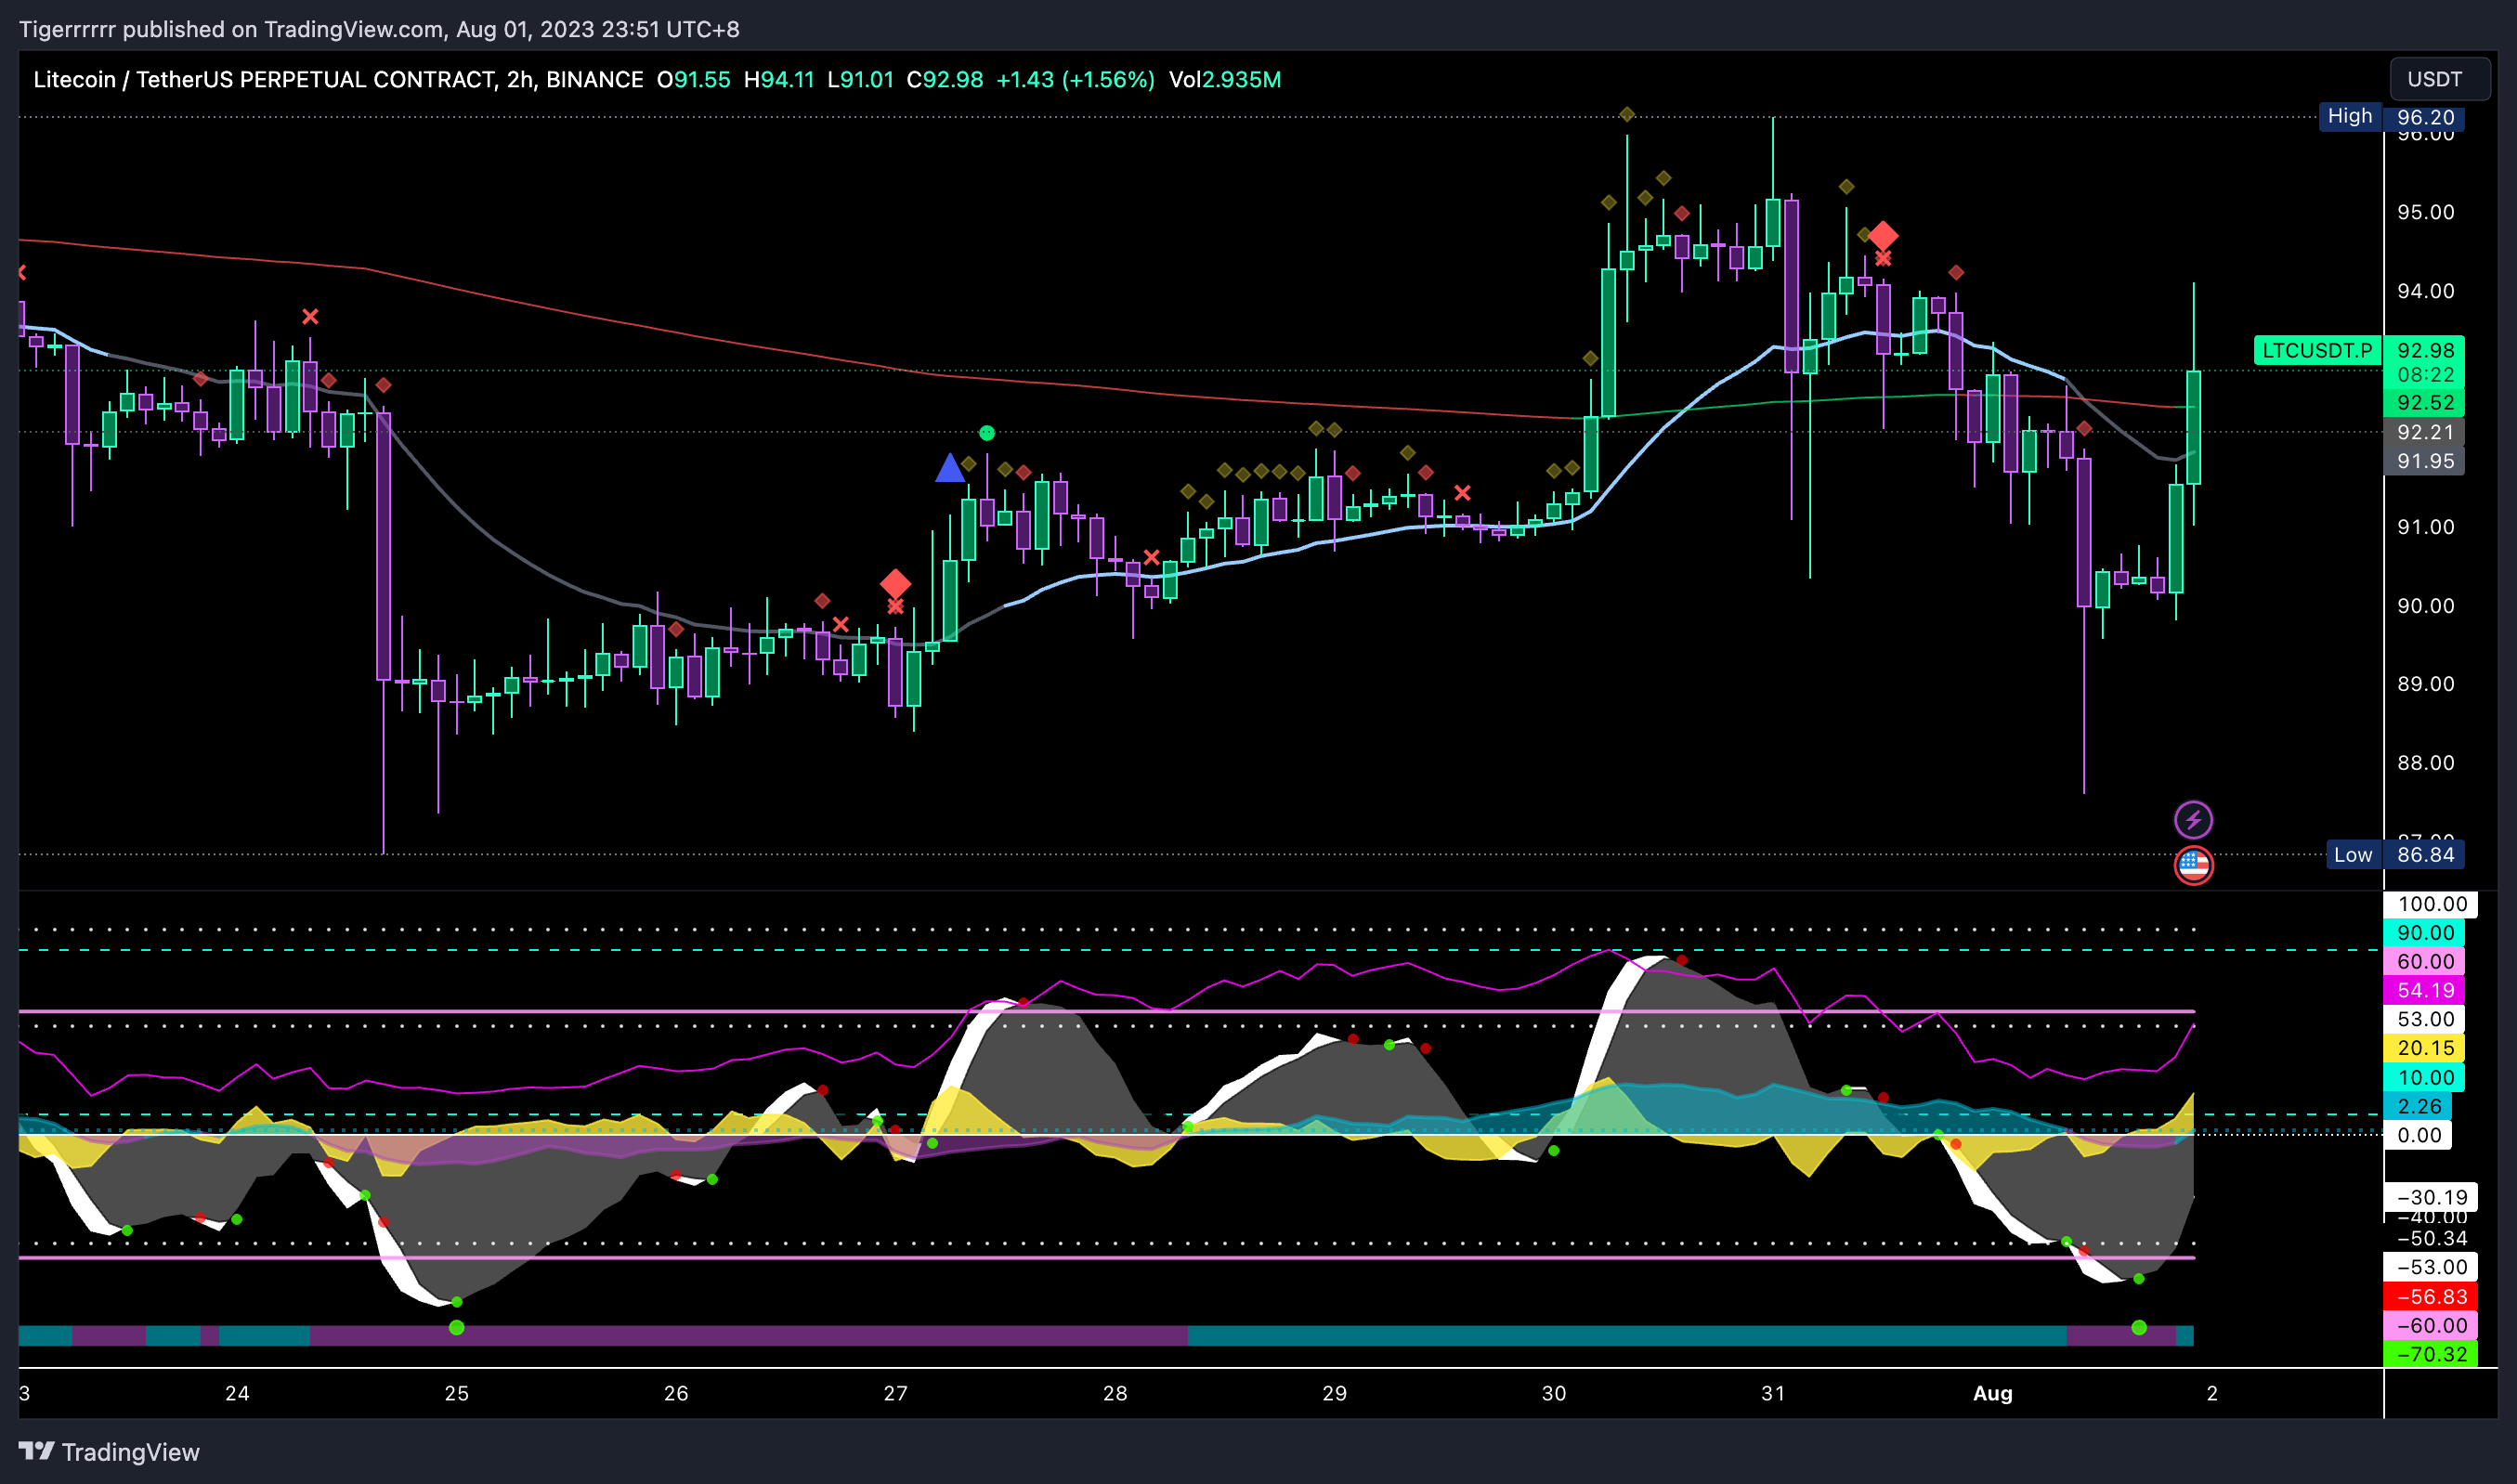 LTC 2H Chart
https://www.tradingview.com/x/oV8kup7R/
LTC 2H Chart
https://www.tradingview.com/x/oV8kup7R/
On the 2 hour chart, The trigger waves have been playing around in the oversold level, switching between red and green dots. This gives traders ample time to analyze the situation and make their moves. Not to mention, the RSI has been hanging out in the oversold area for 8 - 10 hours!
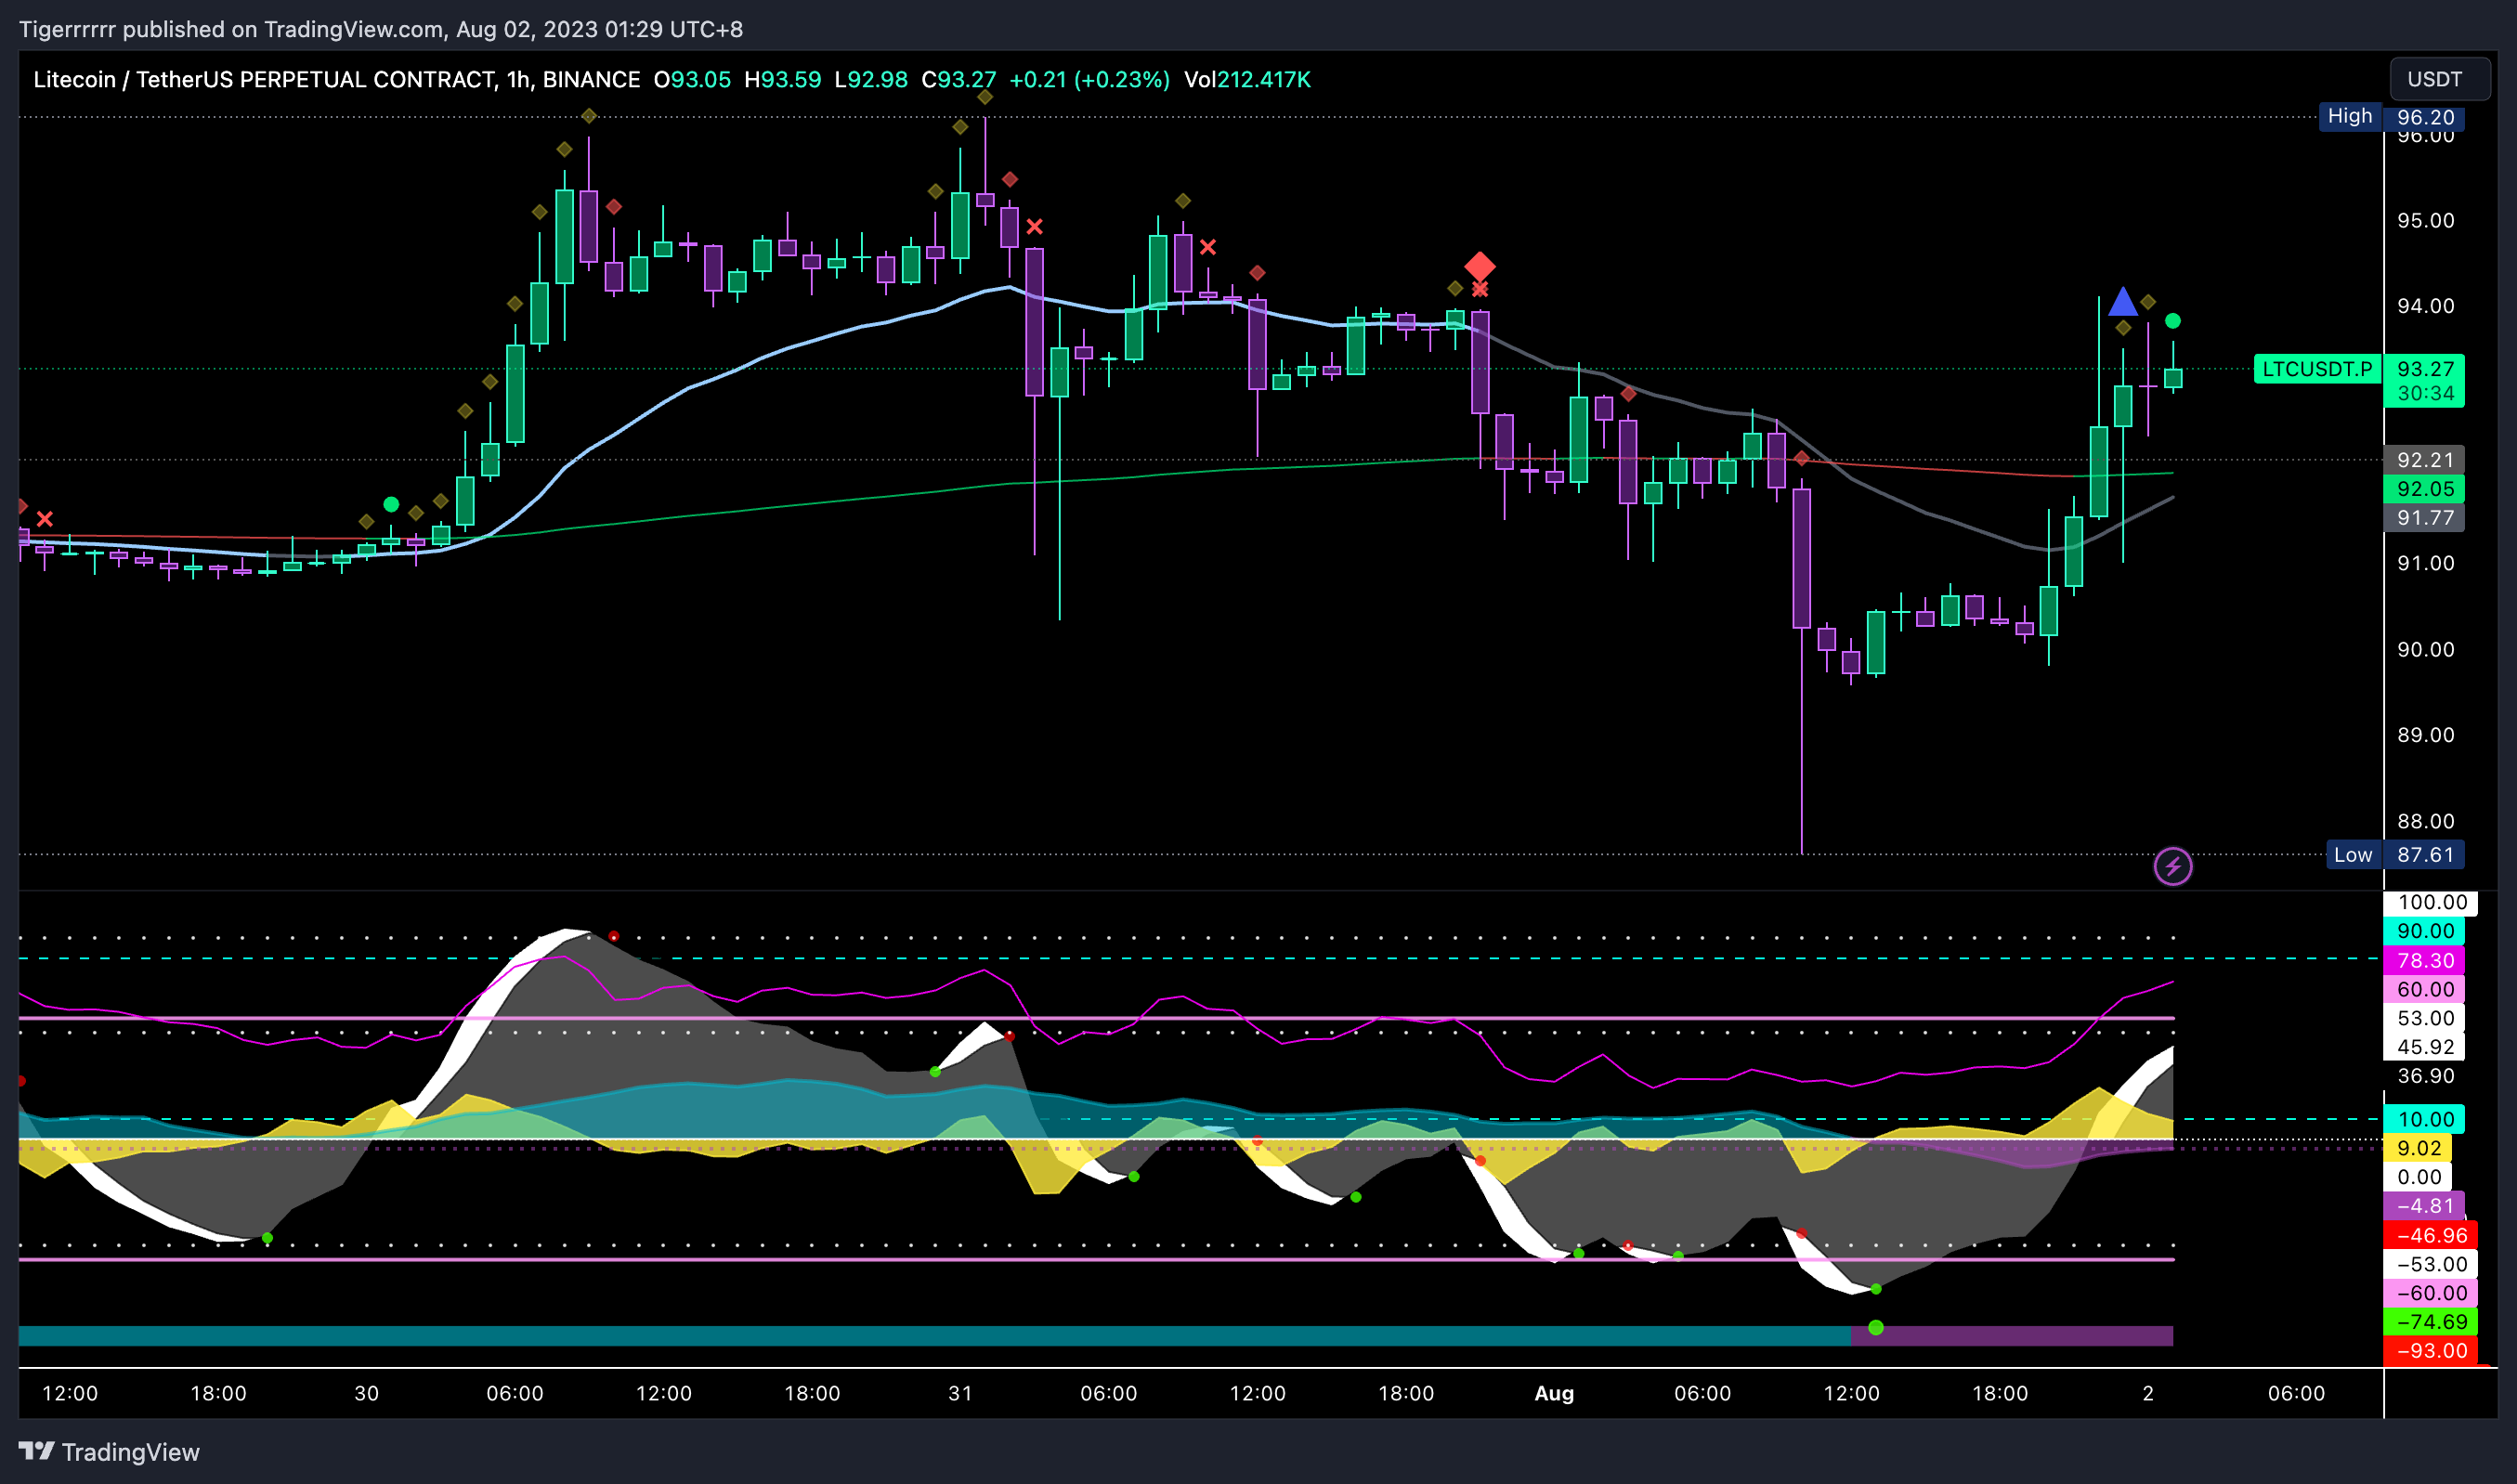 LTC 1H Chart
https://www.tradingview.com/x/7IFqGozm/
LTC 1H Chart
https://www.tradingview.com/x/7IFqGozm/
Now, let's dive into the 1-hour chart (it's also the last chart, thank you for reading until the end)! A green dot has been there for the past 12 hours, and the VWAP has crossed up to the 0 line. However, the money flow is still in the red, not green just yet. But hey, the analysis does hint at a potential recovery coming our way! Fingers crossed that LTC will pump, break the resistance and will arrive at $100.
As always, it's important to note that nothing in this analysis should be considered as financial advice. My goal is to share my insights and observations, but individual investment decisions should be made with caution and based on your own research and risk tolerance.
Posted Using LeoFinance Alpha
Posted Using LeoFinance Alpha