This article takes a look at some of the fundamental metrices of bitcoin in terms its actual and potential use cases. These metrices also drive user sentiment and ultimately its market price. (Pls read till the last metric which still indicates a lack of growth currently.)
Transaction Fees Low transaction fees was one of the early promises of bitcoins. The possibility of lower transaction costs was mentioned twice in the first paragraph of the Bitcoin whitepaper. Recently, transaction fees have become so high that it is no longer feasible to initiate transactions smaller than $20 in most cases. The chart below shows how the transaction fees has evolved over the past year.
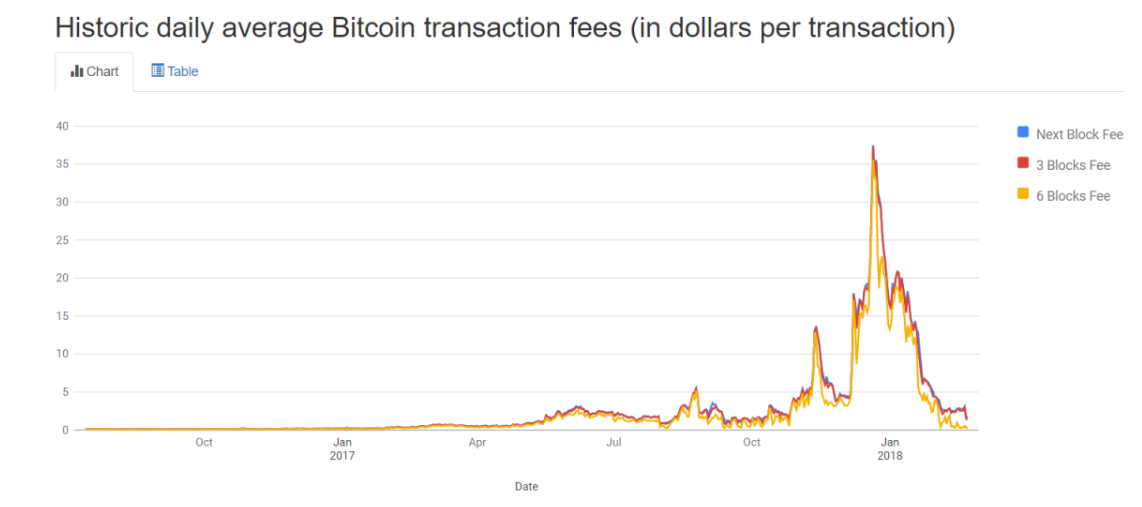
Source: bitcoinfees.info. The lines represent the fees for a next block (10 minutes), 3 block (30 minutes), or 6 blocks (60 minutes) wait.
At it’s peak on 12/20/2017, the fees were up to $37, much higher than fees of many fiat based systems. At the time, many merchants began announcing plans to discontinue accepting bitcoin payments. It was a matter of time before this fundamental metric showed up in the sentiment of users, and ultimately its value. Those high fees likely helped precipitate the current correction. The next block fee is now down to about $0.75. Fundamental Sign: Good.
Number of Unconfirmed Transactions and Median Confirmation Time
This is a measure of how long it takes for a transaction to get added to the blockchain, and can be accessed here. At its recent peak around January 2018, the number was around 400,000. This meant transactions were taken longer and longer, sometimes days to process, and users were having to pay more to get miners to include their transactions faster. The metric actually drives up the transaction cost when it goes up so is a more fundamental metric than the transaction fee metric. The number is currently down to about 3,000. This portends well for sentiment to slowly turn around as many users were becoming frustrated at this innovative new platform became more expensive than old methods of sending money and sometimes even slower. This metric was also indicators that would cause a correction even as the market price was doubling over the prior two months. The median confirmation time for transactions is shown below.
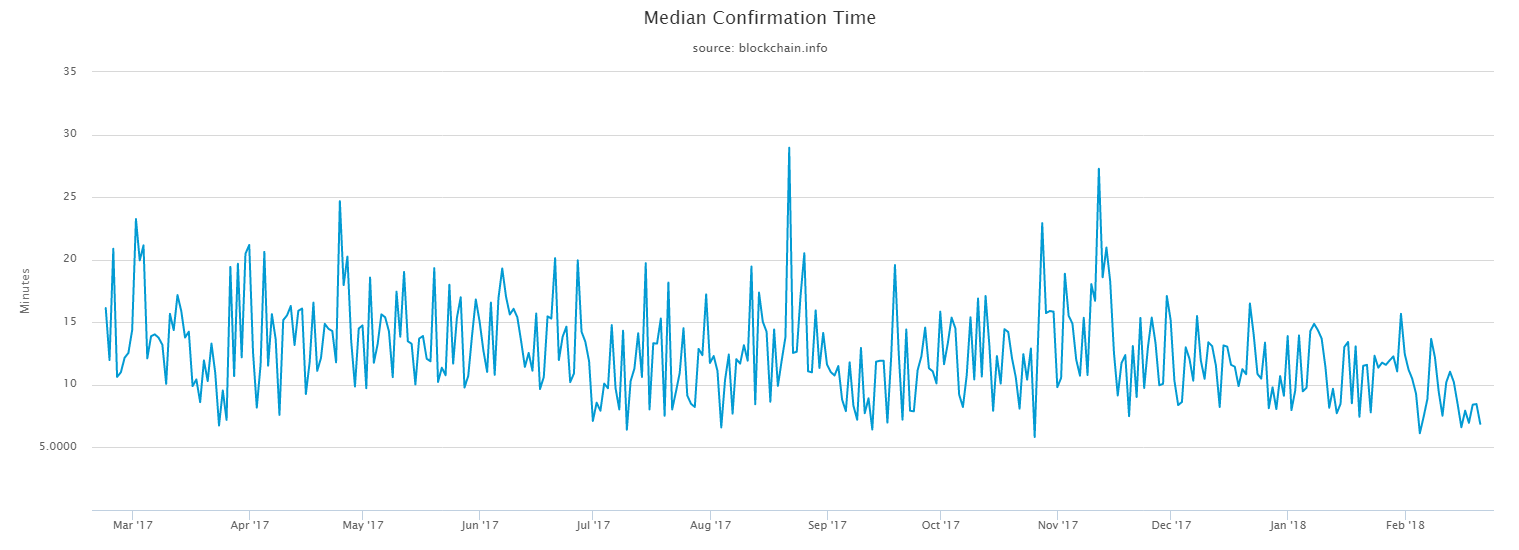
Source: bitcoin.info Fundamental Sign: Good.
Transactions Per Block
The normal 1 MB block bitcoin could usually contain about 2,000 transactions essentially putting bitcoin throughput rate at about 6 transactions per seconds. But that would be if the blocks are mined are packed, which should be the case when there is a backlog of unconfirmed transactions. Segwit was supposed to increase this to nearly double essentially scaling bitcoins. And the incentive to miners to pack the blocks with transactions is the fee. But we continue to see even smaller blocks. And even an empty block thrown in (here on 2/21/2018):
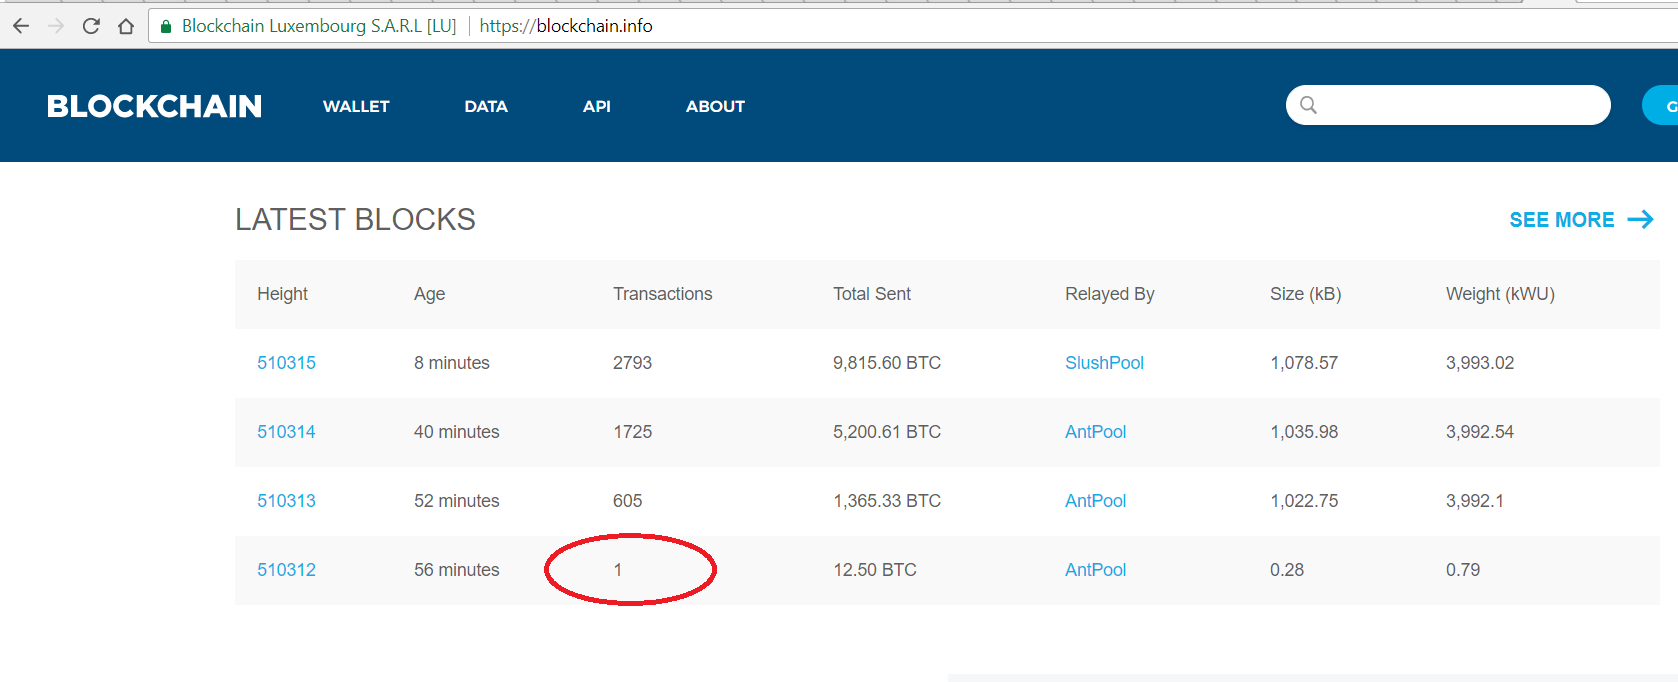
Source: Link to the actual block detail here on bitcoin.info
And here again on Feb 22 2018:
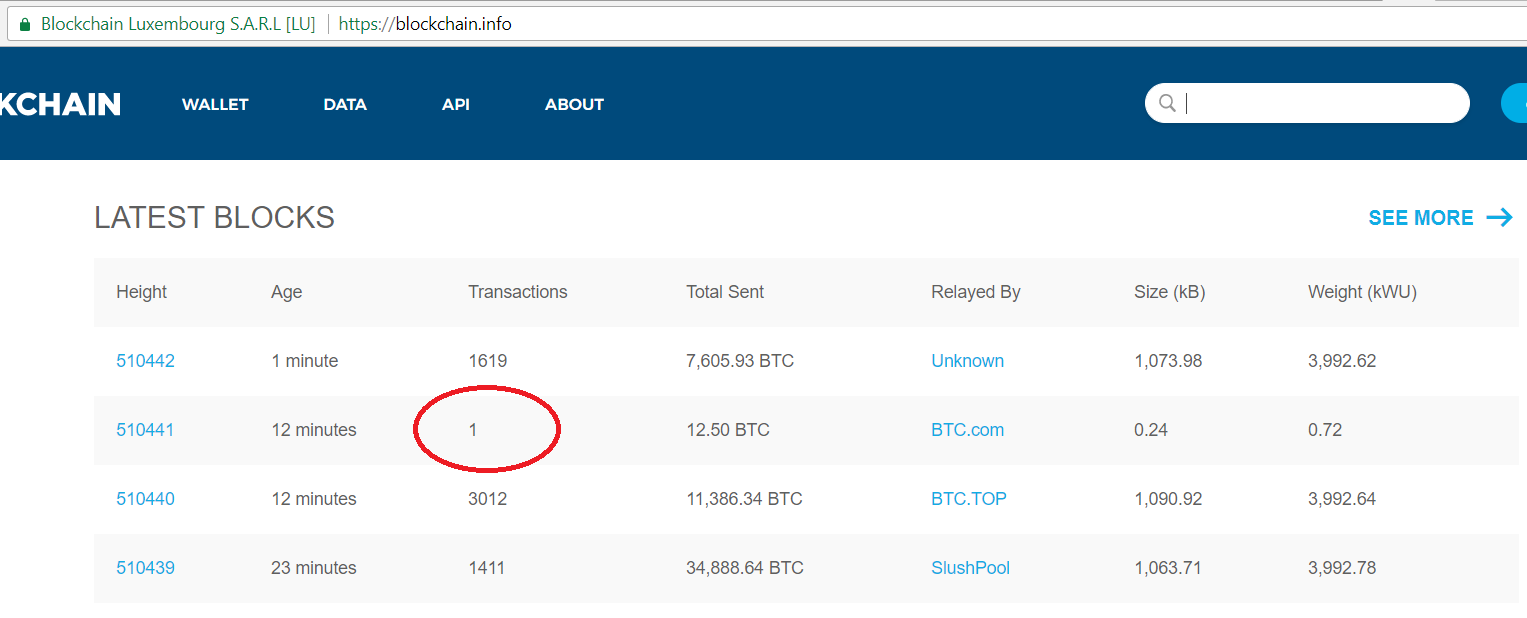
Source: Link to the actual block detail here on bitcoin.info
What you see above is basically a miner making $120,000 for processing absolutely zero transactions. Mining of blocks with fewer and fewer transactions may be a result of the dwindling adoption rate or miners simply cashing in when the algorithm allows (although why even attempt to compute the nonce for an empty block.) However, it does create a slightly more inflationary pressure on the asset when there is that kind of supply for pretty much no value created. (Let’s recall that the days Satoshi was mining empty blocks and accumulating bitcoins virtually free back in 2010 the price was also close to 0, so fewer transactions per minted bitcoins is will tend to be inflationary.)
Fundamental Sign: Number of Transactions per Block Still Low.
Daily Adoption Rate
The daily new unique addresses (DUA) on the blockchain points to the adoption rate of bitcoins more than any other published metric on the blockchain. (And the blockchain is a mathematical modeler’s dream because it provides more fundamental information on a real time basis than almost any other financial system hitherto available; most of which are quite opaque.)
The popular elasticity curve and equations used by economist to model demand and supply is developed for a system in equilibrium, and is not suited to rapidly growing systems that have not yet reached an equilibrium state, such as the bitcoin network. So other approaches were explored in the paper “Digital blockchain networks appear to be following Metcalfe’s Law”.
In a growing network with constant supply rate, the demand can be shown to be positively correlated to the rate at which new users are being added to the network. The faster new users are joining the network, the faster the value will slowly rise. And the more people join the network, the more they share and introduce the network to their social circles, which then leads to new adoption. And the more people join the network, the more other people they have to use and exchange the network’s resources with, making the network more useful and valuable. This is referred to as the network effect. It turns out in that paper that using approaches based on network effect theory on the daily unique addresses was found to model the price of bitcoins fairly well over the prior 8 years of data available at the time.
The DUA is shown below over the past 6 months. The rate is currently back to levels last seen in August 2017 when the price was around $3,500, and that metric continues to indicate there will be difficulty maintaining a recovery of bitcoin market value long term unless this metric begins to grow again. The Metcalfe model at such low DUA places the value closer to that value than where it has currently “recovered” back up to.
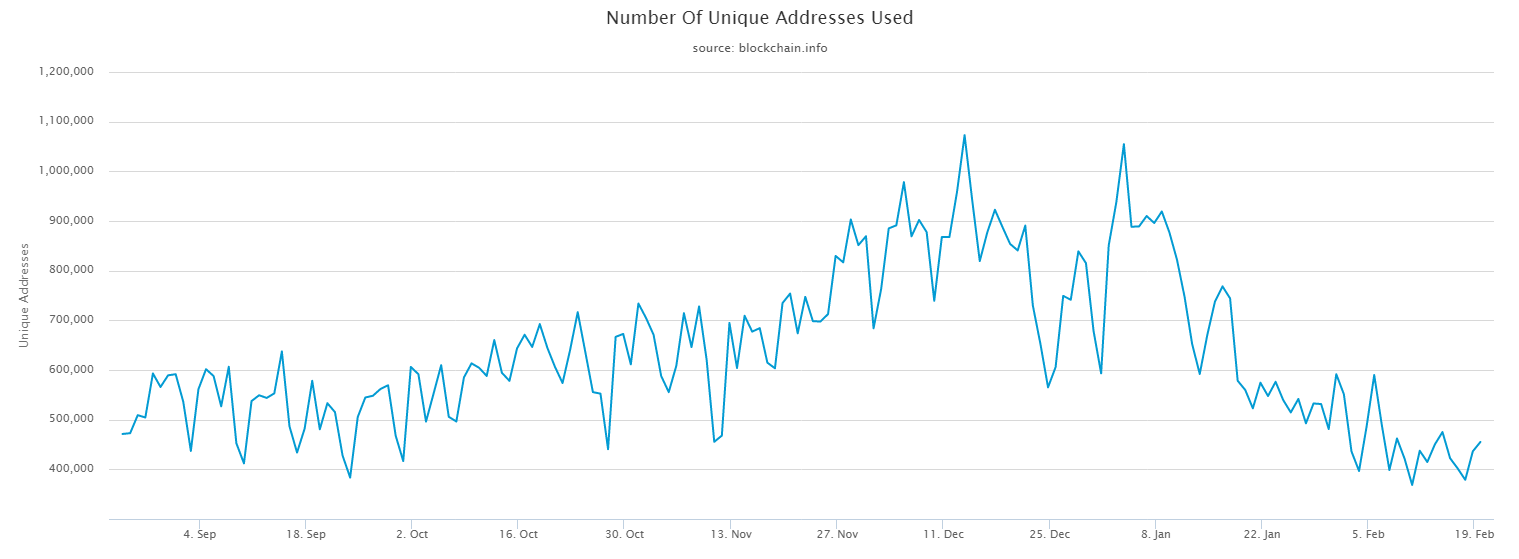
Source: bitcoin.info
Fundamental Sign: This metric has not yet recovered back to growth.
References: 1. Satoshi Nakamoto, 2009. Bitcoin: A Peer-to-Peer Electronic Cash System. https://bitcoin.org/bitcoin.pdf. 2. 2017. Digital blockchain networks appear to be following Metcalfe’s Law. https://www.sciencedirect.com/science/article/pii/S1567422317300480.
Legal Disclaimer: I am not a financial adviser and this is not financial advice. The information provided in this post and any other posts that I make and any accompanying material is for informational and educational purposes only.
It should not be considered financial or investment advice at all. You should consult with a financial or investment professional to determine what may be best for your individual needs.
This is only opinion. It is not advice nor recommendation to either buy or sell anything! It's only meant for use as informative, educational, or entertainment purposes.