
Cover created in Canva

Cambiando un poco los aires de mis publicaciones, ha llegado el momento de observar algunas métricas generales con respecto a “Splinterlands”, refiriéndome a su economía, enfocándome en $SPS principalmente, también en la cantidad de transacciones que se realizan, numero de batallas, las cuantas activas, nuevos jugadores, la capitalización de mercado de las cartas, entre otros detalles, ademas tomando en cuenta una temporalidad de 6 meses que es el tiempo al que tengo acceso a través de la plataforma de [Peakmonsters]( https://peakmonsters.com/dashboard) y su “Dashboard”.
Por supuesto, este no será un análisis en el que los resultados deben tomarse como definitivos, creo que la información mas precisa esta en las API de Splinterlands, sin embargo, no soy desarrollador ni tengo acceso a ellas, aunque podría ayudarme de otras maneras, prefiero hacerlo con herramientas que ya muestran estos datos, ademas, si las muestran y siguen allí, quiere decir que es verídico, por lo que, vamos con ellos, tampoco esperen un post muy largo, tratare de ser lo mas breve posible, ya que la intención es observar de manera rápida como van todas las métricas.
**Este post lo dividiré en 2 partes, porque no quiero hacerlo muy largo, en esta primera parte veremos las transacciones, batallas, cuentas y nuevos jugadores, mientras que en la 2da parte veremos la “Capitalización de mercado” de las cartas y como ha sido el desenvolvimiento de $SPS”.**

# Transacciones y batallas en los últimos 6 meses

Ok, vamos a comenzar con las métricas mas normales, en la próxima sección y al final de esta publicación, veremos que tal se va desempeñando el $SPS con respecto a su precio, que tanto ha cambiado desde el ultimo análisis que realice, así que, sin mas dilaciones, vamos con esto. Aunque antes de comenzar, estas serán mis opiniones con respecto a las métricas que mostrare, pueden estar de acuerdo o no estarlo, así que son libre de comentar chicos:

### Transacciones y cantidad de Batallas
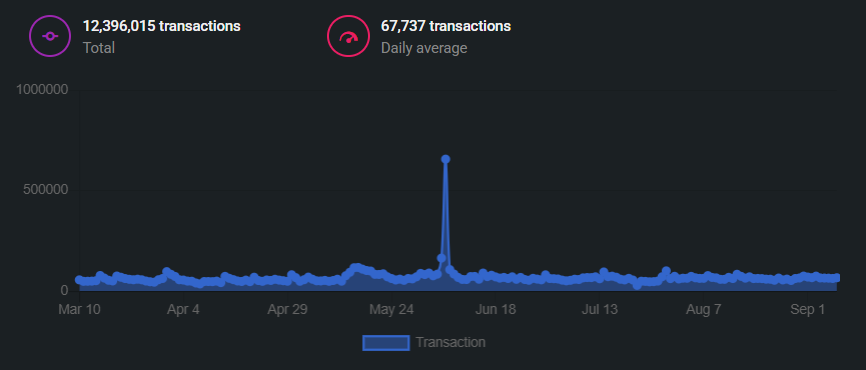
Vamos a comenzar con las “Transacciones”, podemos ver que desde hace 6 meses, se han hecho mas de 12M de transacciones, lo que es una locura, y la media por día son 67737 transacciones, lo que no esta mal tomando en cuenta que esto es en los últimos 6 meses, algo bastante estable, aunque hubo un pico inusual en junio de este mismo año, que supongo que fue con el auge que causo “Conclave Arcana” con 656470 transacciones ese día. Esto lo que nos dice, es que la actividad en el juego es bastante constante, si que es un periodo de tiempo algo corto, medio año, pero, muestra que en esta métrica especifica las cosas están estables.
---
|https://files.peakd.com/file/peakd-hive/lenonmc21/23xKGYxuGM67Q62orXxETVyHpoeN5k27T4dyFqk4UtHS1KKebH4FhHCXNkA2qkzeBPmJz.png|https://files.peakd.com/file/peakd-hive/lenonmc21/EoCaPBnvhGMEQWaX9CV71GrufY2KrVbF3e69HfrTnvrqsfyfuiRSEUoGb78v4jTyDuD.png|https://files.peakd.com/file/peakd-hive/lenonmc21/23u5ZPQmGUyfW2nykcunDJ1cGaEshGg4Wey4ubZANVetXtV1R34ddCG92AVugSCmNBb8u.png|
|-|-|-|
---
Ahora, algo más genial de ver son la “Cantidad de Batallas” que se han jugado, en total son más de 11M de batallas, también una locura, pero, he segmentado esto en 3 imágenes, mostrando la cantidad de batallas en los formatos (Moderno, Salvaje y Supervivencia), así que, analicemos esto por separado:
>* **Moderno:** Como pueden ver en las imágenes, el pico máximo en los últimos 6 meses de la cantidad de batallas en “Moderno” es alrededor de 25k, siendo una de las menores actividades en el juego, aunque no es porque no sea interesante, si no que en este modo no se aceptan BOTS, y es el mejor para ganar SPS actualmente porque no hay muchos jugadores que se dediquen solo a este modo, así que, si van a invertir y quieren jugar, dedíquense a este modo.
>
>* **Salvaje:** Aquí se juega mucho mas que en “Moderno”, y es que es lo natural, en este modo puedes jugar todas las cartas, sin mencionar que, aquí si se aceptan BOTS, por lo que es natural que haya muchas más batallas aquí. Su pico más alto en los últimos 6 meses fue en mayor con 65300 batallas, no estoy seguro el porqué, pero la verdad las partidas aquí son muy estables, la media diaria va entre 25k y 20k de batallas, básicamente 3 veces mas que en “Moderno”, el cual diario son entre 10k y 12k.
>
>* **Supervivencia:** Aquí se juegan muchas menos batallas que en las anteriores, pero esto no significa que sea malo, si no mas bien hay muy buenas oportunidades para sacar una buena cantidad de $SPS, ya que al jugar como media diaria entre 8k y 5k de batallas, muchísimo menos que el resto, quiere decir que hay muchas oportunidades para tener SPS, así que esta seria una buena opción, pero, con riesgos, ya que la energía es tu colección, y si te quedas sin cartas no juegas mas “Supervivencia”, así que es cosa de evaluarlo.
En esta sección veremos aspectos mas importantes, como las “Cuentas activas” en los últimos 6 meses y los nuevos jugadores que han llegado en ese mismo periodo de tiempo, aunque también tenemos varios otros aspectos intrínsecos en los “Nuevos jugadores”, como los inicios de sesión y los “Libros de Hechizos” que se han adquirido, así que, nuevamente sin mas rodeos, vamos con esto:

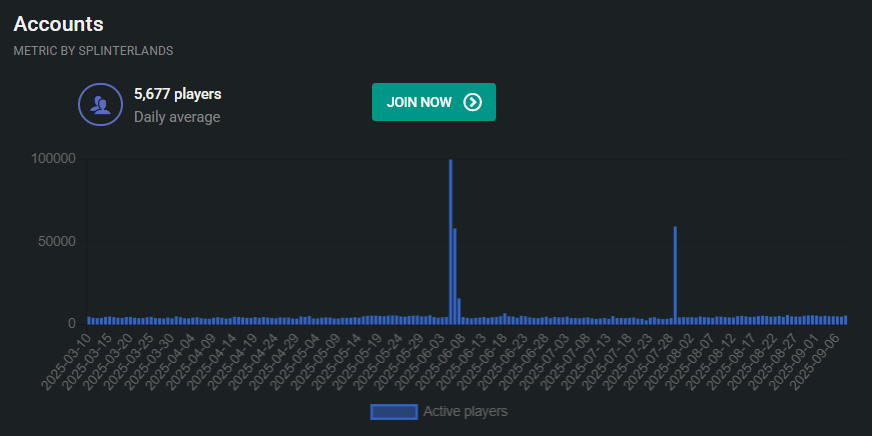
* **Cuentas en los últimos 6 meses:** Esta métrica si es algo me sorprende, ya que es algo baja, por supuesto, esto es en los últimos 6 meses, mostrando un promedio diario de 5677 cuentas activas, que no están mal y ademas es algo constante, ya que lo mínimo son unos 4600 jugadores, y lo máximo unos 5600 jugadores, sin embargo, ha habido picos inusuales, el primero fue en junio, que coincide con el lanzamiento de “Conclave Arcana”, con 99762 jugadores, un crecimiento bárbaro, luego fue en julio, con unos 59329, pero, a pesar de ser bajo, la constancia del mismo numero de jugadore siempre esta, y es lo importante.
---
|https://files.peakd.com/file/peakd-hive/lenonmc21/23tRr91F7XcwErnFYTNMgie7SmoEkGL6d9voFA7KBMHxgyqkFrVsNUzDecvbZFhLJadKf.png|https://files.peakd.com/file/peakd-hive/lenonmc21/23tRvSEXJ1cFffzPixariJ9zj5oikLR7mzGYj8G89BRMmHNbCc5A1duUi5YWbYeyay3Vw.png|
|-|-|
---
* **Inicios de sesión:** Estas métricas no van muy a la par con los “Libros de Hechizos” comprados en los últimos 6 meses, de hecho, los inicios de sesión diarios en su pico máximo que fue en junio, fue de 411, algo que contrasta un poco con las cuentas activas, supongo que esto tiene que ver con los usos de BOTS en el juego que se pueden activar en otras plataformas, no lo doy por sentado, pero es algo que explicaría esta gran diferencia, ademas en los últimos 6 meses el promedio es de 128 inicios de sesión diarios, a menos de que estos inicios de sesión solo se enfoquen en nuevos jugadores, que es algo mucho más lógico que lo primero, algo que no está nada mal, tomando en cuenta que son nuevos jugadores.
* **Compra de “Libro de Hechizos”:** En los 6 meses se han comprado alrededor de 1101 libros, lo que no esta nada mal, tomando en cuenta que cada uno cuesta $10, son $11010 dólares que ha percibido “Splinterlands” en ese periodo de tiempo, ademas uno de los picos mas altos fue en “agosto” de este mismo año, con una compra de 36 libros, lo que no esta mal, supongo que mucha de esta actividad tiene que ver con el nuevo “Formato Frontier”.

# Consideraciones finales

Viendo todo esto, pienso que las estadísticas del juego están bajas comprándolas con el anterior ciclo alcista de 2021, en donde todas estas cifras eran una muy mínima parte, sin embargo, tomando en cuenta que en este ciclo los “Play to Earn” no han sido lo mas buscado ni la narrativa que ha explotado, los números de “Splinterlands” demuestran que hay una comunidad comprometida con el juego y su crecimiento, que es básicamente lo que mantiene a flote todo esto.
Ademas, con la llegada de nuevos jugadores, el formato “Frontier”, los esfuerzos de “Marketing” de todos y especialmente el equipo de “Splinterlands”, estos números deberían de crecer con el tiempo, si recuerdo esto en los próximos 6 meses, hare una nueva comparativa de este post y uno nuevo para evaluar el crecimiento, aunque, podría hacerlo mensual, para tener material.
En todo caso, si tienen dudas o cualquier cosa que quieran preguntar, los leo.
### Nos vemos en el "Campo de Batalla"

Changing the tone of my posts a little, it's time to look at some general metrics regarding Splinterlands, referring to its economy, focusing mainly on $SPS, as well as the number of transactions carried out, number of battles, active accounts, new players, market capitalization of cards, among other details, I am also taking into account a 6-month time frame, which is the period I have access to through the [Peakmonsters](https://peakmonsters.com/dashboard) platform and its Dashboard.
Of course, this will not be an analysis in which the results should be taken as definitive. I believe that the most accurate information is in the Splinterlands APIs. However, I am not a developer and do not have access to them. Although I could help in other ways, I prefer to use tools that already display this data. Furthermore, if they display it and it is still there, it means that it is accurate. So, let's go with them. Don't expect a very long post; I will try to be as brief as possible, since the intention is to quickly observe how all the metrics are doing.
**I will divide this post into two parts, because I don't want to make it too long. In this first part, we will look at transactions, battles, accounts, and new players, while in the second part, we will look at the "market capitalization" of the cards and how $SPS has performed.**

# Transactions and battles in the last 6 months

Okay, let's start with the most common metrics. In the next section and at the end of this post, we'll see how $SPS is performing in terms of its price and how much it has changed since my last analysis. So, without further ado, let's get started. Before we begin, however, these are my opinions regarding the metrics I will show you. You may agree or disagree, so feel free to comment, guys:

### Transactions and number of battles

Let's start with "Transactions." We can see that over the last six months, more than 12 million transactions have been made, which is crazy, and the average per day is 67,737 transactions, which isn't bad considering that this is over the last six months, something quite stable, although there was an unusual spike in June of this year, which I guess was due to the boom caused by "Conclave Arcana" with 656,470 transactions that day. What this tells us is that activity in the game is fairly constant. It is a somewhat short period of time, half a year, but it shows that in this specific metric, things are stable.
---
|https://files.peakd.com/file/peakd-hive/lenonmc21/23xKGYxuGM67Q62orXxETVyHpoeN5k27T4dyFqk4UtHS1KKebH4FhHCXNkA2qkzeBPmJz.png|https://files.peakd.com/file/peakd-hive/lenonmc21/EoCaPBnvhGMEQWaX9CV71GrufY2KrVbF3e69HfrTnvrqsfyfuiRSEUoGb78v4jTyDuD.png|https://files.peakd.com/file/peakd-hive/lenonmc21/23u5ZPQmGUyfW2nykcunDJ1cGaEshGg4Wey4ubZANVetXtV1R34ddCG92AVugSCmNBb8u.png|
|-|-|-|
---
Now, something even cooler to see is the "Number of Battles" that have been played. In total, there are more than 11 million battles, which is also crazy, but I have broken this down into three images, showing the number of battles in each format (Modern, Wild, and Survival), so let's analyze this separately:
>* **Modern:** As you can see in the images, the peak in the last 6 months for the number of battles in "Modern" is around 25k, making it one of the least active modes in the game. However, this is not because it is not interesting, but rather because BOTS are not allowed in this mode, and it is currently the best mode for earning SPS because there are not many players who focus solely on this mode. So, if you are going to invest and want to play, focus on this mode.
>
>* **Wild:** There is much more activity here than in "Modern," which is only natural, since in this mode you can play all the cards, not to mention that BOTS are accepted here, so it's only natural that there are many more battles here. Its highest peak in the last 6 months was in May with 65,300 battles. I'm not sure why, but the truth is that the games here are very stable, with a daily average of between 25k and 20k battles, basically 3 times more than in "Modern," which has between 10k and 12k daily.
>
>* **Survival:** There are far fewer battles here than in the previous ones, but this does not mean that it is bad. Rather, there are very good opportunities to earn a good amount of $SPS, since playing an average of between 8k and 5k battles per day, which is much less than the rest, means that there are many opportunities to earn SPS. So this would be a good option, but it does come with risks, since energy is your collection, and if you run out of cards, you can no longer play "Survival," so it's a matter of weighing the pros and cons.
In this section, we will look at the most important aspects, such as "Active Accounts" in the last 6 months and new players who have joined during that same period. However, we also have several other aspects intrinsic to "New Players," such as logins and "Spellbooks" that have been acquired. So, without further ado, let's get started:


* **Accounts in the last 6 months:** This metric does surprise me somewhat, as it is a little low. Of course, this is for the last six months, showing a daily average of 5,677 active accounts, which is not bad and is also fairly consistent, as the minimum is around 4,600 players and the maximum around 5,600 players. However, there have been some unusual spikes. The first was in June, coinciding with the launch of "Conclave Arcana," with 99,762 players, a huge increase. Then there was another in July, with about 59,329 players. But despite being low, the consistency of the same number of players is always there, and that's what's important.
---
|https://files.peakd.com/file/peakd-hive/lenonmc21/23tRr91F7XcwErnFYTNMgie7SmoEkGL6d9voFA7KBMHxgyqkFrVsNUzDecvbZFhLJadKf.png|https://files.peakd.com/file/peakd-hive/lenonmc21/23tRvSEXJ1cFffzPixariJ9zj5oikLR7mzGYj8G89BRMmHNbCc5A1duUi5YWbYeyay3Vw.png|
|-|-|
---
* **Logins:** These metrics do not quite match up with the "Spell Books" purchased in the last 6 months. in fact, daily logins peaked in June at 411, which contrasts somewhat with active accounts. I suppose this has to do with the use of BOTS in the game that can be activated on other platforms. I'm not taking this for granted, but it is something that would explain this big difference. Furthermore, in the last 6 months, the average is 128 daily logins, unless these logins only focus on new players, which is much more logical than the former, something that is not bad at all, considering that they are new players.
* **Purchase of "Spellbooks":** In the six months, around 1,101 books have been purchased, which is not bad at all, considering that each one costs $10, meaning that Splinterlands has earned $11,010 in that period of time. One of the highest peaks was in August of this year, with 36 books purchased, which is not bad. I suppose much of this activity has to do with the new Frontier format.

# Final thoughts

Seeing all this, I think that the game's statistics are low compared to the previous bull cycle of 2021, where all these figures were a very small part, However, considering that in this cycle, "Play to Earn" has not been the most sought-after or the narrative that has exploded, the numbers for "Splinterlands" show that there is a community committed to the game and its growth, which is basically what keeps all of this afloat.
Furthermore, with the arrival of new players, the "Frontier" format, everyone's marketing efforts, and especially those of
#splinterlands
#arcadecolony
#play2earn
#thgaming
#neoxian
#pimp
#cent
#archon
#hive-engine
#gaming
Payout: 0.000 HBD
Votes: 212
More interactions (upvote, reblog, reply) coming soon.