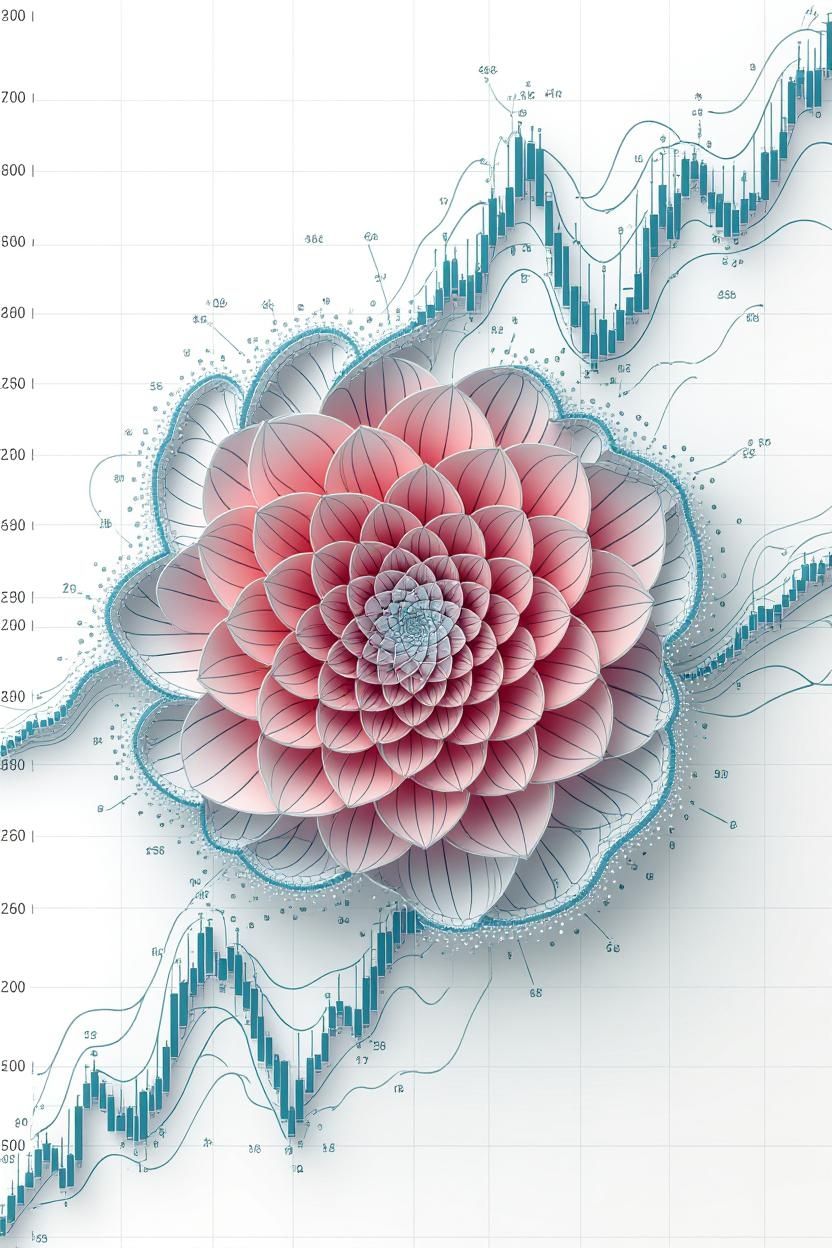
Dow Jones Industrial Average Riding waves of selling that one day, October 27 1997, Sellout triggered circuit breaker By mid-afternoon; To stop the rising tide of turmoil Roiling reeling flood Indices of turbulence The financial structure roils.
Global panic then ensued- Business fell at record pace, Like castles in the sand, 100 million dollars per second. Shaking the foundation In three minutes of pure chaos Of a world that held its breath.
What burst of air caused the storm? What flap of wings or wink? Wizards and soothsayers know not Nor the man of numbers Forming linear trends Ignoring the strange flowers That in a most peculiar way Bloom beyond the limits of his gaze.

Thank you for reading my financial poem (🙃)based on a book called The (Mis)behaviour of Markets: A Fractal View of Financial Turbulence by Benoit Mandelbrot and Richard L. Hudson. The poem is based on a report by the SEC on the mini-market crash of 1997. The authors of the book use this event to illustrate that typical mathematical tools used to understand the markets are not sufficient to see what is really going on in the turbulent world of numbers. Though it now appears that Asian markets instability may have been the trigger of that particular event. Mandelbrot and Hudson posit that fractal mathematics provide a set of tools that bring clarity to some of the wild rides we often see in financial markets. I can’t comment on the soundness of their arguments because I’m not a mathematician or market analyst, so I thought I would write poem instead and generate AI art. I hope you enjoyed them.
 |
 |
 |
 |
|---|---|---|---|
| X | InLeo | NFT Showroom |
Images generated by @litguru using Generative Art software