The past 48 hours have been pretty crazy in the crypto world. We are in the midst of a large crypto correction, dip or whatever you want to call it. Bitcoin and altcoins have been down drastically and the overall market capitalization has decreased by a few hundred billion dollars.
That being said, let's take a look at the chart.
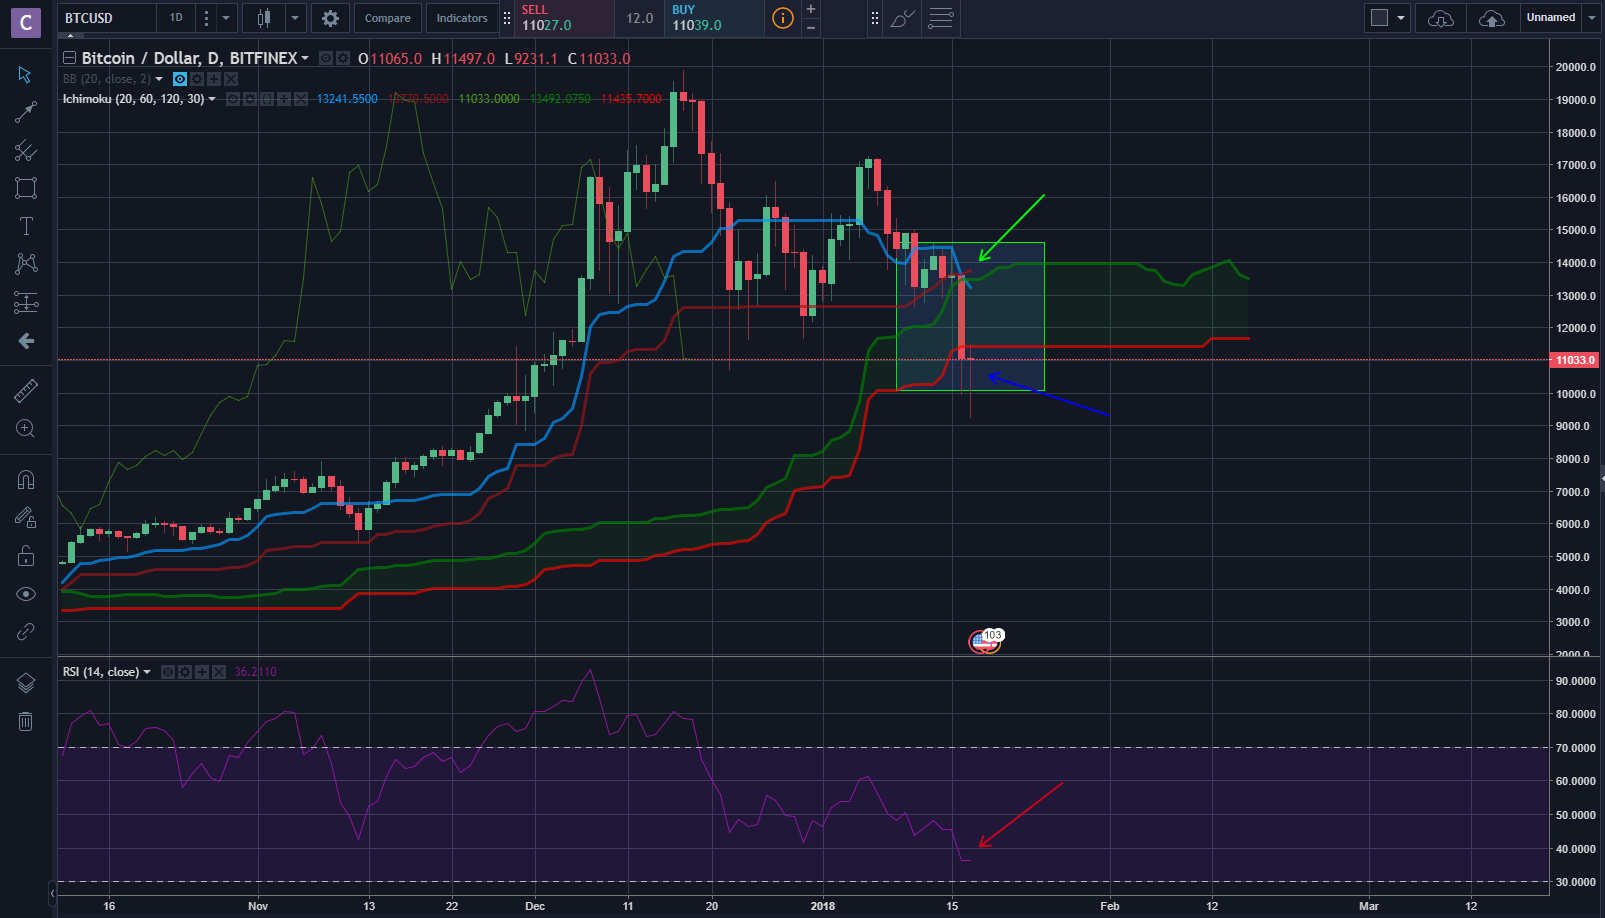
We can see that yesterday we saw the price decrease by 3k shown by a large red candlestick.
Green Arrow: We can see a bearish TK cross signaling a correction.
Blue Arrow: We saw price drop through the kumo cloud signaling bearish price action. We also see a close outside of the kumo cloud which is also not a great sign.
Red Arrow: We see the RSI nearing the oversold region.
To summarize,
We have seen some bearish indicators the past few days and we may continue to see more. I am more optimistic in the lower time frames but I believe it will still be a few more days before daily indicators show more bullish trends. The RSI nearing the oversold region is a good sign as people could begin to buy soon and drive price up, which seems is what is happening today.
I am beginning to do daily price action and chart updates for many cryptocurrencies each day to give a general view of what I think will happen with the current trends and price action. I, however did not choose the best day to start but I hope you will take a look and let me know what you think!
-Astro(mike318)
Twitter: @cryptogumby