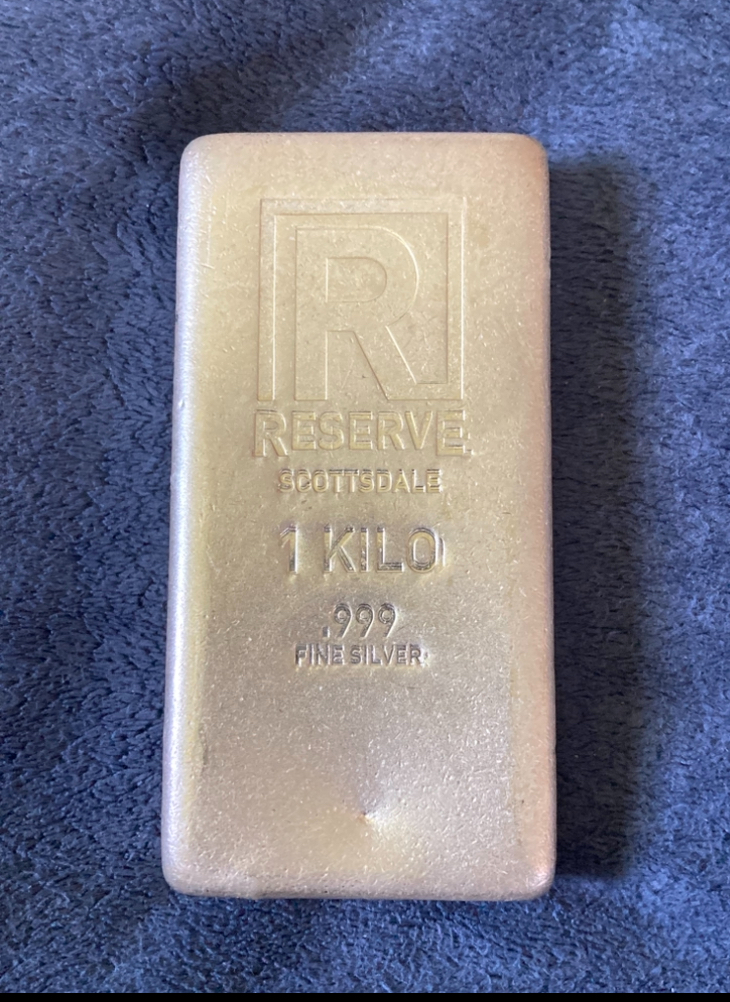
Afternoon everyone….
Unless you live with your head in the sand, you have to realize what is going on with not only the stock market, but the precious metals market as well.
I’ve been covering this in many posts for weeks now. Not very many are actually reading the posts because the comments I’m getting are only about the item in the picture not the actual content of the post. There was only one comment on yesterday’s post that actually pertained to the meaning of the post. Thank you, you know who you are.
What’s ironic is that I had planned on doing a post about silver hitting $50 and gold hitting $4,000 and why it’s such a big deal.
Well…
My favorite online dealer Monument Metals is on the same page. They sent out an email late yesterday on that very subject. First I’m going copy what was in the email then I will discuss afterwards.
Here it is: We’re seeing something rare in the precious metals market: gold and silver are breaking new ground — and most analysts are pointing to very little resistance ahead until $4,000 gold and $50 silver. Below, I’ll walk you through the fundamentals, technicals, macro tailwinds, and what that means for timing your stack. Current Market Context Gold remains above $3,700/oz even after a surprising 3.8% GDP print in Q2. While that kind of strong economic data tends to bolster the dollar and pressure non-yielding assets, gold is holding firm.
Silver is surging — it recently notched another 14-year high, reflecting both safe-haven flows and renewed industrial demand.
The macro backdrop is noisy: expectations of rate cuts, federal funding risk in the U.S., geopolitical escalation, and inflation sticking around all contribute to a base of support for both metals.
I’ve been around for both of the historical silver spikes in 1980 and 2011. I’ve tracked the patterns of both spikes. This one in what I’m seeing hasn’t even hit its stride yet. But….
Psychological Levels That Drive Market Behavior When gold nears $4,000 or silver $50, you’re not just seeing numbers — you’re approaching milestones that tend to trigger investor psychology. At these round figures, many traders act emotionally: taking profits, riding momentum, or entering new positions. So while we should map resistance zones, we also treat them as caution points, not walls. Historical Context: Then vs. Now vs. What Could Be
Why We Think the Path to $4,000 / $50 Is More Clear than Many Realize
-
A bullish pivot from the Fed is factored in (but not aggressively) Analysts argue that the Fed is likely to ease policy later in 2025. That reduces the opportunity cost of holding gold and silver. One write-up from FXEmpire calls a Fed pivot the “starting gun” for a potential run to $4,000 gold and $50 silver.
-
Technicals suggest fewer hurdles ahead Gold recently broke through long-term resistance zones in a clean, sustained move. Some chart studies show a “cup-and-handle” pattern confirming that structure and targeting $4,000. Silver, meanwhile, looks poised to test historical resistance zones around $48–$50 — consistent with rate-of-change momentum that’s not yet overextended.
While I agree with most of this, from the information I’m getting from very close friends living all over the country is that there isn’t the panic of missing out yet to the general population like in 2011.
- Strong structural demand support Central banks continue to add gold to reserves.
Silver’s demand is dual: investment demand is high now, and industrial demand (solar, electronics, EVs) is a powerful tailwind.
HSBC recently revised its silver forecasts upward, citing both safe-haven dynamics and supply deficits.
At the same time, infrastructure and green energy shifts mean silver isn’t just a “metal for stacking” — it’s integral to technologies fueling the next decade. 4. Sentiment & momentum momentum Price breakouts tend to feed on themselves—when gold or silver convincingly pierce resistance, momentum traders pile in. We’re not seeing exhaustion signals yet, which suggests more room to run. (Volatility spikes in traditional markets often push more capital into precious metals.) What This Means for You Think long term. These are not swings to trade — they’re moves to hold through. Layer in exposure. Don’t bet everything at the apex; accumulate steadily. Monitor key levels + metrics. Inflation (PCE), Fed commentary, and industrial demand for silver are your primary controls. Use historical context wisely. The past rallies show us what’s possible — and what patience looks like. Monitor the gold-silver ratio. A compression (silver catching up to gold) could signal disproportionate upside for silver.
If this is accurate the GSR will drop like a rock. Meaning to me below the 70-1 ratio. Which in my personal opinion means I’m converting some silver to gold.
I am not a finacial adviser nor do I claim to be. I’m just a collector/stacker following along.
Here’s some shiny for reading, that is if you actually read it.
