At elmo-burns.com, we've developed a specialized chart that gives Splinterlands players a clear understanding of how SPS tokens are distributed across the ecosystem. This article explains how our chart works, the technical details behind it, and what makes it valuable for players and investors.
What is the SPS Distribution Chart? The SPS Distribution Chart is an interactive visualization that shows the current allocation of all SPS (Splintershards) tokens that have ever been minted.
Where the Data Comes From The chart pulls data directly from the official Splinterlands validator API:https://splinterlands-validator-api.splinterlands.com/extensions/tokens/SPS/supply?
This API provides comprehensive information about the SPS token supply, including:
{
  "token": "SPS",
  "minted": 3000000000,
  "burned": 170104359.241,
  "total_staked": 937179969.747,
  "total_supply": 2829895640.765,
  "circulating_supply": 1471740715.536,
  "off_chain": {
    "hive_engine": 142380920.109,
    "eth": 28671132.663,
    "bsc": 204430489.418
  },
  "reserve": {
    "dao": 585445590.825,
    "dao_reserve": 421651423.187,
    "terablock_bsc": 40153.645,
    "terablock_eth": 34116.823
  },
  "reward_pools": {
    "total": 706313601.654,
    "$REWARD_POOLS_BRAWL": 75175398.2,
    "$REWARD_POOLS_LAND": 145040637.503,
    "$REWARD_POOLS_LICENSE": 73915146.387,
    "$VALIDATOR_REWARDS": 17276422.954,
    "$REWARD_POOLS_SOULKEEP": 21225408.585,
    "$REWARD_POOLS_MODERN": 17124245.706,
    "$REWARD_POOLS_WILD": 16945645.964,
    "$REWARD_POOLS_SURVIVAL": 6376766.489,
    "$UNCLAIMED_UNISWAP_REWARDS": 231359099.288,
    "$TOURNAMENTS_DISTRIBUTION": 27370776.984,
    "$SPS_STAKING_REWARDS": 74399669.596,
    "$REWARD_POOLS_FOCUS": 41061.064,
    "$REWARD_POOLS_SEASON": 63322.934
  }
}
This ensures the chart always provides an accurate representation of where each SPS token currently resides in the ecosystem.
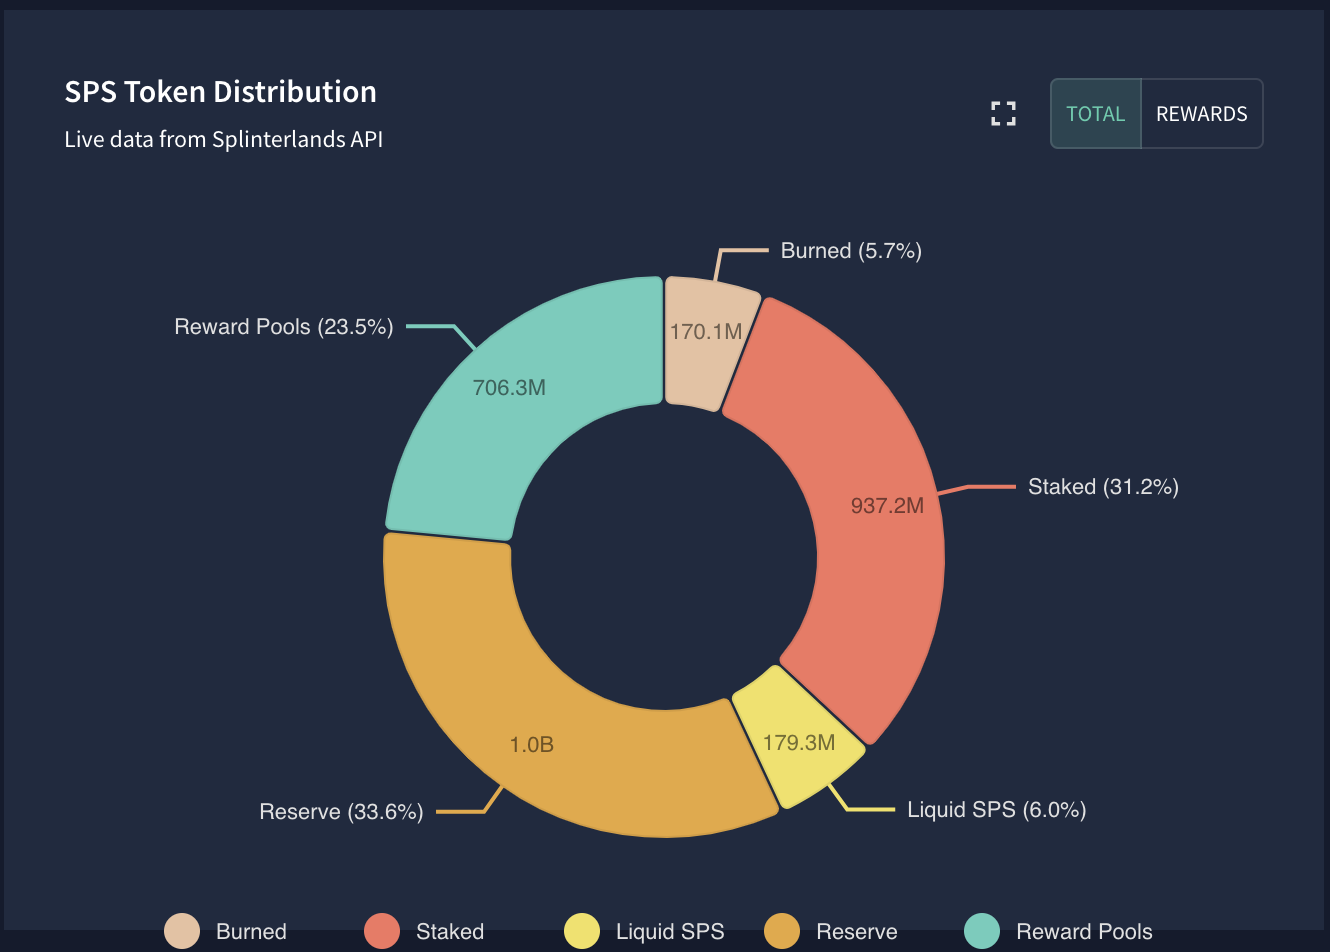
Two Views: Total Distribution and Reward Pools The chart offers two viewing modes:
-
Total Distribution Shows the big picture with five key categories.
Burned: Tokens permanently removed from circulation Staked: Tokens locked in staking contracts by users Liquid SPS: Unstaked tokens in active circulation Reserve: Tokens held in reserve by the DAO and partners Reward Pools: Tokens allocated for various gameplay and ecosystem rewards 2. Reward Pools Breakdown Drills down into just the "Reward Pools" segment to show the allocation across:
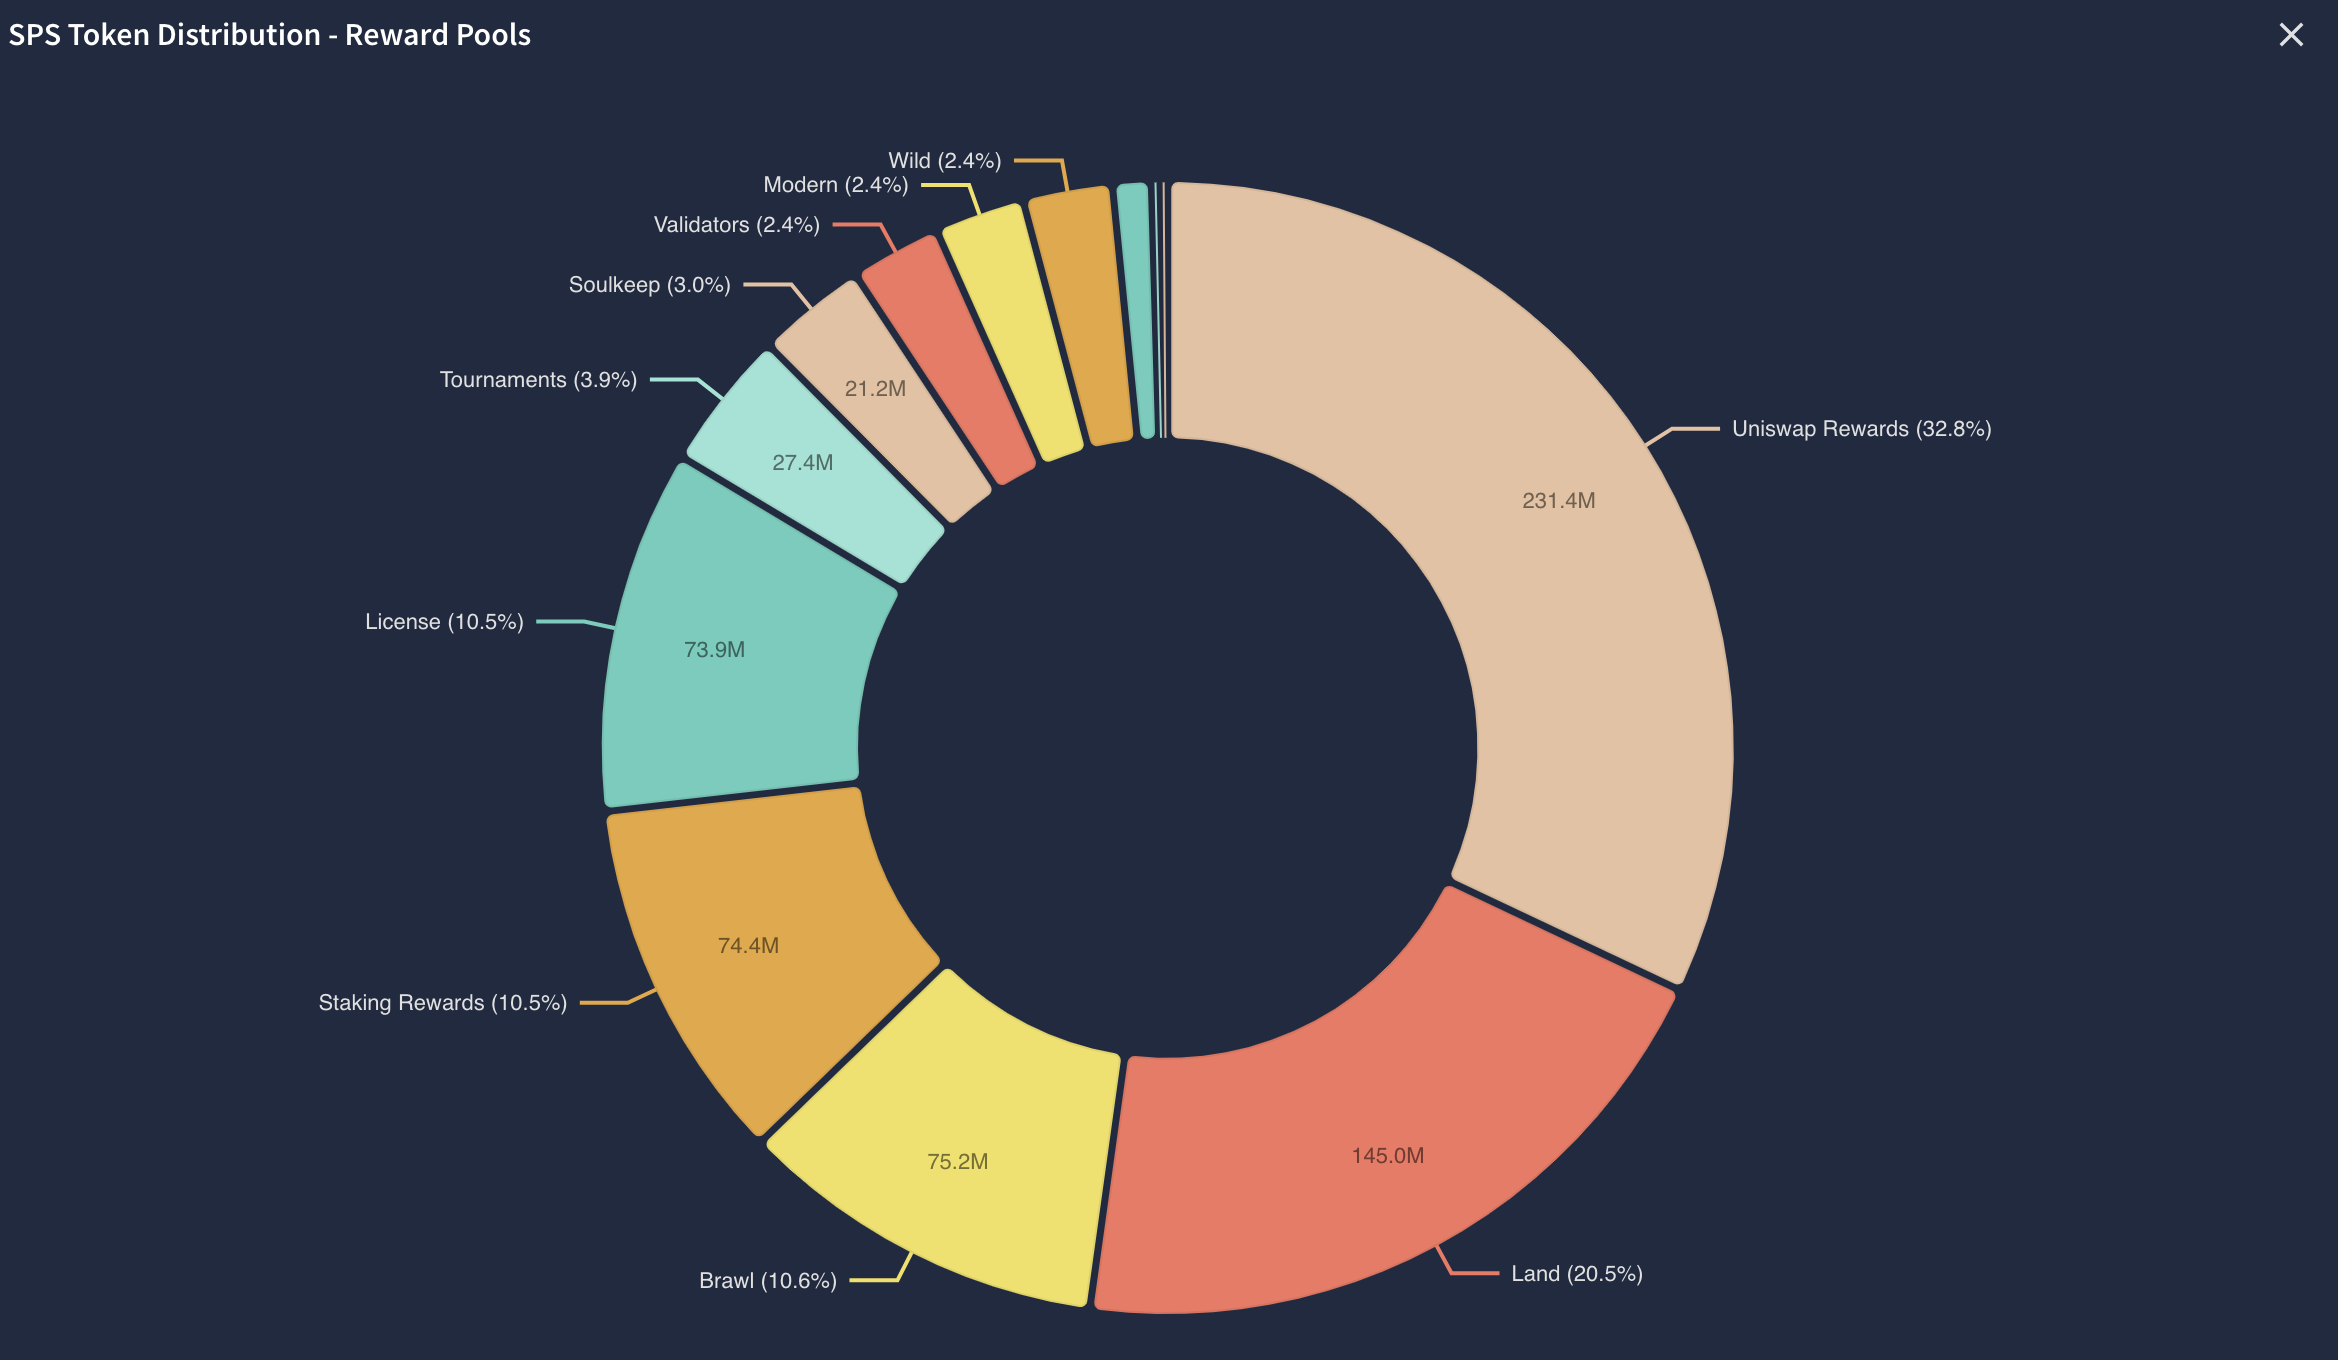
Staking Rewards Land gameplay Brawl tournaments License holder rewards Game mode specific pools (Modern, Wild, Survival, Focus, Season) Tournament rewards Validator rewards Technical Implementation Details
The SPS Distribution Chart uses React with the Nivo visualization library. Some key technical features:
Data Processing We transform the raw API data into a structured format optimized for visualization:
// For each token category
const totalDistributionData = [
  {
    id: "Burned",
    label: "Burned",
    value: burnedAmount,
    percentage: calculatePercentage(burnedAmount),
    description: categoryDescriptions.burned,
    details: `${formatValue(burnedAmount)} SPS tokens have been permanently burned...`
  },
  // Other categories follow same pattern...
];
** Percentage Calculation** To ensure accuracy, we calculate each segment's percentage based on the total minted tokens:
const calculatePercentage = (value) => ((value / totalBasis) * 100).toFixed(1);
** User-Friendly Number Formatting** Large numbers are formatted for easy readability:
const formatCompactValue = (value) => {
  if (value >= 1000000000) {
    return `${(value / 1000000000).toFixed(1)}B`;
  } else if (value >= 1000000) {
    return `${(value / 1000000).toFixed(1)}M`;
  } // etc...
};
Why Understanding SPS Distribution Matters For players and investors, SPS distribution insights help with:
Investment Strategy: Understanding token concentration and supply dynamics Staking Decisions: Seeing what percentage of tokens are currently staked Reward Expectations: Knowing how much SPS is allocated to different reward pools Token Economics: Monitoring burning rate and circulating supply trends Supporting the Project All income generated from elmo-burns.com is invested back into the Splinterlands ecosystem in two ways:
Building Hive Power: We invest all earnings into HP (Hive Power) until we reach our goal of 300 HP.
Burning SPS: After reaching our HP goal, all income will be used to purchase and burn SPS tokens, permanently reducing supply and potentially benefiting all token holders.
This commitment ensures that using our tools not only provides you with valuable insights but also contributes positively to the ecosystem we're all part of.
Try It Yourself Visit elmo-burns.com to explore the SPS Distribution Chart, along with other analytics tools we've developed for the Splinterlands community.
Technical Resources For developers interested in creating similar visualizations:
Splinterlands Validator API Documentation Nivo Chart Library React Component Examples Stay tuned for more articles in our series explaining the analytics tools available on elmo-burns.com!