~~~ La versione in italiano inizia subito dopo la versione in inglese ~~~
ENGLISH

17-08-2025-Mechanical Measurements - Representation of a Signal in Time and Frequency [EN]-[IT] With this post, I would like to provide a brief introduction to the topic in question. (code notes: X-91)
Representation of a Signal in Time and Frequency
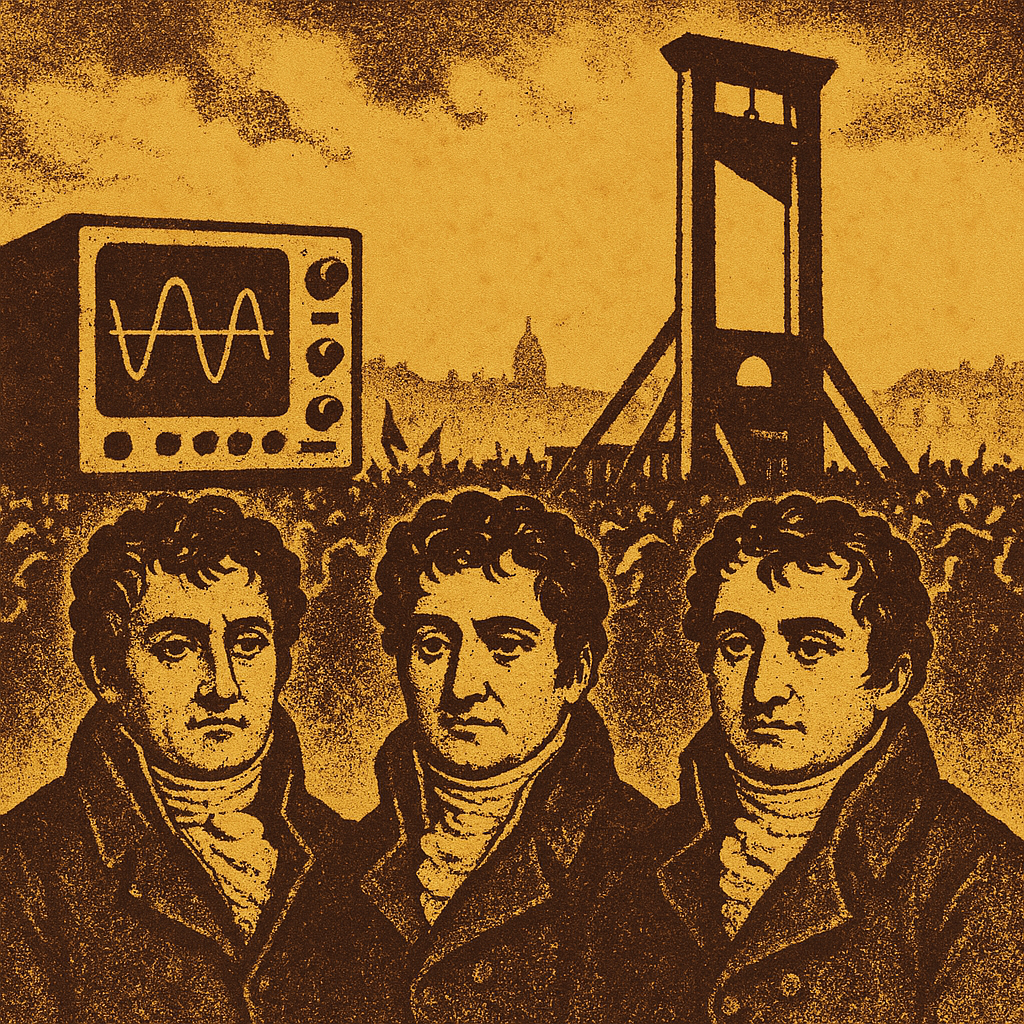
Image created with artificial intelligence, the software used is Microsoft Copilot
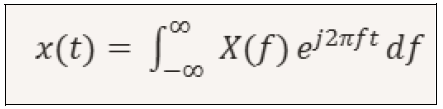
The Fourier Transform The Fourier transform has decisively changed the way signals are analyzed in engineering, music, medicine, and physics. Fourier's key insight was that any function, even a non-sinusoidal one, could be viewed as a sum of sinusoids. The Fourier transform has thus become a very useful tool in signal analysis and is often used for data processing. Essentially, it is a mathematical operation that allows a signal to be transformed from the time domain to the frequency domain. We can also say that the Fourier transform allows us to represent a signal as the sum of sinusoids of different frequencies, amplitudes, and phases. Recall that a square wave with period T can be represented as the sum of sinusoids using the Fourier series. The Fourier series is a discrete version of the transform for periodic signals. The continuous form of the Fourier transform for a signal x(t) is shown below.
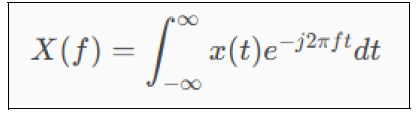
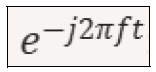
Where: x(t) is the signal in time X(f) is the frequency domain representation f is the frequency j is the imaginary unit, where j^2=-1 Note: The term shown below that we find in the Fourier transform is a complex exponential that acts as a filter to extract the frequency component. f
Since we said that the Fourier transform helps us move from the time domain to the frequency domain, we can also say that it helps us do the inverse. With the inverse transform, we can, in fact, move from the frequency domain to the time domain. The inverse transform is shown below:
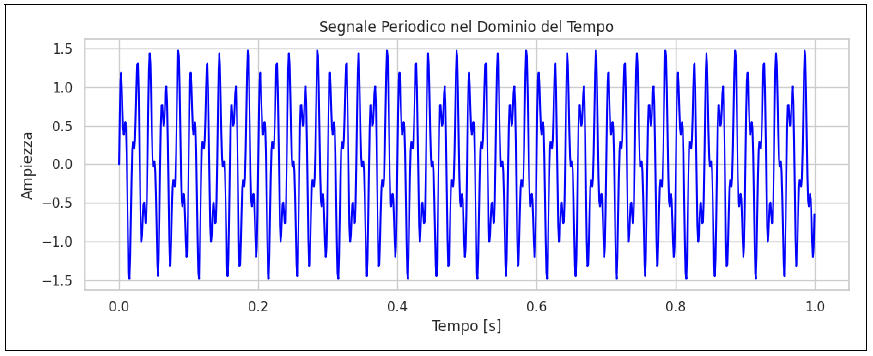
Graph of a signal in the time and frequency domain Let's create a signal composed of two sinusoids, one at 50 Hz and the other at 120 Hz with half the amplitude. The time-domain graph shows the resulting oscillation of the sum of the two sinusoids. Below is the graph showing our periodic signal, conceived as above, in the time domain, where the time in seconds is on the x-axis and the amplitude is on the y-axis! image.png
Below is the signal spectrum in the frequency domain, where the Fourier transform shows two peaks, one at 50 Hz and one at 120 Hz. Note how the one at 120 Hz is lower. The reason the 120Hz peak is lower in the frequency spectrum is because the amplitude of the 120Hz sine wave was half that of the 50Hz one. This was part of the initial hypothesis.
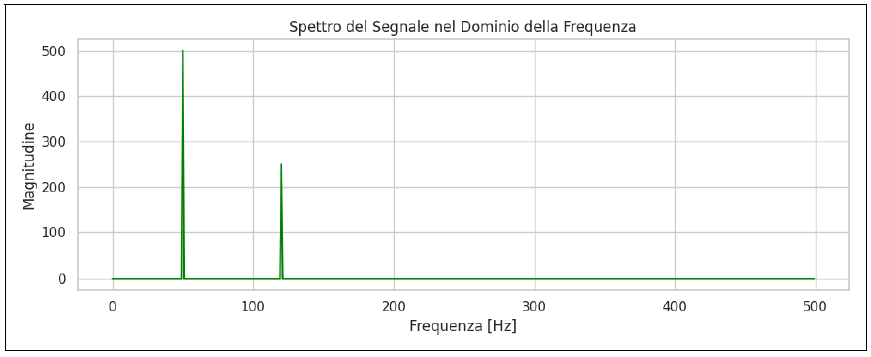
Note: In the Fourier transform graph, the magnitude, representing the amplitude of each sinusoidal component, is plotted on the y-axis. We can say that the magnitude represents how strong or present a certain frequency is.
Conclusions The Fourier transform is a fundamental tool for analyzing the frequency structure of a signal. These analyses are performed primarily in the engineering field for vibration analysis and quality control based on acoustic signals. Technically, we can think of the Fourier transform as a mathematical prism that takes a signal in time and breaks it down into its constituent frequencies.
Question Joseph Fourier (1768-1830) was a French mathematician and physicist renowned for his harmonic analysis, Fourier series, and the law of heat conduction. I believe many people studied Fourier at school. Did you know that he participated in the French Revolution, risking being guillotined?

ITALIAN

17-08-2025-Misure meccaniche - Rappresentazione di un segnale nel tempo e nella frequenza [EN]-[IT] Con questo post vorrei dare una breve istruzione a riguardo dell’argomento citato in oggetto (code notes: X-91)
Rappresentazione di un segnale nel tempo e nella frequenza
immagine creata con l’intelligenza artificiale, il software usato è Microsoft Copilot
La trasformata di Fourier La trasformata di Fourier ha cambiato in maniera decisiva il modo in cui si analizzano i segnali in ingegneria, in musica, in medicina ed in fisica. L’intuizione chiave che ebbe Fourier fu quella che ogni funzione, anche di forma non sinusoidale, poteva essere vista come somma di sinusoidi. La trasformata di Fourier è diventata quindi uno strumento molto utile nell’analisi dei segnali e viene usato spesso per l’elaborazione dei dati. Sostanzialmente è un operazione matematica che consente di trasformare un segnale dal dominio del tempo al dominio della frequenza. Possiamo anche dire così, la trasformata di Fourier permette di rappresentare un segnale come somma di sinusoidi di diverse frequenze, ampiezze e fasi. Ricordiamo che un'onda quadra con periodo T può essere rappresentato come somma di sinusoidi tramite la serie di Fourier. La serie di Fourier è una versione discreta della trasformata per segnali periodici. Qui di seguito è mostrata la forma continua della trasformata di Fourier per un segnale x(t)
Dove: x(t) è il segnale nel tempo X(f) è la rappresentazione nel dominio della frequenza f è la frequenza j è l’unità immaginaria, dove j^2=-1 Nota: Il termine qui sotto riportato che ci ritroviamo nella trasformata di Fourier è un esponenziale complesso che funge da filtro per estrarre la componente a frequenza f
Siccome abbiamo detto che la trasformata di Fourier ci aiuta a passare dal dominio del tempo a quello della frequenza, possiamo anche dire che ci aiuta a fare l’inverso. Con la trasformata inversa possiamo infatti passare dal dominio della frequenza a quello del tempo. Qui di seguito è mostrata la trasformata inversa:
Grafico di un segnale nel dominio del tempo e della frequenza
Andiamo a creare un segnale composto da due sinusoidi, una a 50 Hz e l’altra a 120 Hz con ampiezza dimezzata. Il grafico nel dominio del tempo mostra l’oscillazione risultante della somma delle due sinusoidi
Qui di seguito il grafico che mostra il nostro segnale periodico, pensato come sopra, nel dominio del tempo, dove sulle ascisse abbiamo il tempo in secondi, mentre sulle ordinate abbiamo l’ampiezza
Qui di seguito lo spettro del segnale nel dominio della frequenza dove la trasformata di Fourier mostra due picchi, uno a 50 Hz e uno a 120 Hz. Da notare come quello a 120 Hz sia più basso. Il motivo per cui il picco a 120Hz è più basso nello spettro delle frequenze è dovuto al fatto che l’ampiezza della sinusoide a 120Hz era dimezzata rispetto a quella a 50 Hz. Questa cosa faceva parte dell’ipotesi iniziale.
Nota: nel grafico della trasformata di Fourier nell’asse delle ordinate viene rappresentata la magnitudine che rappresenta l’ampiezza di ciascuna componente sinusoidale. Possiamo dire che la magnitudine rappresenta quanto forte o presente sia una certa frequenza.
Conclusioni La trasformata di Fourier è uno strumento fondamentale per analizzare la struttura frequenziale di un segnale. Queste analisi vengono effettuate soprattutto nell’ambito ingegneristico per fare analisi di vibrazioni e controllo qualità basato sui segnali acustici. Tecnicamente possiamo immaginare la trasformata di Fourier come un prisma matematico che prende un segnale nel tempo e lo scompone nelle sue frequenze costitutive.
Domanda Joseph Fourier (1768-1830) è stato un matematico e fisico francese famosissimo per l’analisi armonica, le serie di Fourier e la legge sulla conduzione del calore. Credo che in molti a scuola abbiano studiato qualcosa di Fourier. Sapevate che egli partecipò alla Rivoluzione francese, rischiando di essere ghigliottinato?
THE END