~~~ La versione in italiano inizia subito dopo la versione in inglese ~~~
ENGLISH

18-08-2025-Mechanical Measurements - Data Analysis [EN]-[IT] With this post, I would like to provide a brief introduction to the topic in question. (code notes: X-90)
Data Analysis

Image created with artificial intelligence, the software used is Microsoft Copilot
Introduction We can describe data analysis as a data collection activity that will be analyzed mathematically and that, ultimately, should support strategic decisions. For example, the most classic operation typically performed on a list of data is the arithmetic mean.
The Data Set Let's consider the following list containing 100 temperature measurements. Given these measurements, we can consider calculating the mean value, the standard deviation, the standard deviation of the mean, and the expanded uncertainty.
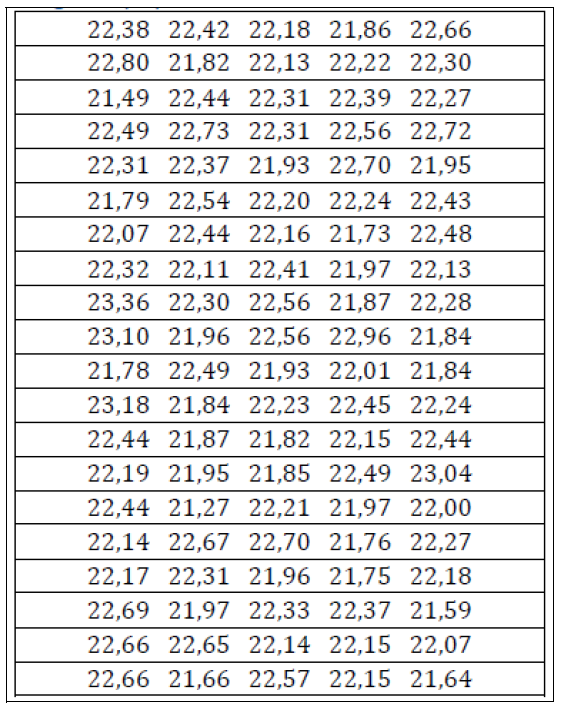
Image created with artificial intelligence, the software used is Microsoft Copilot
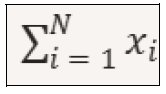
The mean value of the sample In this case, we add all 100 measurements and divide them by 100. We can mathematically describe the mean as follows:
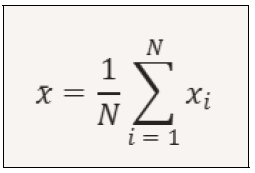
*Image created with artificial intelligence, the software used is Microsoft Copilot
Where: x is the mean value of the sample N is the total number of measurements xi is the i-th measurement (each individual temperature value) NOTE: The term represented below is the sum of all measurements from i=1 to i=N
In our case, the mean value is approximately 22.20°C. Sample Standard Deviation The standard deviation is a statistical measure that indicates how much data vary from their mean. We can also say that the standard deviation measures the dispersion of the data in a sample, i.e., its variability. The sample standard deviation is calculated as follows:
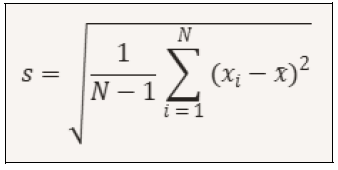
Where: s is the sample standard deviation xi are the individual data points x is the mean of the data N-1 is used to correct the calculation when working with a sample (this term is also called the Bessel correction). In our case, the standard deviation is approximately 0.40°C. 2 Standard deviation of the mean It quantifies the uncertainty associated with the mean of a set of measurements. We can say that it is a sort of indicator that tells us how much we can trust the mean as representing the true value.
The following shows how it is represented mathematically.
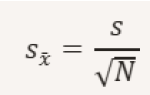
Where: Sx is the standard deviation of the mean s is the sample standard deviation N is the number of measurements. In our case, the standard deviation of the mean is approximately 0.04 °C Expanded Uncertainty Technically, we can define expanded uncertainty as follows. Expanded uncertainty is the result of the standard uncertainty multiplied by a coverage factor 𝑘, which depends on the desired confidence level. Essentially, it serves to provide a range of values within which the true value is believed to lie with a certain level of confidence.
The mathematical expression is shown below.
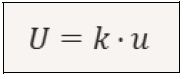
Where: U is the expanded uncertainty u is the standard uncertainty, which could be the standard deviation of the mean k is the coverage factor. Given the data table above, we can say that the expanded uncertainty is approximately ±0.08°C Conclusions Knowing how to analyze data is important for making correct decisions. Calculating the mean, standard deviation, standard error, and expanded uncertainty allows you to accurately describe the data, estimate variability, assess the reliability of the mean, and communicate the degree of confidence in the measurement. This series of calculations makes scientific analysis credible.
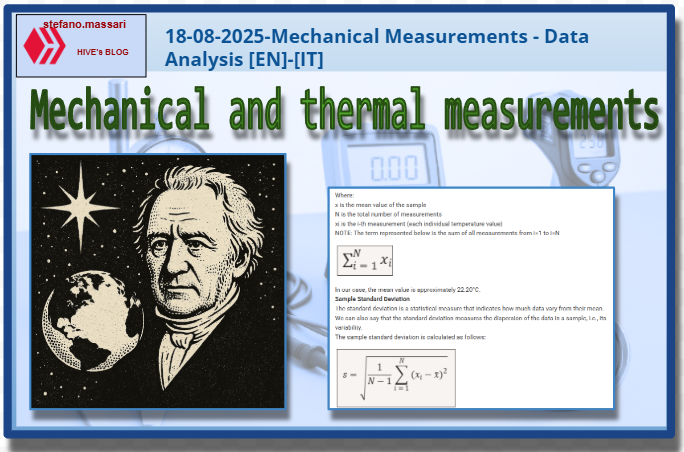
Question In this article, we mentioned the "Bessel correction." Friedrich Wilhelm Bessel (1784–1846) was a German astronomer, mathematician, and physicist. Did you know that Bessel was the first scientist to successfully measure the precise distance of a star from Earth for the first time?

ITALIAN

18-08-2025-Misure meccaniche - Analisi di dati [EN]-[IT] Con questo post vorrei dare una breve istruzione a riguardo dell’argomento citato in oggetto (code notes: X-90)
Analisi di dati
immagine creata con l’intelligenza artificiale, il software usato è Microsoft Copilot
Introduzione Possiamo descrivere l’analisi di dati come un attività di raccolta dati che verrà analizzata matematicamente e che dovrà, come fino ultimo, essere di supporto per decisioni strategiche. Ad esempio, l’operazione più classica che solitamente si fa su un elenco dati è la media aritmetica.
L’insieme di dati Prendiamo in considerazione il seguente elenco in cui ci sono segnate 100 misure, sono rilevazioni di temperature. Date queste misure possiamo prendere in considerazione di calcolare il valore medio, la deviazione standard, la deviazione standard della media e l’incertezza estesa.
immagine creata con l’intelligenza artificiale, il software usato è Microsoft Copilot
Il valore medio del campione In questo caso sommiamo tutte le 100 misurazioni e le dividiamo per 100. Possiamo descrivere matematicamente la media come segue:
*immagine creata con l’intelligenza artificiale, il software usato è Microsoft Copilot
Dove: x è il valore medio del campione N è il numero totale delle misure xi è la misura i-esima (ogni singolo valore di temperatura) NOTA: Il termine qui sotto rappresentato è la somma di tutte le misure da i=1 a i=N
Nel nostro caso il valore medio è circa 22,20 °C Deviazione standard del campione La deviazione standard è una misura statistica che indica quanto variano i dati rispetto alla loro media. Possiamo anche dire che la deviazione standard misura la dispersione dei dati in un campione, cioè la variabilità. La deviazione standard del campione si calcola nella seguente maniera
Dove: s è la deviazione standard del campione xi sono i singoli dati x è la media dei dati N-1 si usa per correggere il calcolo quando si lavora con un campione (questo termine è chiamato anche correzione di Bessel) Nel nostro caso la deviazione standard è di circa 0,40 °C 2 Deviazione standard della media Essa quantifica l’incertezza associata alla media di un insieme di misure. Possiamo dire che è una sorta di indicatore che ci dice quanto possiamo fidarci della media come rappresentazione del valore vero. Qui di seguito è mostrato come si rappresenta matematicamente.
Dove: Sx è la deviazione standard della media s è la deviazione standard del campione N è il numero delle misure. Nel nostro caso la deviazione standard della media è circa 0.04 °C L’incertezza estesa Tecnicamente possiamo definire l’incertezza estesa come segue. L’incertezza estesa è il risultato dell’incertezza standard moltiplicata per un fattore di copertura 𝑘, che dipende dal livello di confidenza desiderato. Sostanzialmente serve per dare un intervallo di valori entro cui si ritiene che il valore vero si trovi con un certo livello di fiducia. Qui di seguito come si esprime matematicamente.
Dove: U è l’incertezza estesa u è l’incertezza standard, potrebbe essere la deviazione standard della media k è il fattore di copertura. Data la tabella dati sopra riportata possiamo dire che l’incertezza estesa è di circa ±0.08 °C Conclusioni Sapere analizzare i dati è importante per prendere delle decisioni corrette. Calcolare il valore medio, la deviazione standard, l’errore standard e l’incertezza estesa permette di descrivere con precisione i dati, stimare la variabilità, valutare l’affidabilità della media e comunicare il grado di fiducia nella misura. Questa serie di calcoli rendono l’analisi scientifica credibile.
Domanda In questo articolo abbiamo citato la "correzione di Bessel". Friedrich Wilhelm Bessel (1784–1846), fu un astronomo, matematico, fisico tedesco. Lo sapevate che Bessel fu il primo scienziato a misurare con successo per la prima volta la distanza precisa di una stella dalla Terra?
THE END