
Immagine realizzata con Canva
*Da tempo desideravo trovare una analisi del prezzo di HIVE che fornisse una idea su quale fosse il valore ottimale di acquisto di questa cryptovaluta. Non l'ho mai trovata e così ho pensato di rimboccarmi le maniche e farla io. Non sono un esperto e nemmeno un mago di Excel. probabilmente nei miei ragionamenti ci potrebbe essere qualche errore di ragionamento o valutazione, vi prego di essere indulgenti. Il mio scopo è chiarirmi le idee, darmi una strategia. Non è un consiglio finanziario, solo un utente che si è domandato: "Sotto quale livello di prezzo conviene acquistare HIVE?"
Cominciamo!*
---
Tempo fa scrissi che avevo trovato un sito in grado di calcolare la media storica di HIVE. Quello che non avevo mai pensato, ma perchè davvero non ci avevo mai badato è che da [FXEMPIRE](https://www.fxempire.it/crypto/hive/history) potessi anche scaricare i dati per elaborarli.
Il sito non ha un download in formato excel, ma presentandomi tutti i dati in tabella, mi sono saputo arrangiare con il buon vecchio copia-incolla.

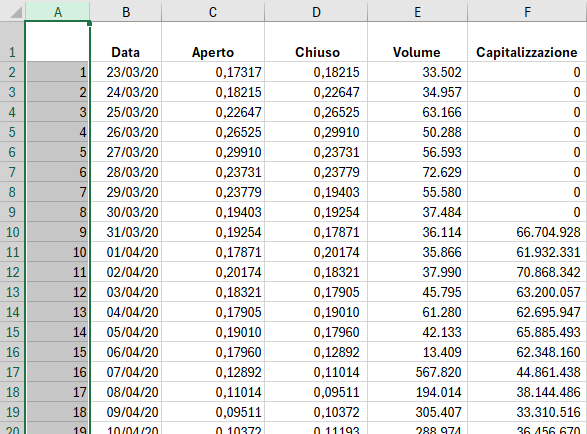
Mi sono messo così un po' di impegno, ho sistemato le tabulazioni, il formato delle celle, sostituito le virgole delle migliaia con dei molto più civili punti e ho costruito il mio set di dati:
- Ho considerato il perdio dal 20 Marzo 2020 al 20 Marzo 2025, cioè i primi 5 anni di HIVE;
- 1824 righe, ognuna rappresentante un giorno di questi cinque anni;
- Data, Prezzo di apertura, Prezzo di chiusura, Volume e Capitalizzazione. Avevo più di quanto mi servisse per fare la mia analisi.
---
# La media
Il primo passo è stato quello di calcolarmi la media storica del prezzo. So che la potevo già desumere dal sito FXEMPIRE ma volevo verificare che coincidesse con quel dato e dare coerenza a tutti i dati che avrei elaborato partendo dalla stessa origine.
Ho quindi proceduto a:
- Calcolare la media giornaliera tra il Prezzo di apertura e il Prezzo di chiusura. Questo per ogni riga del mio set di dati (Ho creato la colonna Medio Giornaliero);
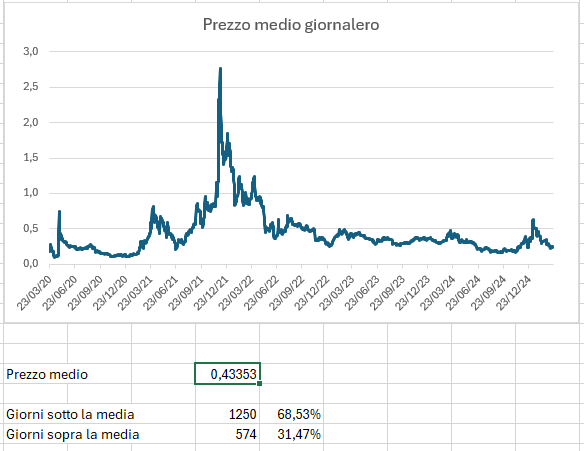
- Utilizzando la funzione MEDIA di excel, ho calcolato il Prezzo Medio, pari a: 0,43353 $
Il valore ottenuto si discosta leggermente da quello di FXEMPIRE ma parlando di decimillesimi non me ne preoccupo e tengo buono quello calcolato da me.
Confrontando il Prezzo medio con i vari Prezzi medi giornalieri ho scoperto che su 1824 giorni, il prezzo di HIVE è stato sopra la media per 1250, mentre è stato sotto la media per 574.
Questo mi ha fatto sorgere un dubbio: come mai questo sbilanciamento verso l'alto? Ho quindi proseguito l'analisi.
---
# La mediana
Il mio sospetto è stato che nei primi cinque anni di HIVE ci fossero stati dei periodi "estremi", in cui cioè il prezzo fosse salito molto, così tanto da falsare un po' il valore della media. La mia riflessione è che alcuni eventi esterni e non legati al valore che viene riconosciuto a HIVE (Una moda per le cryptovalute, un trend, una guerra), possano aver fatto aumentare i prezzi. In questo modo il prezzo medio si è alzato, diventando meno rappresentativo del reale valore di questa criptovaluta.
Per verificarlo ho deciso di
- ordinare l'intera distribuzione dei prezzi in ordine crescente (dal più basso al più alto);
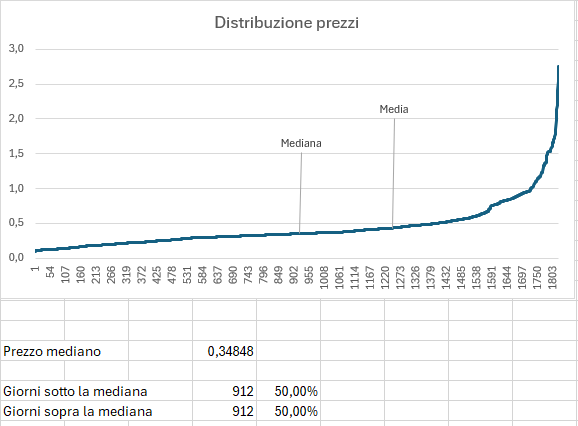
- attraverso la funzione MEDIANA, calcolare il Prezzo Mediano del mio set di prezzi, pari a: 0,34848 $
Avere una mediana inferiore alla media conferma quanto ipotizzavo. Ho dei prezzi molto alti che spingono su la media, rendendola meno rappresentativa del reale valore di HIVE. Lo si può capire meglio con il grafico dell'ordinamento dei prezzi medi. A questo punto, ho trovato solo una strada da seguire.
---
# La deviazione standard
Ho recuperato delle nozioni di statistica base di quando ero in università e ho provato a ragionarci su. Volevo eliminare tutti quei valori legati agli eventi "estremi" e l'unico modo che ho trovato è stato calcolare la deviazione standard.
*La deviazione standard è una misura dell'ampiezza delle oscillazioni del prezzo attorno alla sua media ed è calcolata come radice quadrata della media aritmetica dei quadrati degli scarti dei prezzi dalla media.*
La definizione la fa apparire complessa, ma è più facile di quello che sembra. La deviazione calcola quanto oscillino mediamente dei valori attorno alla loro media. Io ho considerato che tutto ciò che è superiore o inferiore a questa oscillazione sia da considerarsi come un evento "estremo".
Excel anche qui viene in aiuto con la funzione DEV.ST e per il nostro set di prezzi la deviazione standard è di 0,31405 $. Questo significa che qualunque prezzo:
- Superiore a Prezzo medio + Deviazione standard (0,43353 + 0,31405 = 0,74757);
- Inferiore a Prezzo medio - Deviazione standard (0,43353 - 0,31405 = 0,11948);
è da considerarsi legato ad un evento "estremo" e quindi andrebbe eliminato dal calcolo del prezzo medio. Analizzando i dati in nostro possesso mi sono accorto che il prezzo medio è stato inferiore ad una deviazione standard per 40 giorni, mentre è stato superiore ad una deviazione standard per 236 giorni.
Gli eventi estremi sono stati quindi 276 giorni su 1824, circa il 15,13% del totale.
La cosa più interessante è stata quando ho deciso di rappresentare in grafico quali fossero questi giorni "estremi". Volevo capire se davvero erano riconducibili a qualche evento particolare. Guardiamolo insieme, vi dice qualcosa?
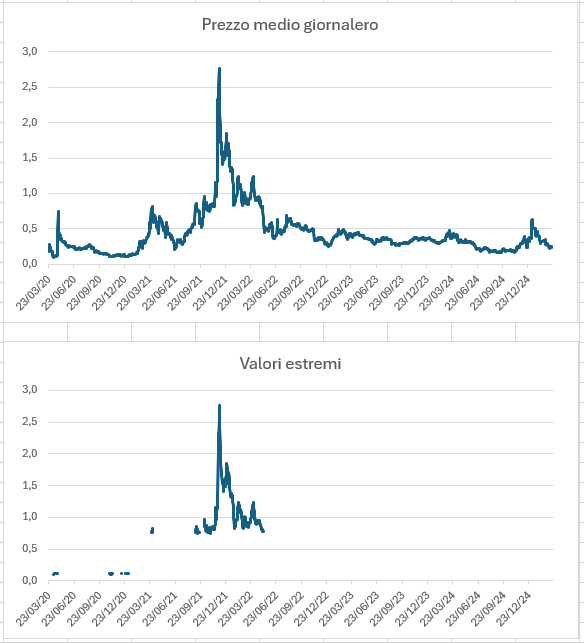
Si, la maggior parte, se non la quasi totalità degli eventi "estremi" sono da ricondurre alla bull run che è avvenuta tra fine 2021 e inizio 2022. Sono i giorni in cui HIVE ha raggiunto i suoi prezzi più alti, per poi non tornarci più.
Ha senso considerare questi giorni nel calcolo del prezzo medio dei cinque anni di HIVE? per i nostri fini secondo me no.
---
# La media di riferimento
Ho quindi proceduto a eliminare tutti i valori che fossero superiori o inferiori ad una deviazione standard dalla media e proceduto a ricalcolare la media sui prezzi giornalieri rimasti.
Il valore risultante è:
####
HIVE = 0,34085 $
Il valore risulta più allineato con la mediana e credo rappresenti meglio quello che nei primi cinque anni è stato il prezzo riconosciuto a HIVE.
Questo valore, che potremmo semplificare a 0,34 $, può fornirci una indicazione su quando sia conveniente convertire i nostri HBD piuttosto che accumularli.
- Se HIVE < 0,34 $, converto HBD in HIVE;
- Se HIVE > 0,34 $, accumulo HBD in attesa che il prezzo scenda;
---
*Con questa analisi ho cercato di offrire un riferimento più preciso a tutti gli utenti su quale sia stato il reale valore di HIVE nei suoi primi cinque anni. Spero che qualcuno con maggiori competenze in statistica di me possa fornire, magari, qualche approfondimento o intervenire correggendo eventuali errori che posso aver commesso.*
Crediti e meriti:
Vorrei dedicare questo articolo a @libertycrypto27, giusto poco tempo fa gli dissi che sarebbe stato interessante che qualcuno scrivesse una analisi sul prezzo di Hive nei primi cinque anni. Bè, ci ho provato io.
Ringrazio @friendlymoose con cui di recente abbiamo iniziato ad avere un interessante scambio di visioni sulle ricompense su Hive, sul KE e altri temi su come si possa migliorare la piattaforma. Credo che questo articolo possa fare da appendice a tutto ciò.
Il testo è stato tradotto con l'aiuto di DeepL e poi adattato dal sottoscritto.
Prima immagine: Screen di FXEMPIRE
Seconda immagine: tabella excel realizzata da @steveguereschi
Terza immaine: grafico excel realizzata da @steveguereschi
Quarta immagine: grafico excel realizzata da @steveguereschi
Quinta immagine: grafici excel realizzata da @steveguereschi
Immagine in apertura: HIVE
Text divider: Creato da @eve66

Image made with Canva
*For a long time I've wanted to find a price analysis of HIVE that would provide an idea of what the optimal value of buying this cryptocurrency is. I never found it and so I thought I would roll up my sleeves and do it myself. I am not an expert nor am I an Excel wizard. there could probably be some errors in my reasoning or evaluation, please be forgiving. My purpose is to clarify my ideas, to give me a strategy. This is not financial advice, just a user who has asked himself: ‘Below what price level is it worth buying HIVE?’
Let's get started!*
---
Some time ago I wrote that I had found a site that could calculate the historical average of HIVE. What I had never thought of, but because I really hadn't paid attention, was that from [FXEMPIRE](https://www.fxempire.it/crypto/hive/history) I could also download the data to process it.
The site doesn't have an excel download, but presenting all the data in a table, I was able to get by with good old copy-paste.

So I put in some effort, sorted out the tabulations, the cell format, replaced the commas in the thousands with much more civilised dots and constructed my data set:
- I considered the perdio from 20 March 2020 to 20 March 2025, i.e. the first five years of HIVE;
- 1824 rows, each representing one day of these five years;
- Date, Opening Price, Closing Price, Volume and Capitalisation. I had more than I needed to do my analysis.

---
# The average
The first step was to calculate the historical average of the price. I know that I could already deduce it from the FXEMPIRE site, but I wanted to check that it coincided with that data and give consistency to all the data I would process from the same source.
I therefore proceeded to:
- Calculate the daily average between the Opening Price and the Closing Price. This was for each row in my data set (I created the Average Daily column);
- Using excel's AVERAGE function, I calculated the Average Price, which was: 0.43353 $
The value obtained deviates slightly from that of FXEMPIRE but speaking of ten-thousandths I don't care and keep the one calculated by me.
Comparing the average price with the various daily average prices, I found that out of 1824 days, HIVE's price was above average by 1250, while it was below average by 574.
This raised a question in my mind: how come this upward imbalance? I therefore continued the analysis.

---
# The median
My suspicion was that in the first five years of HIVE there were some 'extreme' periods, i.e. when the price went up a lot, so much so that it distorted the value of the median somewhat. My thinking is that some external event unrelated to the value that is recognised for HIVE (a cryptocurrency fad, a trend, a war), may have caused prices to rise. Thus, the average price has risen, becoming less representative of the real value of this cryptocurrency.
To verify this, I decided to
- sort the entire distribution of prices in ascending order (from lowest to highest);
- through the AVERAGE function, calculate the Median Price of my price set, which is: 0.34848 $
Having a median below the mean confirms what I assumed. I have very high prices that push up the average, making it less representative of the real value of HIVE. This can be better understood with the average price ordering graph. At this point, I have found only one way to go.

---
# The standard deviation
I retrieved some basic statistics from when I was at university and tried to think about it. I wanted to eliminate all those values related to “extreme” events and the only way I found was to calculate the standard deviation.
*Standard deviation is a measure of the amplitude of price fluctuations around its mean and is calculated as the square root of the arithmetic mean of the squares of the price deviations from the mean.*
The definition makes it look complex, but it is easier than it sounds. The deviation calculates how much values fluctuate around their mean on average. I have considered anything above or below this oscillation to be an “extreme” event.
Excel also comes to the rescue here with the function DEV.ST and for our price set the standard deviation is $0.31405. This means that any price:
- Higher than Average Price + Standard Deviation (0.43353 + 0.31405 = 0.74757);
- Lower than Average Price - Standard Deviation (0.43353 - 0.31405 = 0.11948);
is to be considered an “extreme” event and should therefore be removed from the calculation of the average price. Analysing the data in our possession, I realised that the average price was below one standard deviation for 40 days, while it was above one standard deviation for 236 days.
The extreme events were therefore 276 days out of 1824, about 15.13% of the total.
The most interesting thing was when I decided to graph what these “extreme” days were. I wanted to see if they were really attributable to some particular event. Let's look at it together, does it ring a bell?

Yes, most, if not almost all of the “extreme” events can be traced back to the bull run that occurred between late 2021 and early 2022. These are the days when HIVE reached its highest prices and then never returned.
Does it make sense to consider these days when calculating HIVE's five-year average price? For our purposes, in my opinion, no.
---
# The reference average
I then proceeded to remove all values that were above or below one standard deviation from the average and recalculated the average on the remaining daily prices.
The resulting value is:
####
HIVE = 0.34085 $
This value is more in line with the median and I believe better represents what was the recognised price for HIVE in the first five years.
This value, which we could simplify to $0.34, can give us an indication of when it is convenient to convert our HBDs rather than hoarding them.
- If HIVE < $0.34, I convert HBDs to HIVE;
- If HIVE > $0.34, I hoard HBDs while waiting for the price to fall;
---
*With this analysis I have tried to offer a more accurate reference to all users as to what the real value of HIVE has been in its first five years. I hope that someone with more expertise in statistics than myself can perhaps provide some insight or intervene by correcting any errors I may have made.*
Credits and merits:
I would like to dedicate this article to @libertycrypto27, just a short while ago I told him that it would be interesting for someone to write an analysis on the price of Hive in the first five years. Well, I gave it a shot.
I would like to thank @friendlymoose with whom we recently started having an interesting exchange of views on rewards on Hive, KE and other topics on how the platform can be improved. I think this article can serve as an appendix to this.
The text was translated with the help of DeepL and then adapted by yours truly.
First image: Screen by FXEMPIRE
Second image: excel chart realised by @steveguereschi
Third image: excel chart realised by @steveguereschi
Fourth image: excel chart realised by @steveguereschi
Fifth image: excel chart realised by @steveguereschi
Opening image: HIVE
Text divider: Created by @eve66
Posted Using INLEO