A few days back I wrote about a project by @holoz0r for a HIVE REPORT CARD, and over the last week or so there have been a few others that are looking into the numbers also. It used to be more of a thing on Hive where people would data dive for numbers, but there hasn't been much of it over the last couple years. The numbers are a *huge part* of engagement on Hive, though most people know nothing about them. The thing with having metrics is that it further gamifies the experience in so many ways, whether as a creator or a curator, or a developer, and it is super engaging.
---

---
So, I thought I would add a few of the ones together that are recently available for people to play with, so they can get a different view of their account, or other people's accounts on Hive. First up
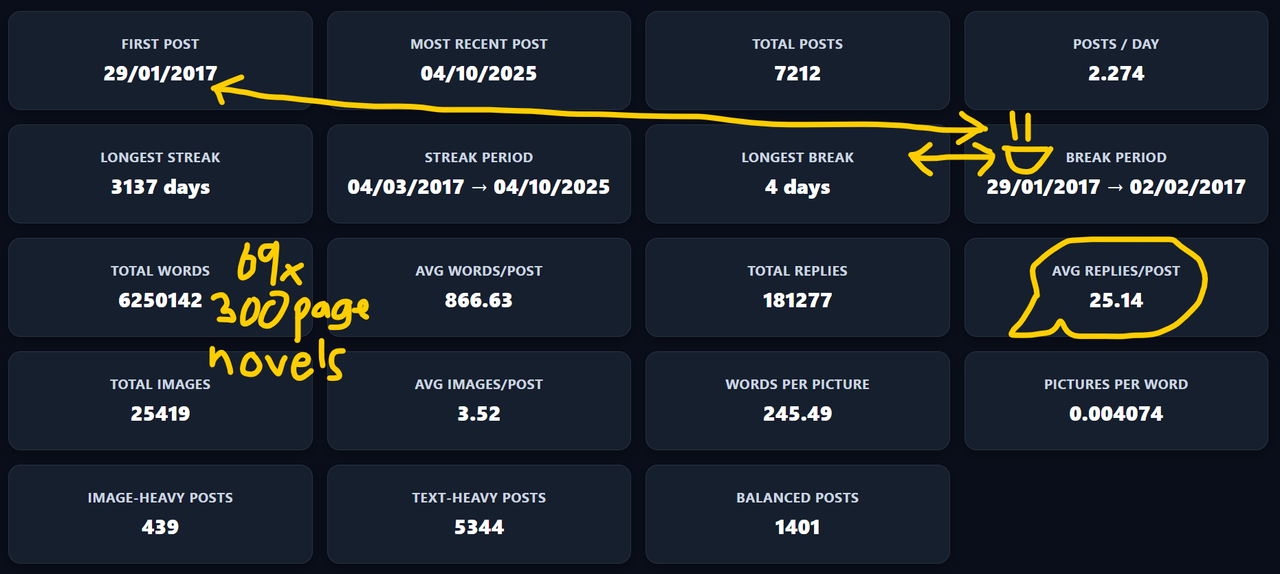
# [HIVE REPORT CARD](https://holoz0r.github.io/HiveReportCard/)
by @holoz0r
There is a heap of cool stuff in here that is worth digging around with and you can get my first impression overview from the [article](https://peakd.com/hive-126152/@tarazkp/report-a-creator) I wrote the other day on it. It is great - check it out and show some love to the creator and give a witness vote if you like the work.
# [BEE BALANCED](https://beebalanced.streamlit.app/balance_history_page)
by @beaker007
Then there is this cool site that has been up for a while but a new feature was added recently that can visualize Hive balances since the dawn of account time in a nice, easy to read, filterable graph.
This is my HP over the years:
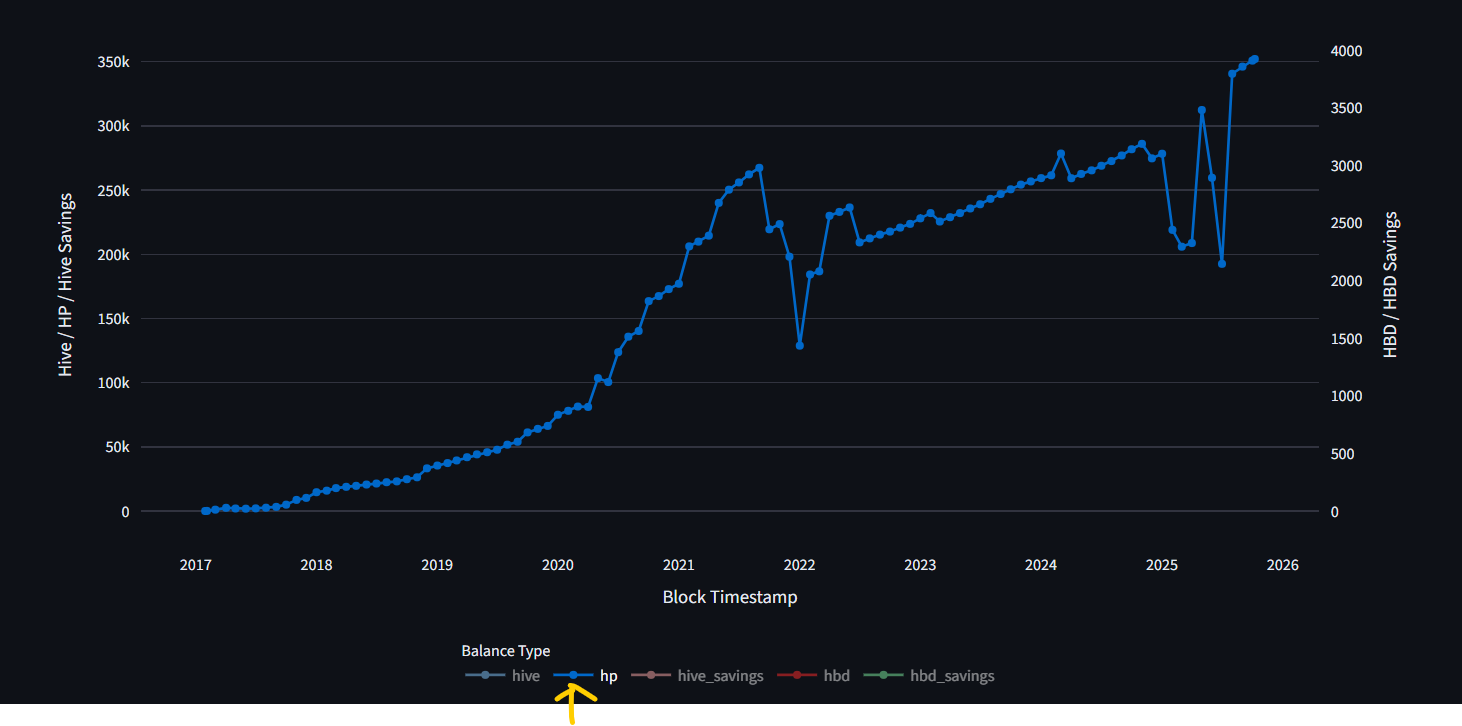
This also look at KE ratio and some Splinterlands numbers too. Have a look.
# [HIVE ANALYTICS](https://hiveanalytics.usehive.com/)
by @themarkymark
Then there is the one I haven't explored too much yet by Marky, but it will be something I dive further into on the weekend when I have some time, because it is pretty comprehensive. From first very quick looks, it looks at Hive metrics from a higher perspective as an overall view of different aspects. To access requires signing a message with the posting key using Keychain in order to get the numbers, but so far, it seems quick enough and interesting enough to look further into. Again, another witness (one of the top 20), so consider voting.
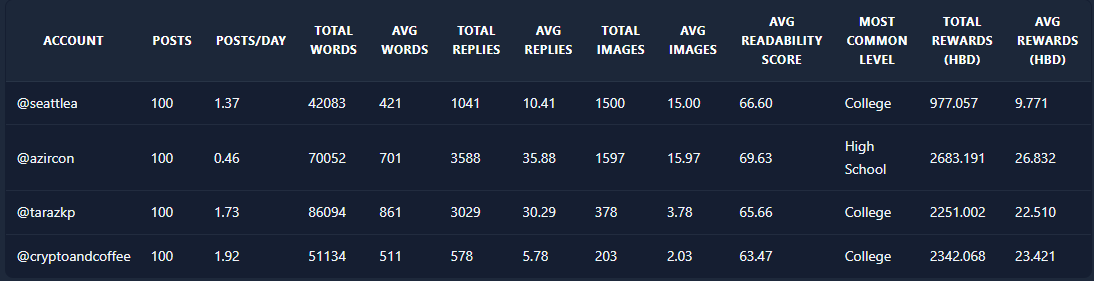
# [COMPARE HIVE AUTHORS](https://peakd.com/hive-186392/@seattlea/my-first-attempt-to-do)
by @seattlea
This one is another interesting view of Hive authors, as it is possible to compare a few simultaneously to see if there are similarities or disparities. Stealing an image from a [recent post](https://peakd.com/hive-186392/@seattlea/my-first-attempt-to-do) introducing the tool, we can have a glimpse of what it looks like. This was inspired by Holoz0r's metrics, but give a pretty cool way to see how different kinds of authors both use and interact with others. Again, another witness, so consider voting.
# Paint by Numers
The numbers don't tell the whole story of any particular account, but they can give insight into all kinds of behaviours that might not be seen daily by the average user. Having the metrics visualised should be considered a core part of any worthy interface and I think that all of the key ones should be working to increase the usage of metrics and visualising them in easy to consume ways, so people can better inform and equip themselves to interact with Hive at the level they desire.
> I wish I was smart enough to do some of this.
But I am not, so I am at the mercy of those who can and I am glad that there are now a few more people who are willing to dive back in and start to present the information that is stored on the chain. It used to be awesome to have more of this out there, and I think it used to help a lot of people (definitely me) become more interested and knowledgeable about Hive. As I learned more, I engaged more, and as I engaged more, I learned more.
For most people, it isn't about being bombarded with an oversupply of data, but it is about being able to get clean, clear views to make more informed decisions, and see progress as time wears on. It is brilliant being able to look back at account growth over ten years, or account degeneration as the case may be. It is awesome to be able to get some insight into what kinds of abuses are out there or who is getting funding, or what is the difference between my posting engagement behaviour, and those who earn more or less.
Hopefully, seeing these tools here will inspire you to explore them and learn more about Hive and the many people who are part of the community. You will find a lot of good, but also bad, and definitely ugly - but that is the point. Life is messy, and having the data visualisations can help us adjust our own behaviours to clean it up a bit.
Go and explore and comment on what kinds of interesting things you find!
Taraz
[ Gen1: Hive ]
---
**Be part of the Hive discussion.**
- Comment on the topics of the article, and add your perspectives and experiences.
- Read and discuss with others who comment and build your personal network
- Engage well with me and others and put in effort
**And you may be rewarded.**
---
Paint by Numbers?
@tarazkp
· 2025-10-08 20:50
· Finance and Economy
#hive
#economy
#analytics
#mindset
#wellbeing
#community
#data
Payout: 0.000 HBD
Votes: 317
More interactions (upvote, reblog, reply) coming soon.