Welcome back,
In the last blog, we talked about the top 3 tokens which I am looking at and in which I personally invested after the recent market crash took place.
Today, I am going to share the technical analysis of one of those tokens, and I think it is among the strongest tokens in this cycle. It is one of the best tokens I have seen perform extraordinarily with a solid use case. This is not just another coin that pumped because of hype.
This is not a promotion at all, so I still request you to do your own research before doing anything. The crypto market is quite risky, and even the best of tokens can go down. But once you do your own research, the chances of regret later become less because your actions are based on analysis, not on blind decisions.
The token I am talking about is SUI, and I am going to share the technical analysis of it now. In the screenshot below, you can see the 1-day time frame chart for SUI token.
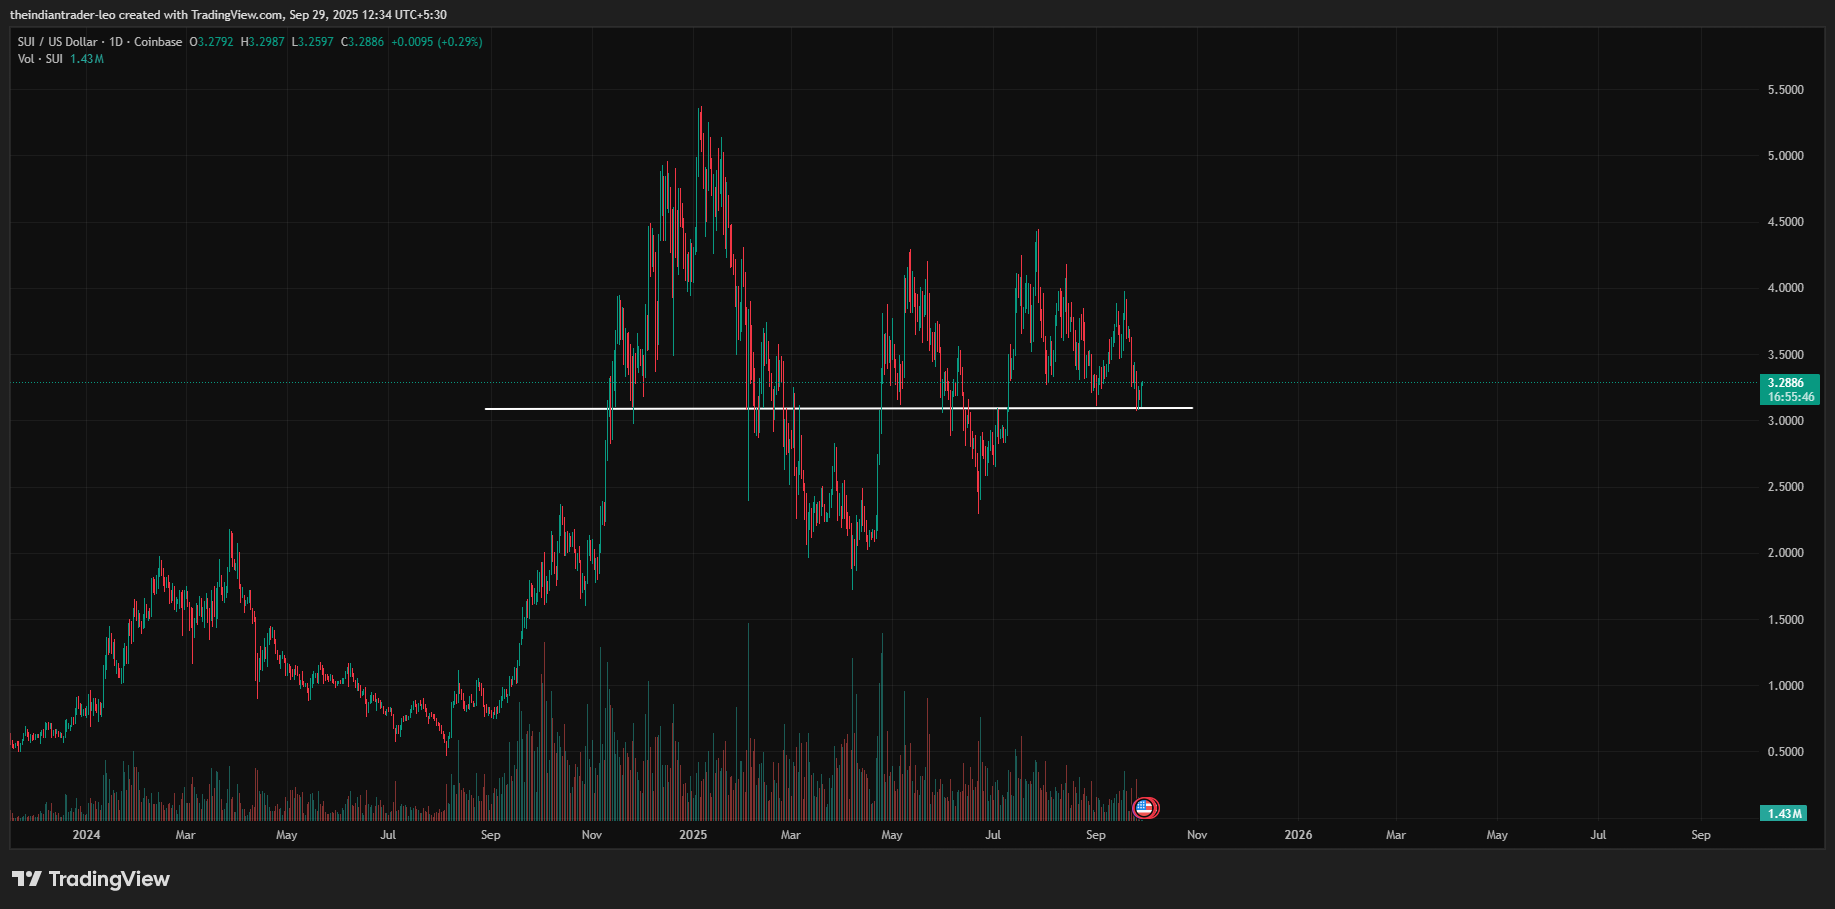
Now, in the screenshot above, you can see that there is a support trendline drawn by me on the 1-day time frame, and SUI token has tested it multiple times and survived that support line. We also saw a time period where it broke downwards, but that was when the entire crypto market was crashing, and almost every other token was behaving in the same manner.
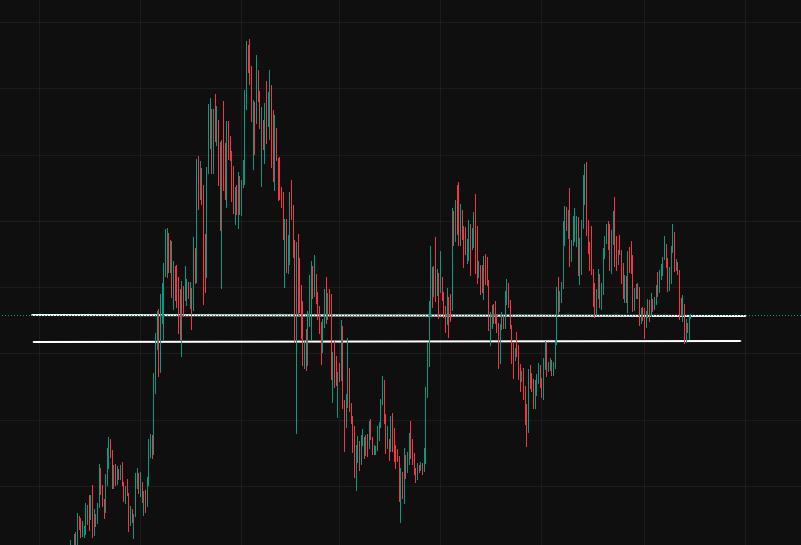
In the screenshot below, I am going to show how the support has been confirmed successfully, and now we are currently testing the resistance at $3.28. If this gets broken, we are going to see SUI token going once again above it and pumping nicely.
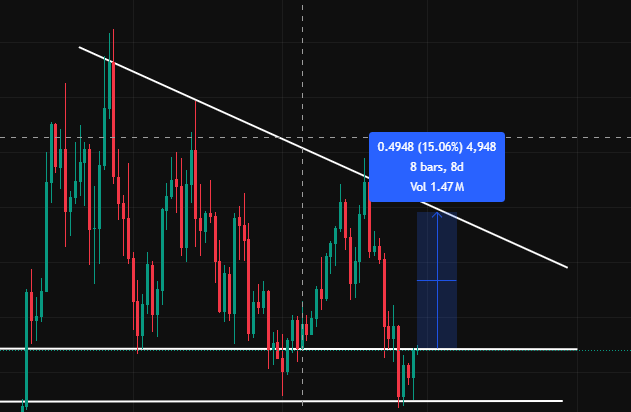
Now, let me share another screenshot with a diagonal resistance. You can see that in the screenshot below, and SUI token has tested this resistance for three times, but it has also been consistently getting rejected from that resistance since July 27. So it has been almost two months that SUI token is rejecting from the same resistance.
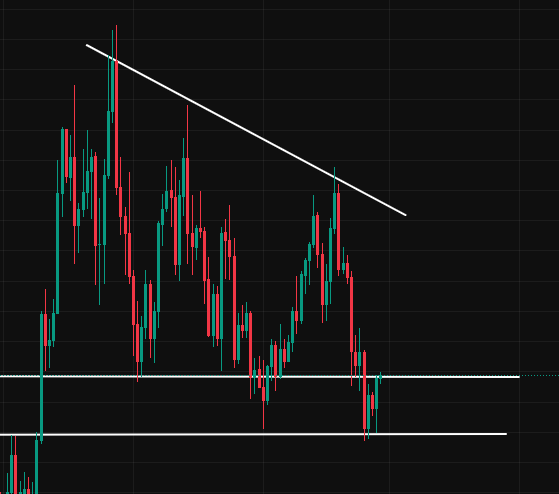
If we extend that trendline and look at the chart again, then after breaking the current resistance, a 15% pump is going to come in SUI token for sure. You can see in the screenshot below where I have marked the area which can be captured by SUI after breaking the current resistance.
So I have shared all the important levels in this blog, and I hope anyone who wants to look at the SUI token for opportunities will check the levels I shared. It will definitely help you.
Remember one more thing: if the second resistance, which is the diagonal resistance, gets broken, then we can see an even bigger pump in SUI token. 15% is easily going to be captured, but if it breaks that resistance successfully, then it can be anything above 15%.
So let’s see what happens. Do your own research, and I will see you all in my next blog.
Thank you and happy trading everyone.

Posted Using INLEO