10 days after the bounce of BTS from $0.15 on the 7th of Feb, BTS has been ranging sideways and updward slowly. As at time of writing BTS is trading at $0.27 which leave still in a profit zone since last update. MACD still gives assurance of future uptrend. This is a hold or accumulate situation.
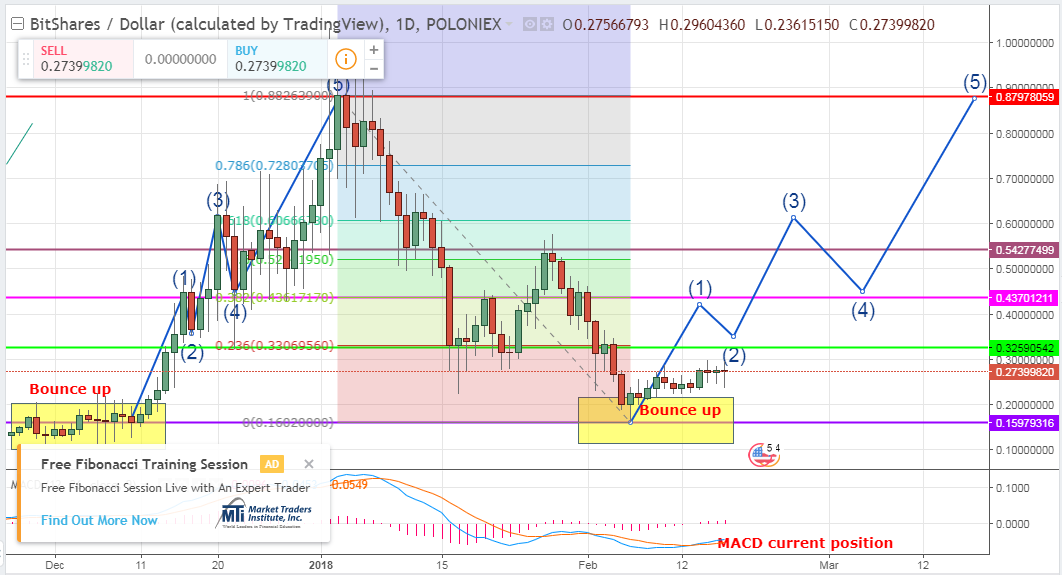
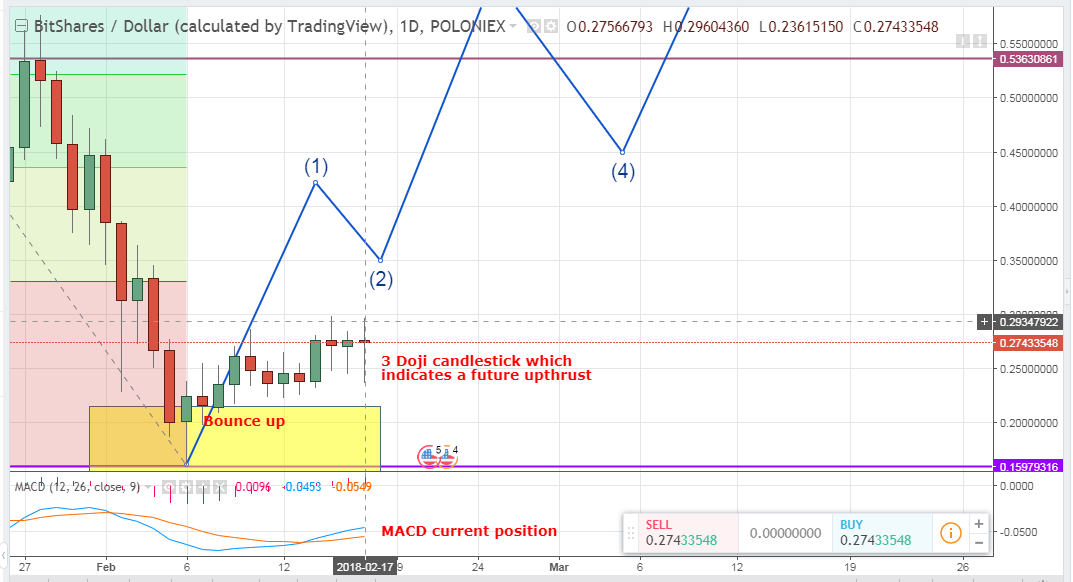
3 Doji has been formed in the last 3 days and the Doji is a transitional Candlestick formation, signifying equality and/or indecision between bulls and bears. The Doji is mostly found at the bottom and top of trends and thus is considered as a sign of possible reversal of price direction, but the Doji can be viewed as a continuation pattern as well that why i mention the price has been ranging for days now.
Expect a sudden price reversal but this time a high probability in the uptrend due to MACDs position. BTS looking positive for day, long and margin traders.
CAVEAT: The analysis is based Education, my opinion and trading decisions. Good luck and trade with caution.
Your Comments, suggestion and questions are highly welcomed
If this blog post has entertained or helped you to profit,
Please UPVOTE, FOLLOW, RESTEEM and/or consider giving some donations:
BTS Wallet - trizle1
BTC Wallet - 1AxEcPUi6nNQDaaT8CKTohmBKeYFhUJyFE
ETH Wallet - 0xDFf7E134291E1C82F98E3976be47BC3484F595B9
LTC Wallet - LbpwNMUYPj2uPMXh6RiDwvzap7UBtQGiAS