Bitcoin (BTC/USD) is currently trading at $117,967, showing a +1.26% gain for the day. The recent price action indicates renewed bullish momentum after a period of consolidation.
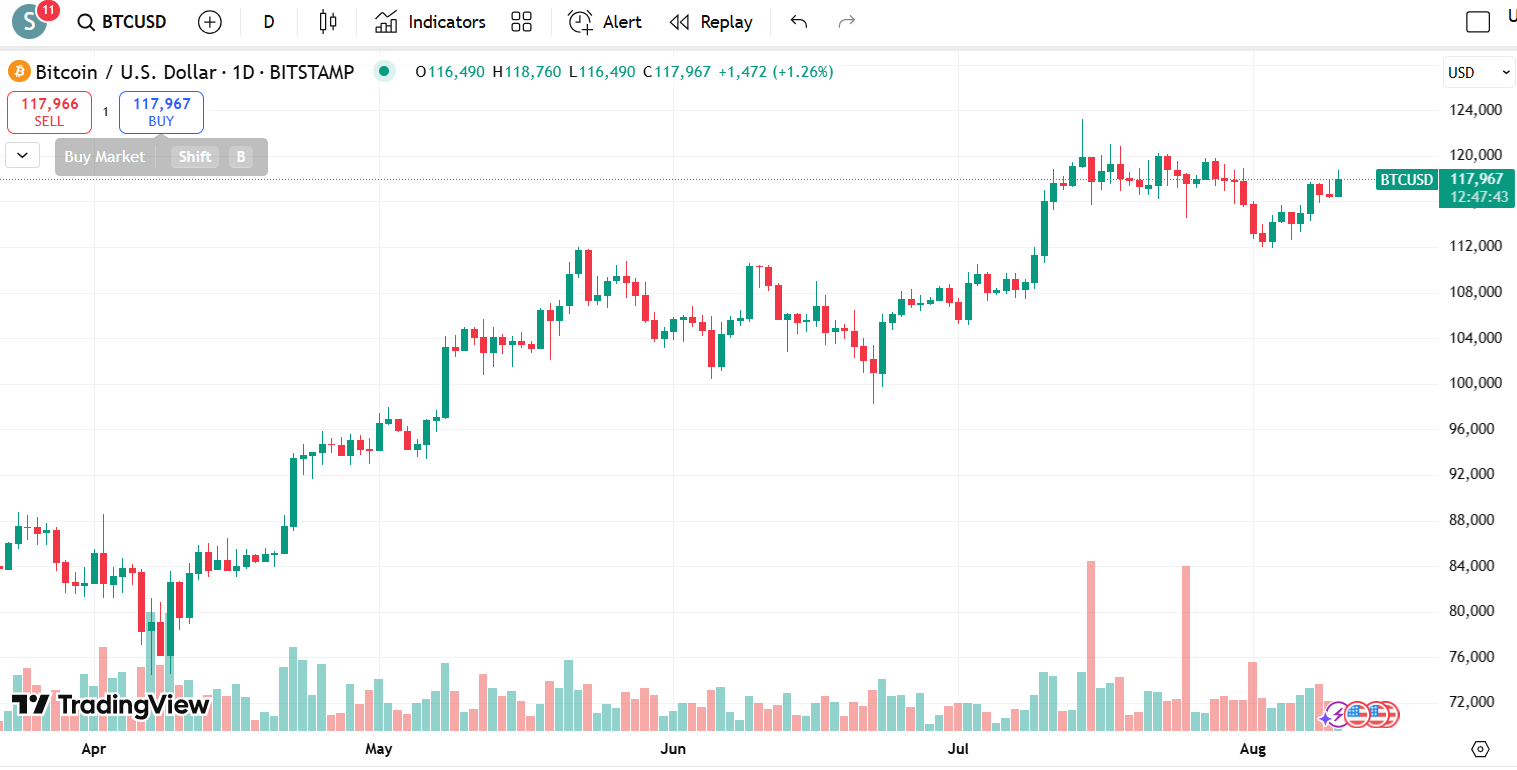
Chart Overview
- Trend: The daily chart shows a clear uptrend since early April, with higher highs and higher lows.
- Current Structure: After peaking near $120,000 in late July, BTC corrected to the $112,000–$113,000 zone before bouncing back.
- Volume: Trading volume has picked up slightly during the latest upward push, hinting at growing buying interest.
Key Levels
- Resistance:
- $118,500–$120,000: Major resistance zone from previous highs. A daily close above this could open the way for a retest of $124,000 and potentially higher.
- Support:
- $115,000: Immediate short-term support from recent pullback lows.
- $112,000: Stronger support level, previously tested multiple times.
Indicators & Momentum
- Price Action: The bullish candle formation over the past few days suggests buyers are regaining control.
- Trend Continuation Potential: The recovery from the $112K level has been steady, without signs of major selling pressure.
- Breakout Watch: A decisive break and daily close above $120K could trigger a continuation rally toward $124K–$126K.
Expectations
If BTC can sustain momentum and break above $120K with strong volume, a short-term bullish rally toward $124K+ is likely.
However, if rejection occurs again near this zone, a retest of $115K–$112K support is probable before the next leg up.
Outlook: Bullish bias, but with a critical resistance test ahead. Traders should watch for a confirmed breakout or rejection at the $120K zone to determine the next move.