Update since August 10 TA
Two days ago, Bitcoin (BTC/USD) was trading at $117,967, pushing toward the critical $120,000 resistance zone. The bias was bullish, with expectations that a breakout above $120K could open the way to $124K, while support rested at $115K and $112K.
What Has Happened Since?
- BTC briefly tested the $120K zone but has not yet managed a decisive breakout.
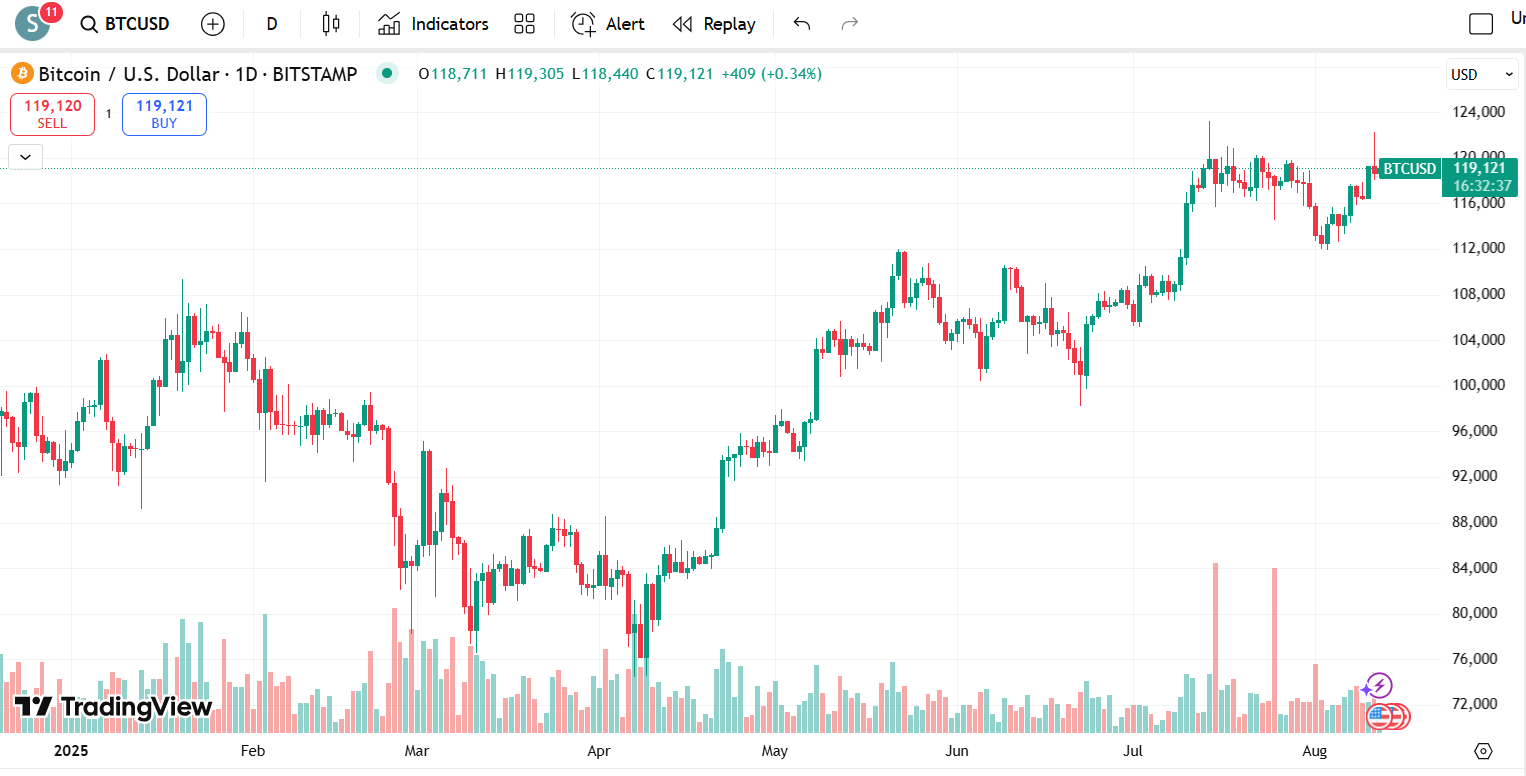
- Price is currently around $119,121, up slightly from two days ago, showing that buyers are still active but cautious near resistance.
- Trading volume has remained relatively steady, with no major spike indicating an aggressive push from bulls yet.
Current Chart Overview
- Trend: The strong uptrend from April remains intact, with higher highs and higher lows still forming.
- Resistance: $120,000 remains the key barrier — it has been tested multiple times but not yet broken.
- Support:
- $116,000–$115,000: Short-term support holding recent pullbacks.
- $112,000: Stronger base from which the last rally began.
Key Observations
- BTC is consolidating just below resistance, which can be a bullish continuation pattern if volume increases.
- A clean daily close above $120K could trigger a strong breakout.
- On the downside, if $116K is lost, a retest of $112K becomes more likely.
Expectations Going Forward
- Bullish Scenario: A decisive move above $120K with strong buying volume could quickly send BTC toward $124K–$126K.
- Bearish Scenario: Failure to break resistance followed by a close below $116K could open the way for a deeper pullback toward $112K.
Outlook: Still bullish, but BTC is at a make-or-break point. The next move above or below this tight range will likely set the tone for the rest of August.