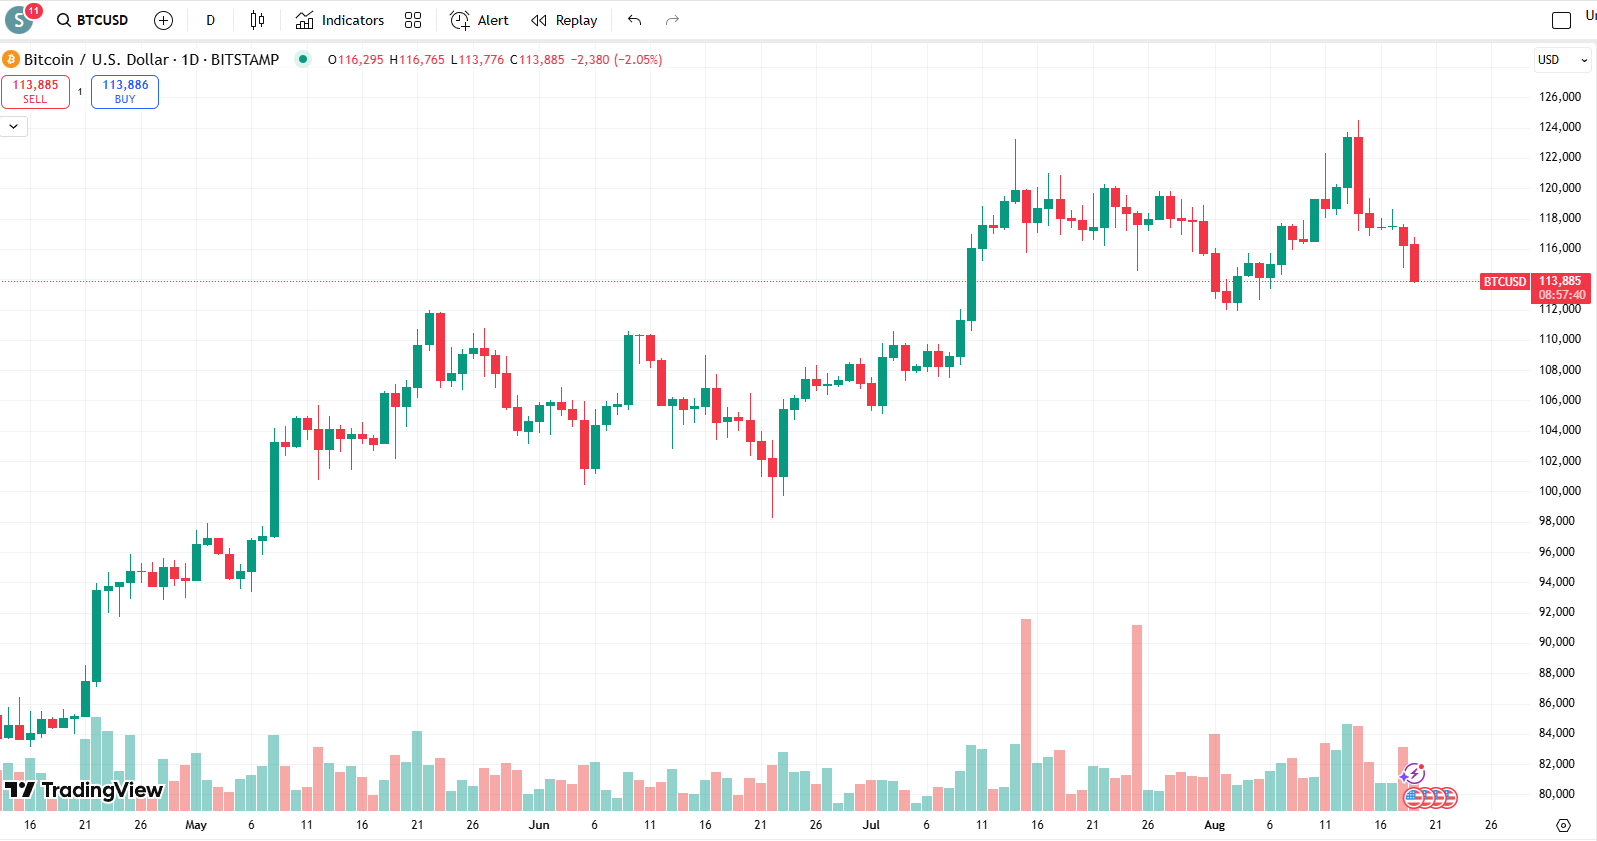
Bitcoin has taken a hit in the last couple of days, now trading around $113,885, down more than 2% today. After testing the $124K zone earlier this month, BTC has been on a steady pullback, and the chart is showing clear weakness in the short term.
What’s Happening?
- BTC failed to hold above $120K, and sellers stepped in heavily.
- We now see a drop toward the $113K–$114K region, which is just above the important $112K support zone.
- The red candles are growing larger, and trading volume has increased — a sign that bears are currently in control.
Key Levels to Watch
- Resistance: $118K–$120K remains the level to beat for bulls. Until BTC reclaims this area, upward momentum looks limited.
- Support:
- Immediate support: $112K.
- If $112K fails, we could see a deeper move toward $108K–$106K.
What to Expect
- Bullish Scenario: If Bitcoin can hold $112K and bounce back, we could see another push to retest the $118K–$120K area. A strong daily close above $120K would flip the outlook bullish again.
- Bearish Scenario: A breakdown below $112K would likely open the door to $108K and even $104K, extending this correction further.
📊 Outlook: Short-term momentum is bearish, but the big picture trend is still intact. The $112K level will be critical in deciding whether this is just a healthy pullback — or the start of a deeper correction.
What do you think — are we about to see a bounce, or is more downside ahead?